


收敛数列:
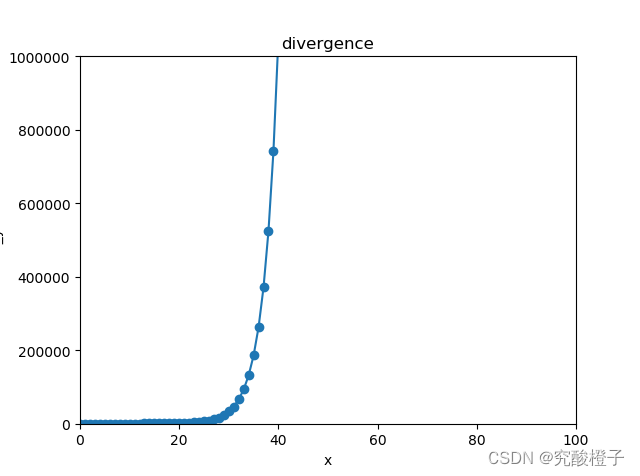
发散数列:
代码思路:首先定义列表并将数列计算的值添加到列表中,然后添加x轴的列表并使用pyplot绘制图形。
代码:
# @Time    : 2023/6/8 15:08
# @Author  : 超级小橙子
# @File    : 数列极限.py

from matplotlib import pyplot as plt
#收敛数列
def convergence():
    """"收敛数列100000/2^n"""
    # 定义收敛数列值的列表
    con_list = []
    for n in range(100):
        con_s = 100000 / 2 ** n
        con_list.append(con_s)
    #返回列表
    return con_list

#发散数列
def divergence():
    """发散数列:1/2^(-n/2)"""
    # 定义发散数列值的列表
    di_list = []
    for n in range(100):
        di_s = 1 / (2 ** (-n / 2))
        di_list.append(di_s)
    # 返回列表
    return di_list

if  __name__ == "__main__":
    x= list(i for i in range(100))
    con_y = convergence()
    di_y = divergence()
    """绘图"""
    #发散数列
    plt.figure()
    plt.ylim(0,1000000)
    plt.xlim(0,100)
    plt.title("divergence")
    plt.ylabel("di_y")
    plt.xlabel("x")
    plt.scatter(x,di_y)
    plt.plot(x,di_y)
    plt.show()
    #收敛数列
    plt.figure()
    plt.ylim(0, 1)
    plt.xlim(0, 100)
    plt.title("convergence")
    plt.ylabel("con_y")
    plt.xlabel("x")
    plt.scatter(x,con_y)
    plt.plot(x,con_y)
    plt.show()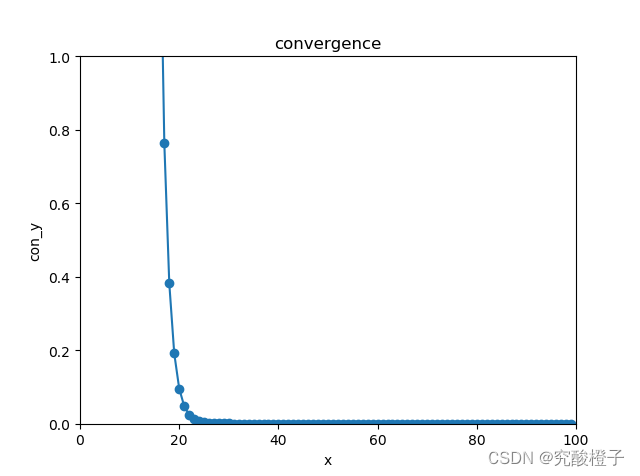


 2万+
2万+


 被折叠的 条评论
为什么被折叠?
被折叠的 条评论
为什么被折叠?
 到【灌水乐园】发言


