


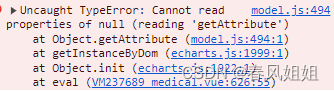
报错:Uncaught TypeError: Cannot read properties of null (reading 'getAttribute'),
我所出现的问题是
1,我在循环方法的时候 id没有从0开始,把id变成从0开始循环
2,设置myChart 全局属性
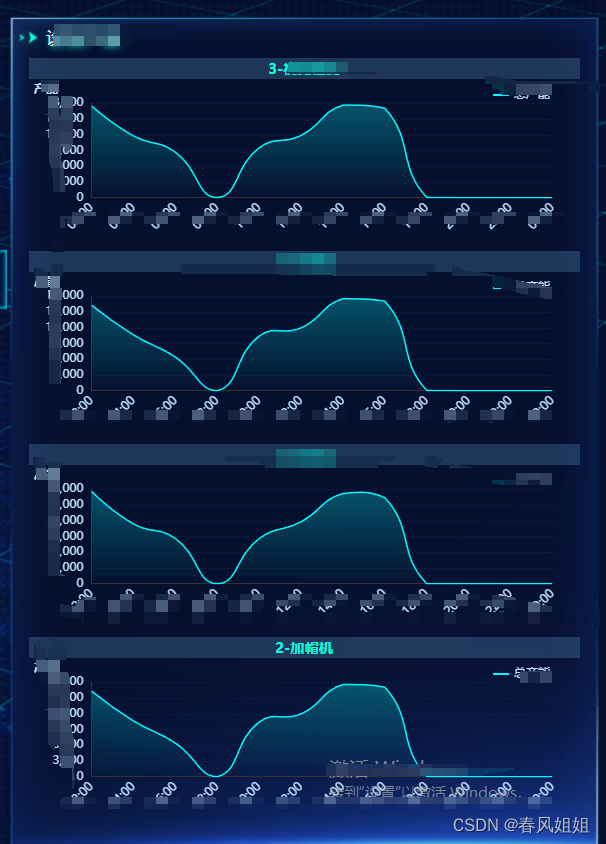
呈现效果
代码
html 动态绑定id
 <ul>
   <li v-for="(item, index) in leftList" :key="index" v-if="leftList.length > 0">
       <div class="cl_title">{{ item ? item.device_ID + '-' + item.name : '-' }}
       </div>
       <div :id="'main' + index" :ref="'main' + index" style="height: 1.7rem"></div>
   </li>
</ul>
js
mounted(){
 this.init()
}
 methods: {
 init() {
 // 需要传的参数
    let params = {
        start: this.setTime ,
        end: this.setTime
    }
    GetRunStatus(params).then(res => {
        // console.log(res, 'reso---');
        const { Data, ReturnCode } = res
        if (ReturnCode == 200) {
        //处理数据
            this.leftList = Data
            let listes = []
            let list = []
            let linees = []
            this.leftList.forEach((e, i) => {
                // console.log(e.status1 / Number(e.status1 + e.status2 + e.status3).toFixed(2), '---33--');
                let namei1 = { name: '作业时长', value: ((e.status1 / (e.status1 + e.status2 + e.status3)).toFixed(2)) * 100 }
                let namei2 = { name: '待机时长', value: ((e.status2 / (e.status1 + e.status2 + e.status3)).toFixed(2)) * 100 }
                let namei3 = { name: '故障时长', value: ((e.status3 / (e.status1 + e.status2 + e.status3)).toFixed(2)) * 100 }
                list = [namei1, namei2, namei3]
                listes.push(list)
                linees.push(e.timeLine)

            })
            // 线图

            this.$nextTick(() => {
            //处理数据
                this.arrList1 = []
                this.arrLList1 = []
                linees.forEach((e, i) => {
                    this.arrList = []
                    this.arrLList = []

                    e.forEach((k, ki) => {
                        k.name2 = k.name.split(' ')[1]
                        this.arrList.push(k.name2)
                        this.arrLList.push(k.totalAmount)
                    })
                    this.arrList1.push(this.arrList)
                    this.arrLList1.push(this.arrLList)
                })

                // 折线图在这里,循环方法 我这里的id是从0开始(从1开始不生效),也就是 id = 'main0,main1,main2,main3,main4...'
                for (let i = 0; i < this.leftList.length; i++) {
                    this.drawLine1(i, 'main', this.arrList1[i], this.arrLList1[i]);
                }
            })
        }
    })
},
drawLine1(i, idName, xData, yData) {

   let this_ = this;
   //设置myChart 全局属性
   this_.myChart = echarts.init(document.getElementById('main' + i));


   let resizeTimer = null;

   let option = {
       title: {
           text: '产能',
           textStyle: {
               color: '#BEE0FE',
               fontSize: 12
           }
       },
       tooltip: {
           trigger: 'axis'
       },
       legend: {
           data: [ '总产能'],
           icon: "rect", // 图例icon为方块
           itemHeight: 2, // 图例icon高度
           itemWidth: 16, // 图例icon宽度
           textStyle: {
               color: '#BEE0FE',
               fontSize: 12
           },
           x: 'right',
           padding: [10, 30, 0, 0]
       },
       grid: {
           left: '3%',
           right: '5%',
           bottom: '3%',
           top: '15%',
           containLabel: true
       },

       xAxis: {
           type: 'category',
           boundaryGap: false,
           data: xData,
           axisLabel: {
               show: true,
               interval: 0,
               rotate: 45,
               fontSize: 12,
               textStyle: {
                   color: '#BEE0FE' //X轴文字颜色
               }
           },
           axisTick: {
               show: false
           }
       },
       yAxis: {
           // max: 100,
           // min: 0,
           type: 'value',
           axisLabel: {
               show: true,

               fontSize: 12,
               textStyle: {
                   color: '#BEE0FE' //X轴文字颜色
               }
           },
           splitLine: {
               show: true,
               lineStyle: {
                   color: '#1E2573',
                   width: 0.5,
                   type: 'dashed'
               }
           },
           axisTick: {
               show: false
           }
       },
       series: [
           {
               name: '总产能',
               type: 'line',

               smooth: true, //圆滑的曲线
               symbol: 'circle', //设定为实心点
               symbolSize: 6, //设定实心点的大小
               data: yData,
               smooth: true,

               itemStyle: {
                   normal: {
                       color: 'rgba(0, 251, 255, 1)',
                       lineStyle: {
                           width: 1.5,
                           normal: {
                               width: 2,
                               color: 'rgba(0, 251, 255, 1)' // 线条颜色
                           }
                       }
                   }
               },
               areaStyle: {
                   normal: {
                       //线性渐变,前4个参数分别是x0,y0,x2,y2(范围0~1);相当于图形包围盒中的百分比。如果最后一个参数是‘true’,则该四个值是绝对像素位置。
                       color: new echarts.graphic.LinearGradient(
                           0,
                           0,
                           0,
                           1,
                           [
                               {
                                   offset: 0,
                                   color: 'rgba(0, 251, 255, 0.4)'
                               },
                               {
                                   offset: 1,
                                   color: 'rgba(0, 251, 255, 0)'
                               }
                           ],
                           false
                       )
                   }
               }
           },


       ]
   };
   this_.myChart.setOption(option, true);
   this_.myChart.resize();

   window.addEventListener('resize', () => {
       if (resizeTimer) clearTimeout(resizeTimer);
       resizeTimer = setTimeout(() => {
           echarts.init(document.getElementById('main' + i)).resize();
       }, 100);
   });
},
 }


 2020
2020


 被折叠的 条评论
为什么被折叠?
被折叠的 条评论
为什么被折叠?
 到【灌水乐园】发言


