


def txt_split(path):
    if os.path.splitext(path)[1] == '.txt':
        f = open(path)  # 打开文件
        for line in f.readlines():
            lines = line.strip().split(" ")
            if len(lines) == 3:
                with open("E:\自定义路径\person.txt", 'a') as w:
                    if lines[-1] == '1':
                        w.write(line)
            else:
                continue
        w.close()
        f.close()  # 关闭文件

if __name__ == '__main__':
    path = r"E:\VOCtrainval_11-May-2012\VOCdevkit\VOC2012\ImageSets\Main\person_trainval - 副本.txt"
    out = txt_split(path)
查看图片及图片中的标签框,转载于源链接
import xml.etree.ElementTree as ET
import pickle
import os
from os import listdir, getcwd
from os.path import join
import cv2
import matplotlib.pyplot as plt
from math import sqrt as sqrt
# 需要检查的数据
sets=[('2012', 'person')]
# 需要检查的类别
classes = ['person']
# 输入分辨率
input_size = 320
if __name__ == '__main__':
VOCRoot = 'E:/xunlei/VOCtrainval_11-May-2012/VOCdevkit'
# GT框宽高统计
width = []
height = []
for year, image_set in sets:
for line in open(VOCRoot + '/VOC%s/ImageSets/Main/%s.txt'%(year, image_set)):
image_id, value = line.split()
if value != '1':
continue
# 图片的路径
img_path = 'E:/xunlei/VOCtrainval_11-May-2012/VOCdevkit/VOC%s/JPEGImages/%s.jpg'%(year, image_id)
# 这张图片的XML标注路径
label_file = open('E:/xunlei/VOCtrainval_11-May-2012/VOCdevkit/VOC%s/Annotations/%s.xml' % (year, image_id))
tree = ET.parse(label_file)
root = tree.getroot()
size = root.find('size')
img_w = int(size.find('width').text) # 原始图片的width
img_h = int(size.find('height').text) # 原始图片的height
img = cv2.imread(img_path)
for obj in root.iter('object'):
difficult = obj.find('difficult').text
cls = obj.find('name').text
# 如果标注不是需要的类别或者标注为difficult,就忽略
if cls not in classes or int(difficult) == 1:
continue
cls_id = classes.index(cls)
xmlbox = obj.find('bndbox')
xmin = int(xmlbox.find('xmin').text)
ymin = int(xmlbox.find('ymin').text)
xmax = int(xmlbox.find('xmax').text)
ymax = int(xmlbox.find('ymax').text)
w = xmax - xmin
h = ymax - ymin
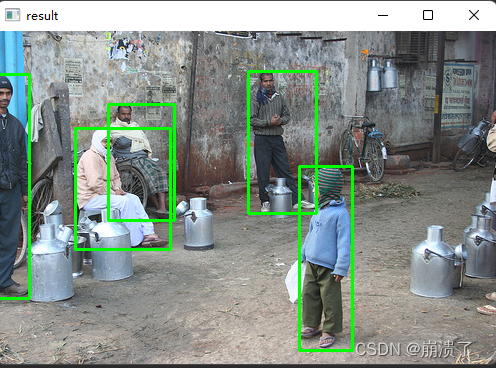
img = cv2.rectangle(img, (xmin, ymin), (xmax, ymax), (0, 255, 0), 2)
w_change = (w / img_w) * input_size
h_change = (h / img_h) * input_size
s = w_change * h_change # 得到了GT框面积
width.append(sqrt(s))
height.append(w_change / h_change)
print(img_path)
cv2.imshow('result', img)
cv2.waitKey(0)
plt.plot(width, height, 'ro')
plt.show()
结果展示:


 2万+
2万+

 被折叠的 条评论
为什么被折叠?
被折叠的 条评论
为什么被折叠?
 到【灌水乐园】发言


