


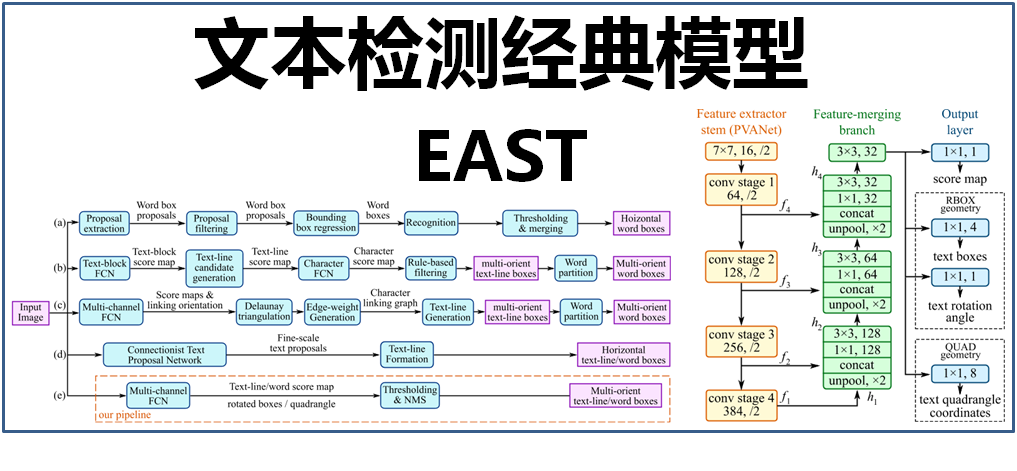
 EAST是一种端到端的文本检测模型,简化了传统文本检测的多阶段过程,直接预测文本行,提高了检测效率和准确性。该模型采用全卷积网络和非极大抑制,支持多角度文本检测。
EAST论文
EAST代码
EAST原理讲解【知乎】
传统的文本检测方法和一些基于深度学习的文本检测方法,大多是multi-stage,在训练时需要对多个stage调优,这势必会影响最终的模型效果,而且非常耗时.针对上述存在的问题,EAST提出了端到端的文本检测方法,消除中间多个stage(如候选区域聚合,文本分词,后处理等),直接预测文本行.
一、EAST模型简介
本文介绍的文本检测模型EAST,便简化了中间的过程步骤,直接实现端到端文本检测,优雅简洁,检测的准确性和速度都有了进一步的提升。如下图:
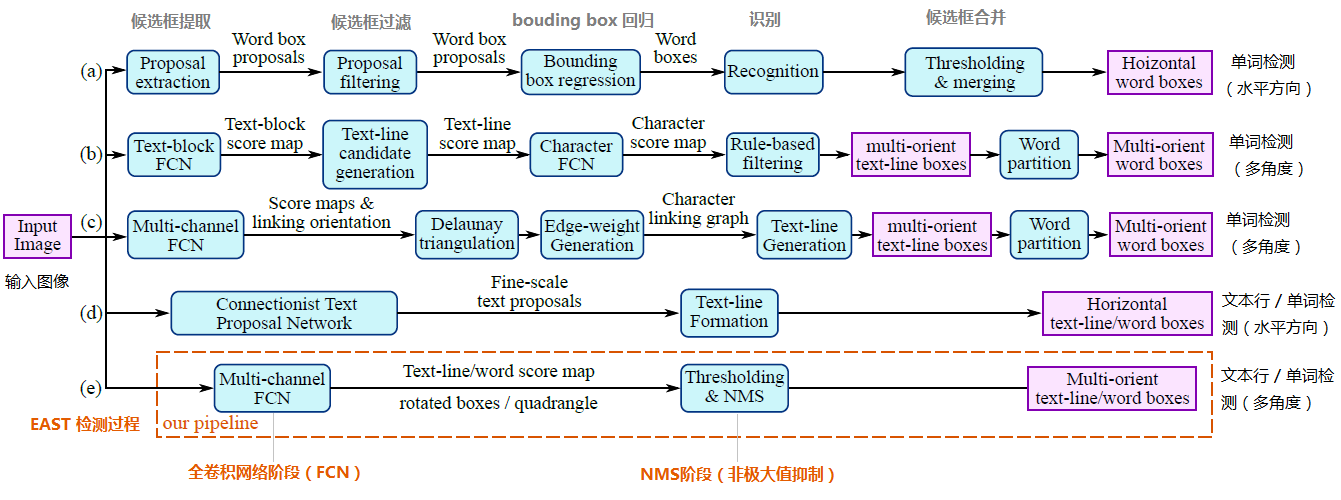
其中,(a)、(b)、(c)、(d)是几种常见的文本检测过程,典型的检测过程包括候选框提取、候选框过滤、bouding box回归、候选框合并等阶段,中间过程比较冗长。而(e)即是本文介绍的EAST模型检测过程,从上图可看出,其过程简化为只有FCN阶段(全卷积网络)、NMS阶段(非极大抑制),中间过程大大缩减,而且输出结果支持文本行、单词的多个角度检测,既高效准确,又能适应多种自然应用场景。(d)为CTPN模型,虽然检测过程与(e)的EAST模型相似,但只支持水平方向的文本检测,可应用的场景不如EAST模型。如下图:

二、EAST模型网络结构
EAST模型的网络结构,如下图:
EAST模型的网络结构分为特征提取层、特征融合层、输出层三大部分。
下面展开进行介绍:
1、特征提取层
基于PVANet(一种目标检测的模型)作为网络结构的骨干,分别从stage1,stage2,stage3,stage4的卷积层抽取出特征图,卷积层的尺寸依次减半,但卷积核的数量依次增倍,这是一种“金字塔特征网络”(FPN,feature pyramid network)的思想。通过这种方式,可抽取出不同尺度的特征图,以实现对不同尺度文本行的检测(大的feature map擅长检测小物体,小的feature map擅长检测大物体)。这个思想与前面文章介绍的SegLink模型很像;
2、特征融合层
将前面抽取的特征图按一定的规则进行合并,这里的合并规则采用了U-net方法,规则如下:
- 特征提取层中抽取的最后一层的特征图(f1)被最先送入unpooling层,将图像放大1倍
- 接着与前一层的特征图(f2)串起来(concatenate)
- 然后依次作卷积核大小为1x1,3x3的卷积
- 对f3,f4重复以上过程,而卷积核的个数逐层递减,依次为128,64,32
- 最后经过32核,3x3卷积后将结果输出到“输出层”
3、输出层
最终输出以下5部分的信息,分别是:
- score map:检测框的置信度,1个参数;
- text boxes:检测框的位置(x, y, w, h),4个参数;
- text rotation angle:检测框的旋转角度,1个参数;
- text quadrangle coordinates:任意四边形检测框的位置坐标,(x1, y1), (x2, y2), (x3, y3), (x4, y4),8个参数。
其中,text boxes的位置坐标与text quadrangle coordinates的位置坐标看起来似乎有点重复,其实不然,这是为了解决一些扭曲变形文本行,如下图:
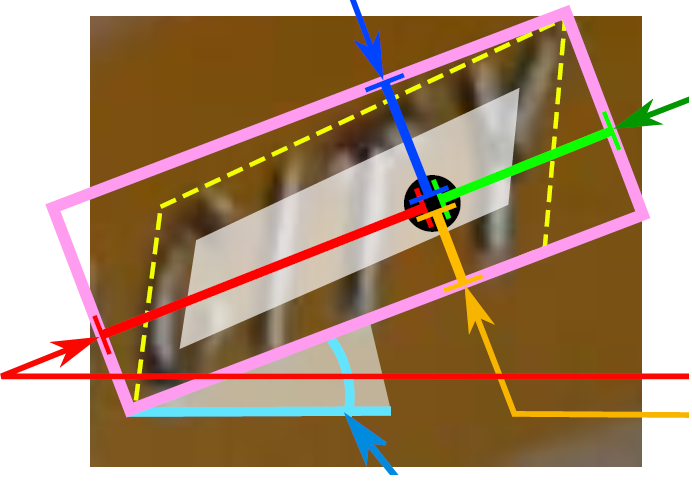
如果只输出text boxes的位置坐标和旋转角度(x, y, w, h,θ),那么预测出来的检测框就是上图的粉色框,与真实文本的位置存在误差。而输出层的最后再输出任意四边形的位置坐标,那么就可以更加准确地预测出检测框的位置(黄色框)。
三、EAST模型效果
EAST文本检测的效果如下图,其中,部分有仿射变换的文本行的检测效果(如广告牌)
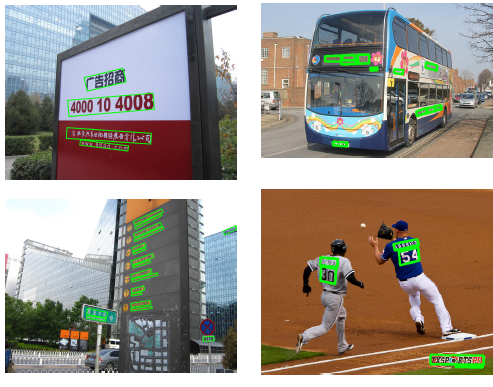
EAST模型的优势在于简洁的检测过程,高效、准确,并能实现多角度的文本行检测。但也存在着不足之处,例如(1)在检测长文本时的效果比较差,这主要是由于网络的感受野不够大;(2)在检测曲线文本时,效果不是很理想
四、Advanced EAST
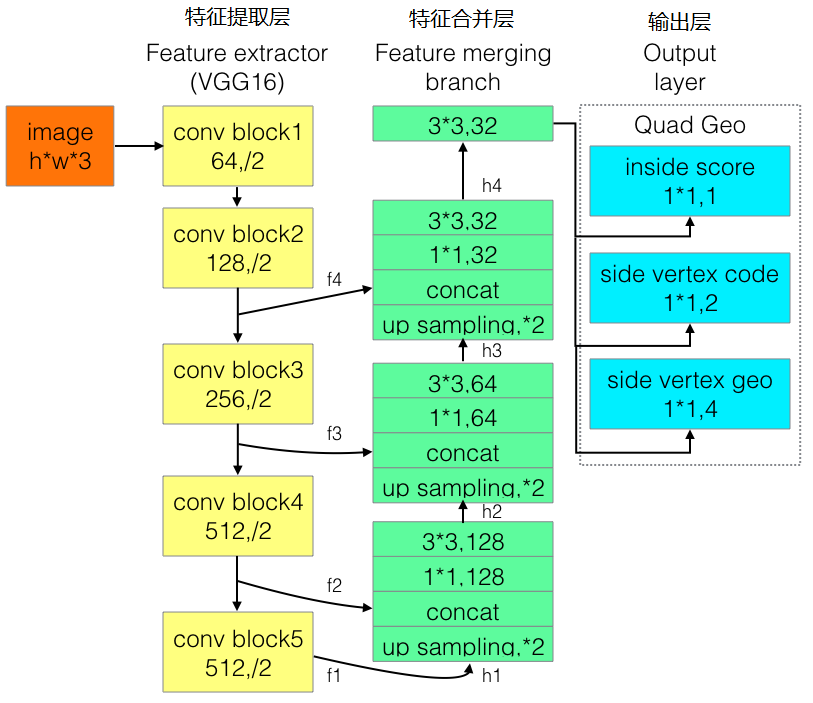
为改进EAST的长文本检测效果不佳的缺陷,有人提出了Advanced EAST,以VGG16作为网络结构的骨干,同样由特征提取层、特征合并层、输出层三部分构成。经实验,Advanced EAST比EAST的检测准确性更好,特别是在长文本上的检测。
网络结构如下:
五、EAST python代码:
from imutils.object_detection import non_max_suppression
import numpy as np
import argparse
import time
import cv2

# construct the argument parser and parse the arguments
width = 320
height = 320
min_confidence = 0.5
modelpath = "frozen_east_text_detection.pb"
imagepath = "D:/test/4.jpg"
# load the input image and grab the image dimensions
image = cv2.imread(imagepath)
orig = image.copy()
(H, W) = image.shape[:2]

# set the new width and height and then determine the ratio in change
# for both the width and height
(newW, newH) = (width, height)
rW = W / float(newW)
rH = H / float(newH)

# resize the image and grab the new image dimensions
image = cv2.resize(image, (newW, newH))
(H, W) = image.shape[:2]

# define the two output layer names for the EAST detector model that
# we are interested -- the first is the output probabilities and the
# second can be used to derive the bounding box coordinates of text
layerNames = [
    "feature_fusion/Conv_7/Sigmoid",
    "feature_fusion/concat_3"]

# load the pre-trained EAST text detector
print("[INFO] loading EAST text detector...")
net = cv2.dnn.readNet(modelpath)

# construct a blob from the image and then perform a forward pass of
# the model to obtain the two output layer sets
blob = cv2.dnn.blobFromImage(image, 1.0, (W, H),
                             (123.68, 116.78, 103.94), swapRB=True, crop=False)
start = time.time()
net.setInput(blob)
(scores, geometry) = net.forward(layerNames)
end = time.time()

# show timing information on text prediction
print("[INFO] text detection took {:.6f} seconds".format(end - start))

# grab the number of rows and columns from the scores volume, then
# initialize our set of bounding box rectangles and corresponding
# confidence scores
(numRows, numCols) = scores.shape[2:4]
rects = []
confidences = []

# loop over the number of rows
for y in range(0, numRows):
    # extract the scores (probabilities), followed by the geometrical
    # data used to derive potential bounding box coordinates that
    # surround text
    scoresData = scores[0, 0, y]
    xData0 = geometry[0, 0, y]
    xData1 = geometry[0, 1, y]
    xData2 = geometry[0, 2, y]
    xData3 = geometry[0, 3, y]
    anglesData = geometry[0, 4, y]

    # loop over the number of columns
    for x in range(0, numCols):
        # if our score does not have sufficient probability, ignore it
        if scoresData[x] < min_confidence:
            continue

        # compute the offset factor as our resulting feature maps will
        # be 4x smaller than the input image
        (offsetX, offsetY) = (x * 4.0, y * 4.0)

        # extract the rotation angle for the prediction and then
        # compute the sin and cosine
        angle = anglesData[x]
        cos = np.cos(angle)
        sin = np.sin(angle)

        # use the geometry volume to derive the width and height of
        # the bounding box
        h = xData0[x] + xData2[x]
        w = xData1[x] + xData3[x]

        # compute both the starting and ending (x, y)-coordinates for
        # the text prediction bounding box
        endX = int(offsetX + (cos * xData1[x]) + (sin * xData2[x]))
        endY = int(offsetY - (sin * xData1[x]) + (cos * xData2[x]))
        startX = int(endX - w)
        startY = int(endY - h)

        # add the bounding box coordinates and probability score to
        # our respective lists
        rects.append((startX, startY, endX, endY))
        confidences.append(scoresData[x])

# apply non-maxima suppression to suppress weak, overlapping bounding
# boxes
boxes = non_max_suppression(np.array(rects), probs=confidences)

# loop over the bounding boxes
for (startX, startY, endX, endY) in boxes:
    # scale the bounding box coordinates based on the respective
    # ratios
    startX = int(startX * rW)
    startY = int(startY * rH)
    endX = int(endX * rW)
    endY = int(endY * rH)

    # draw the bounding box on the image
    cv2.rectangle(orig, (startX, startY), (endX, endY), (0, 0, 255), 2)

# show the output image
cv2.imshow("Text Detection", orig)
cv2.waitKey(0)
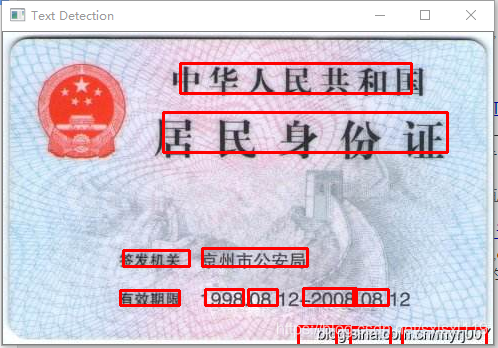
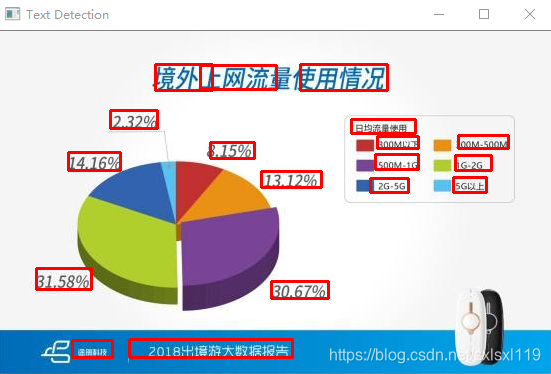
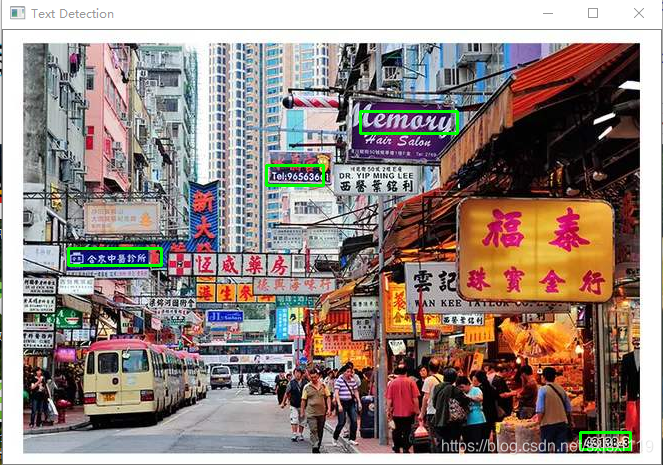
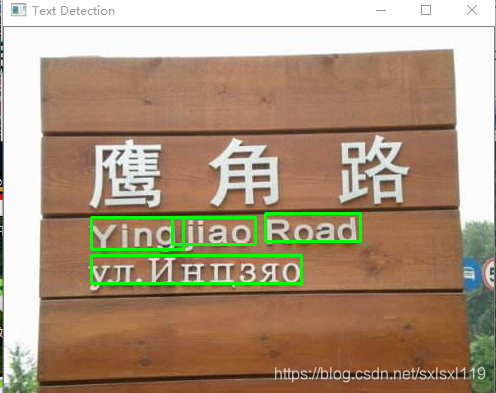
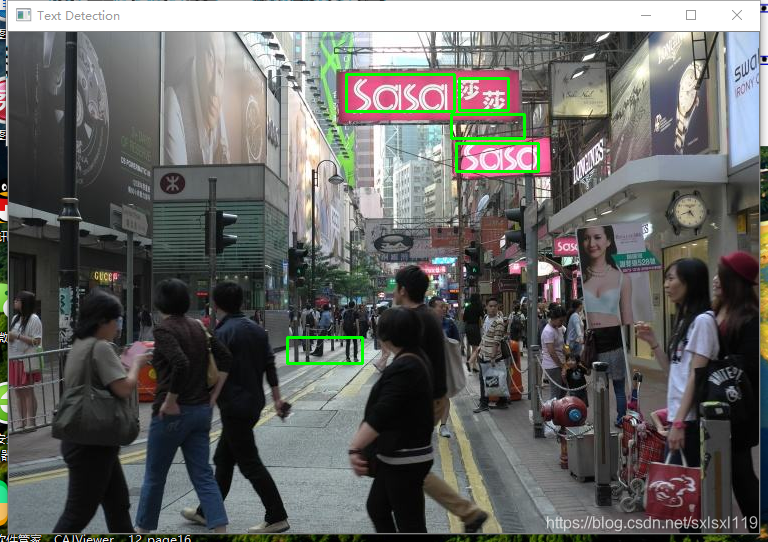
六、文本检测效果:
因为我使用的待检测图片,不是训练集里面的,所以检测准确率并不是太高,要是需要将EAST运用在自己的项目上的话可以创建自己的数据集,进行微调,这样正确率会高些。
本篇文章转载地址:https://my.oschina.net/u/876354/blog/3050127,自己加了代码部分和用了一些图片测试了一下,实际使用时再深入研究。


 被折叠的 条评论
为什么被折叠?
被折叠的 条评论
为什么被折叠?
 到【灌水乐园】发言


