


top source code
top source code download:
git clone https://gitlab.com/procps-ng/procps.gitcompile:
procps$ ./autogen.sh
procps$ ./configure
procps$ make
procps$ export LD_LIBRARY_PATH=/home/czl/Workspace/procps/library/.libs
the output executable file are debugable by default.

top open files
8 files are opened in longlife term of the whole top process running period.

but there are also many dnyamic opened files, especially spcified Process files "/proc/$PID/statm" and "/proc/$PID/stat":
strace -tt -T -f -e trace=file,close -o strace.log top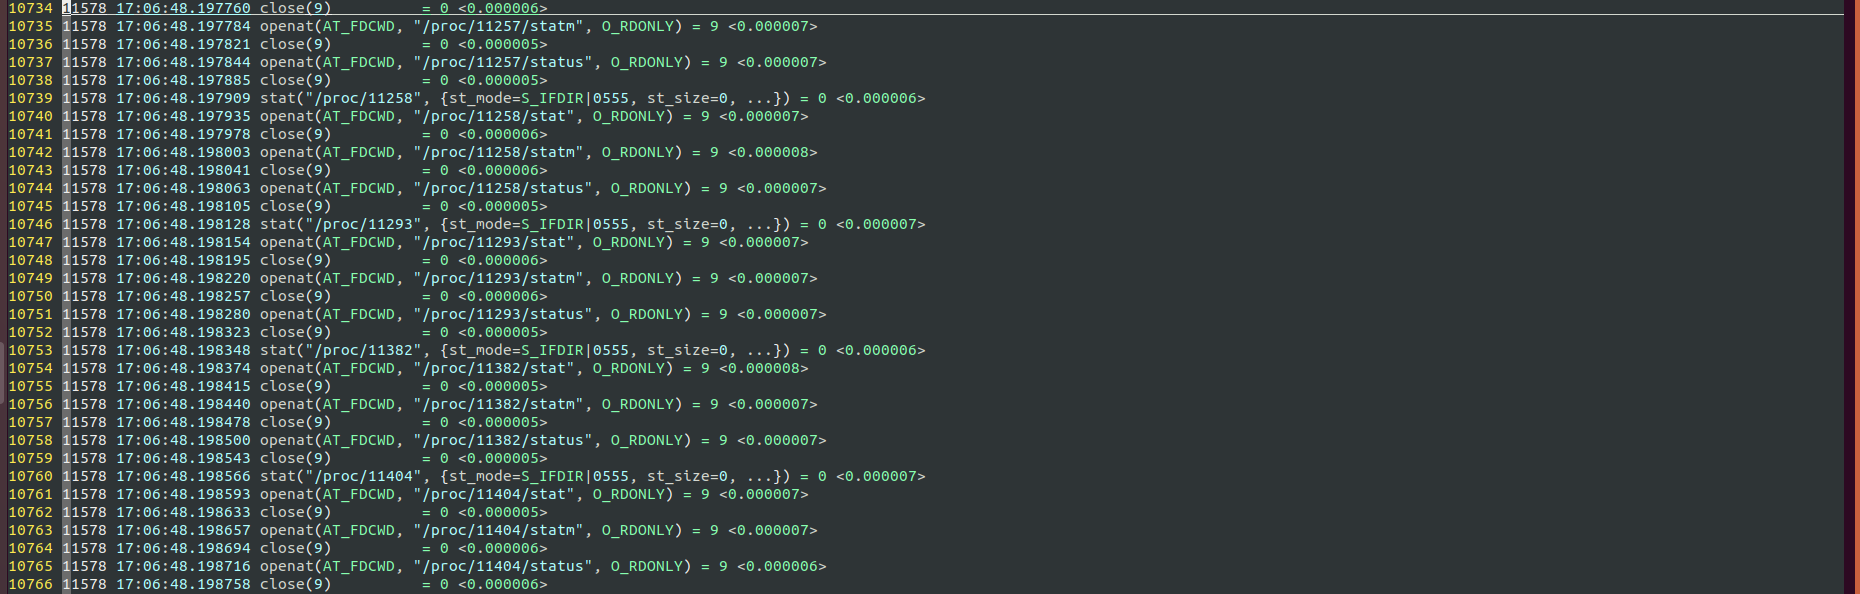
it seems the fd 8 used the dir "/proc" fd during the process iter allthe /proc/%PID DIRs.
conclusion:
so now we know during the top command running period, it depends on serveral kinds of files location in dir "/proc" to achieve the goal. they are list below:
/proc/uptime
/proc/meminfo
/proc/loadavg
/proc/stat
/proc/sys/kernel/osrelease
/sys/devices/system/cpu/online
/sys/devices/system/node/node0/meminfo
/proc/sys/kernel/pid_max
/proc/$PID/stat
/proc/$PID/statm
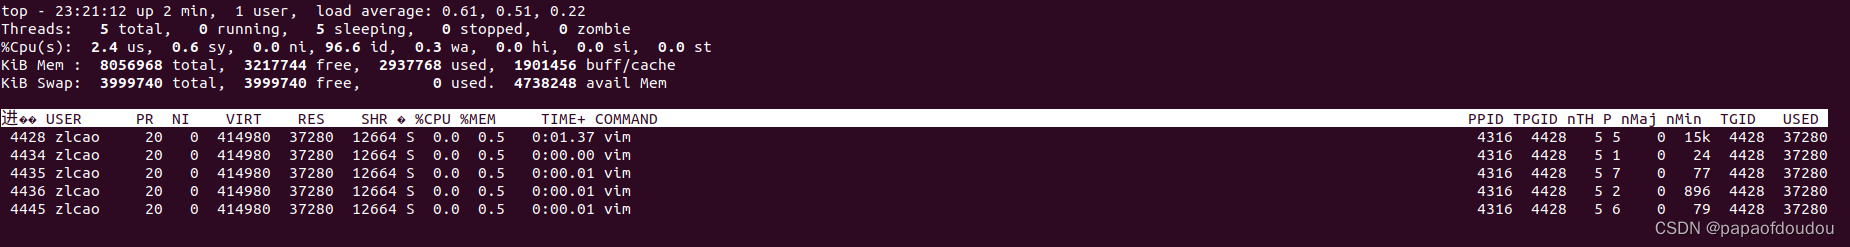
/proc/$PID/statustop -Hp #pid
显示指定进程内的线程的CPU负载以及其它参数分布情况。
top 界面顶格显示分成三个部分,分别是uptime and load averages, task and cpu states, 以及显示内存使用情况的MEMORY Usage.
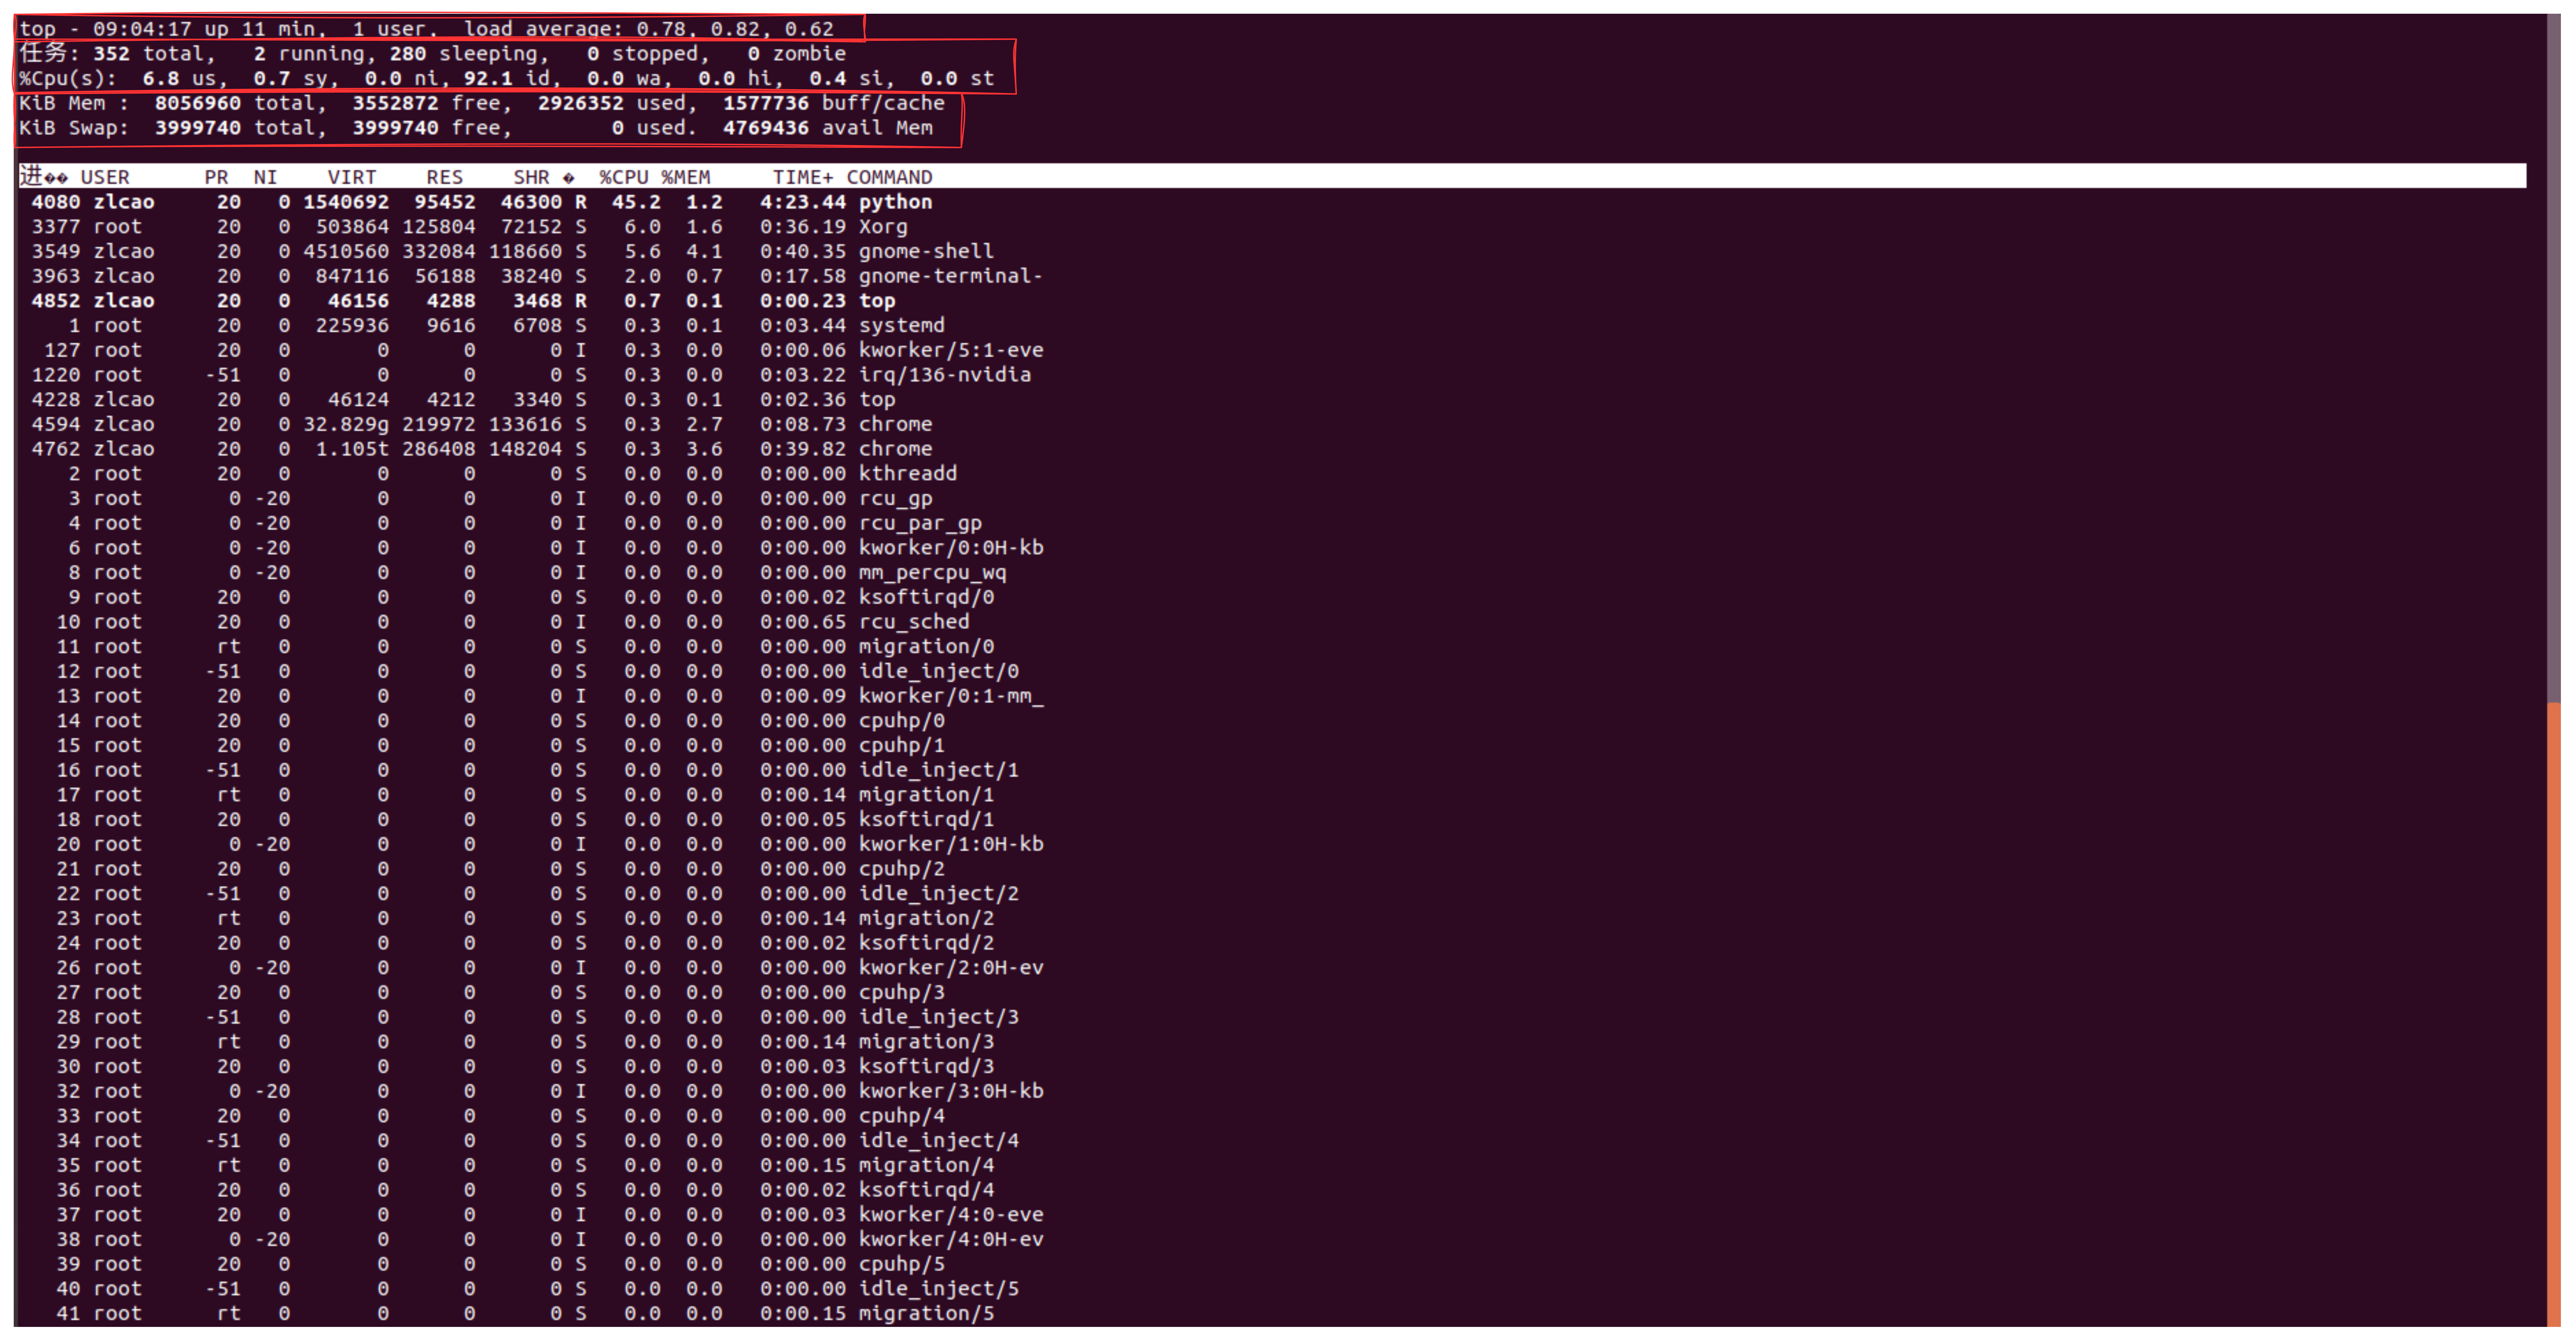

注意这里的CPU占用率是系统总体占用率,而不是某单个CPU上的占用率,对于多核系统,比如有N个核的系统,则总体容量有100N, 假如每个CPU上的占用率分别是M1/100, M2/100, Mn/100的话,则系统总体占用率为:
man top中对于进程内存类型的描述:

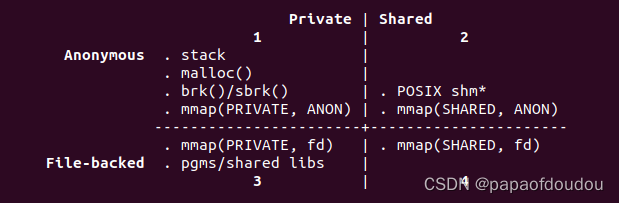
/proc/[pid]/statm
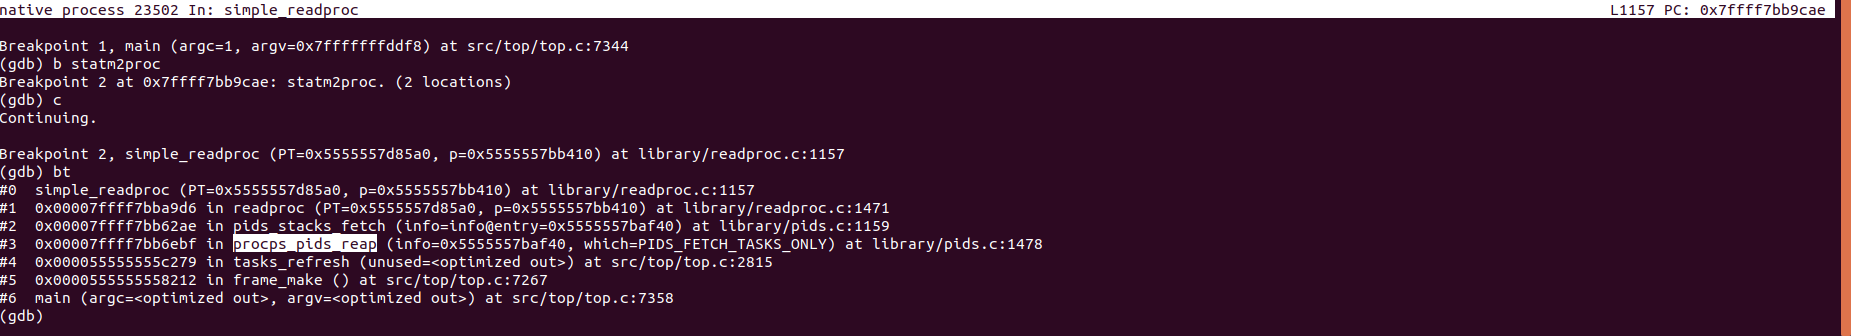


kernel process of the statm file node:
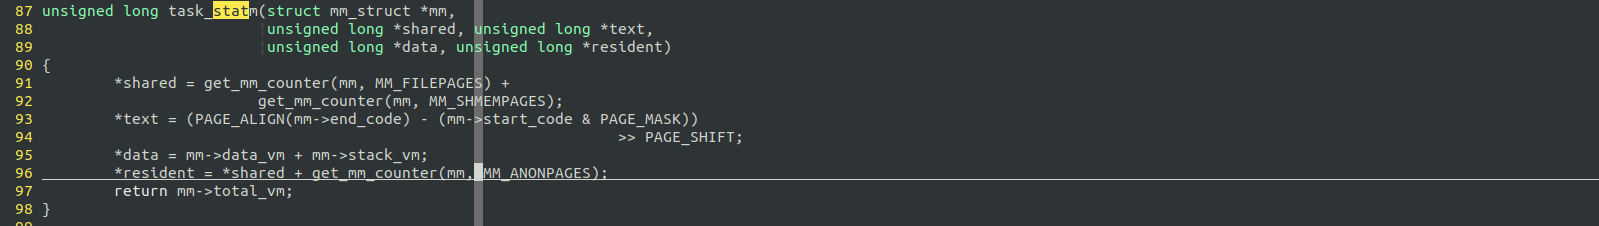
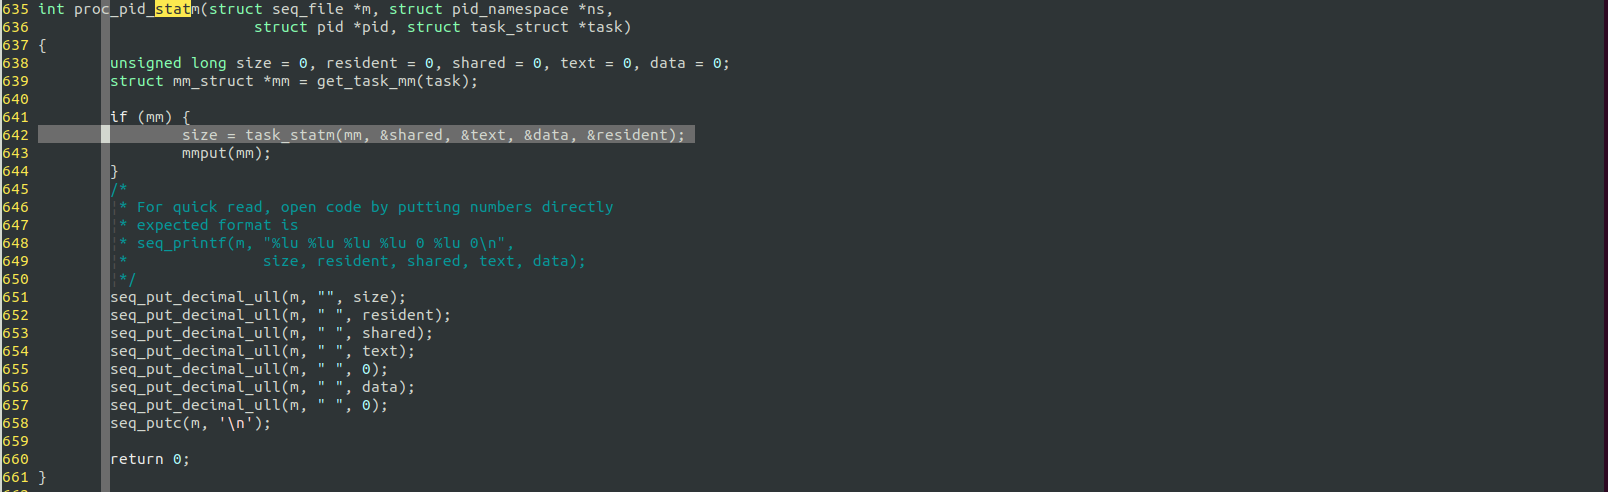
Take init process (pid is 1) for example, according the kernel "statm" proc_pid_statm process sequence, they are:
[total vm size, resident size,shared, code text size, 0, code data size, 0].

be carfull, the unit of the "/proc/PID/statm" output is page, so you should times 4K to covert to Bytes.
so we can compare this data with the "pmap" view of the specify process:
sudo pmap 1


take code size and total vm size for example:
pmap code:1344K = 336*4K=1344K.
total vm size:225924K ≈ 56480*4K=225920K
so, you can find the specify indicator comes from two sources are exactly match.
/proc/stat
kernel process of key functions in this file node.
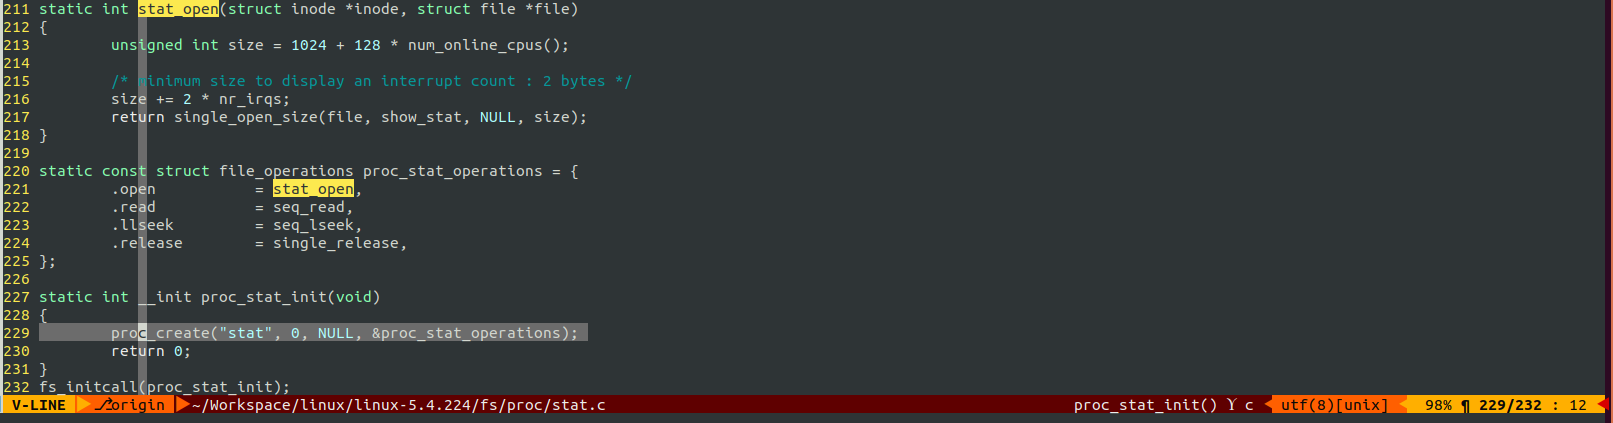
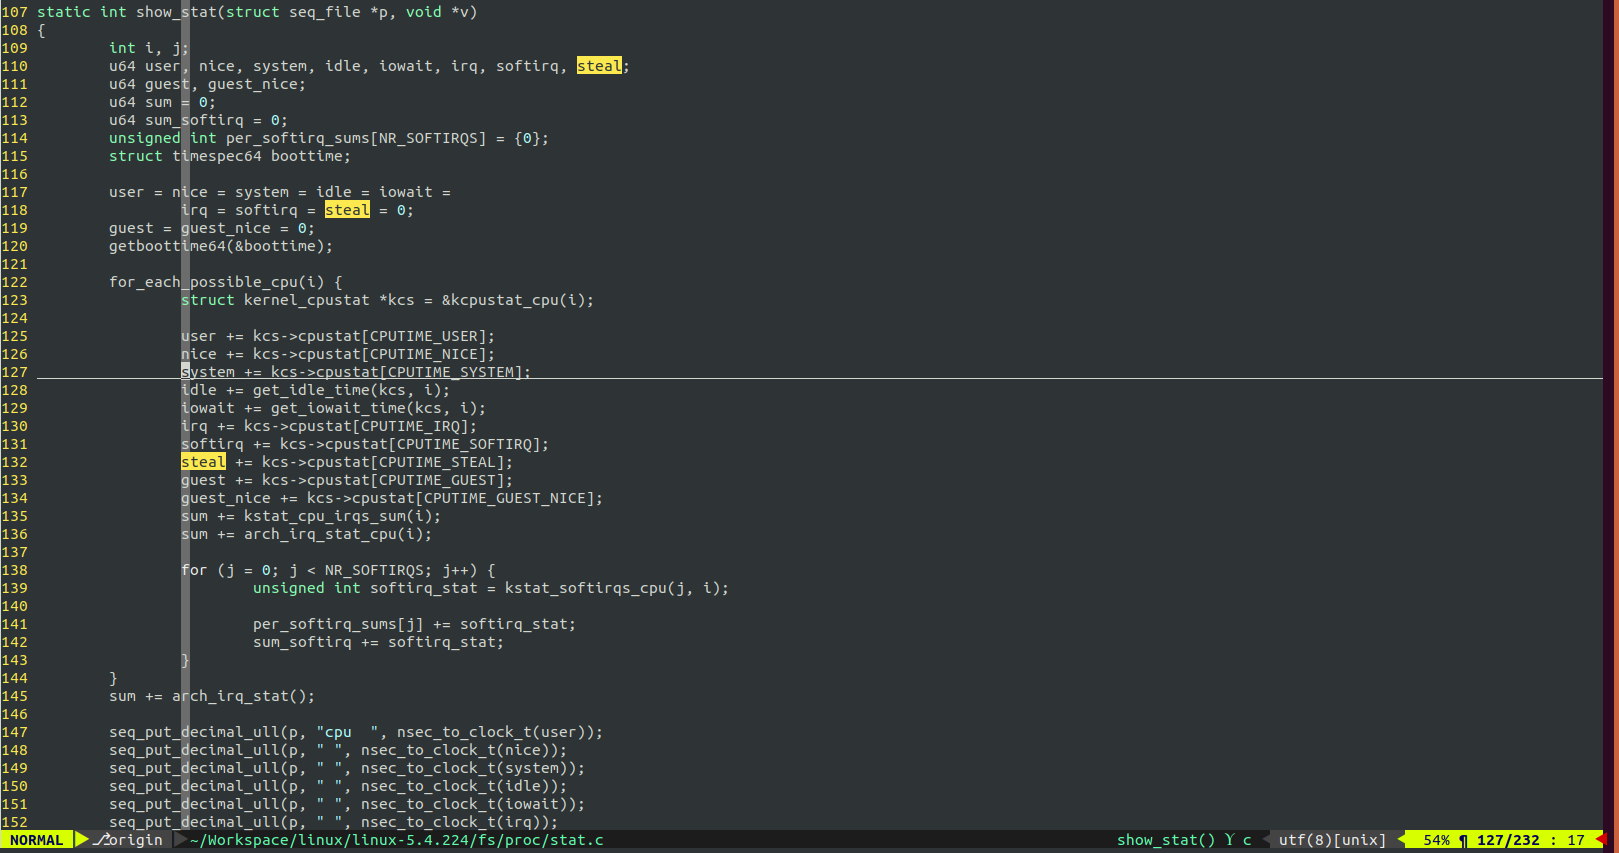
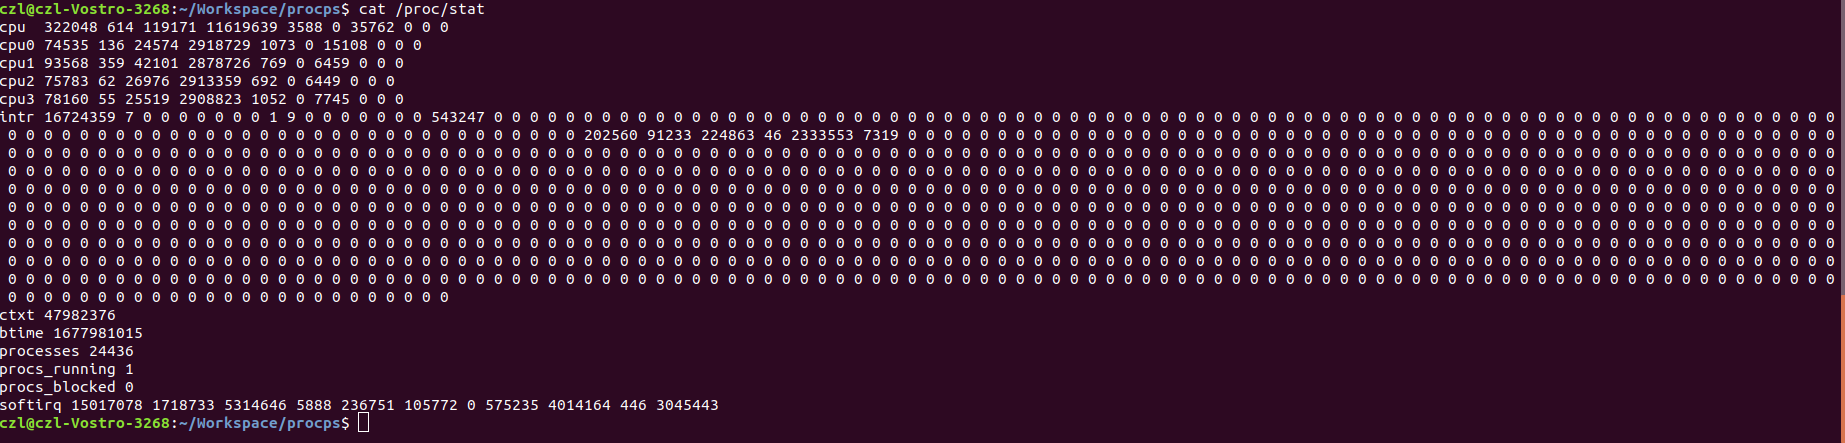
according the kernel process logic, we can conclude that the cpu display sequence is:
[user, nice, system, idle, iowait, irq, softirq, steal, guest, guest_nice]
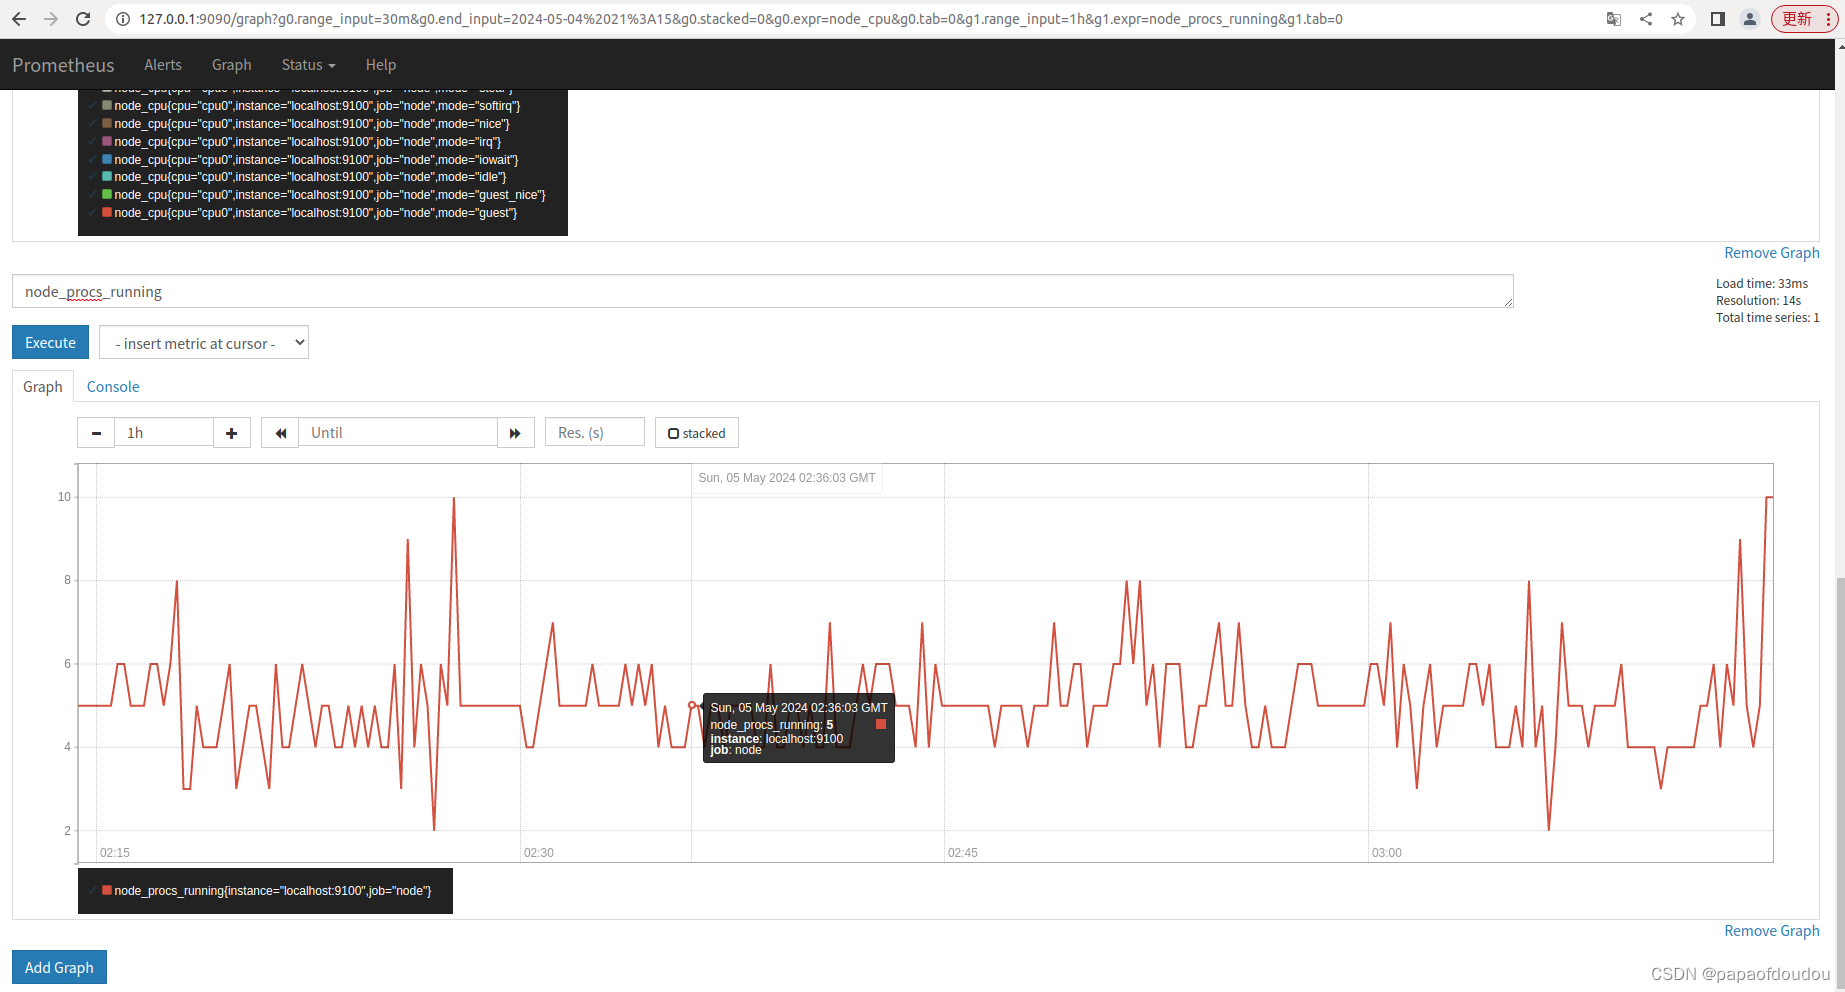
获取CPU上总的可调度线程数

stress -c 32建立32个压测进程后,这个数字立即变了:

stress-ng
比stress更为强大的工具是stress-ng,如下命令使用4个进程,进行矩阵乘法计算进行压力测试,持续时间为600秒。
stress-ng --cpu 4 --cpu-method matrixprod --timeout 600s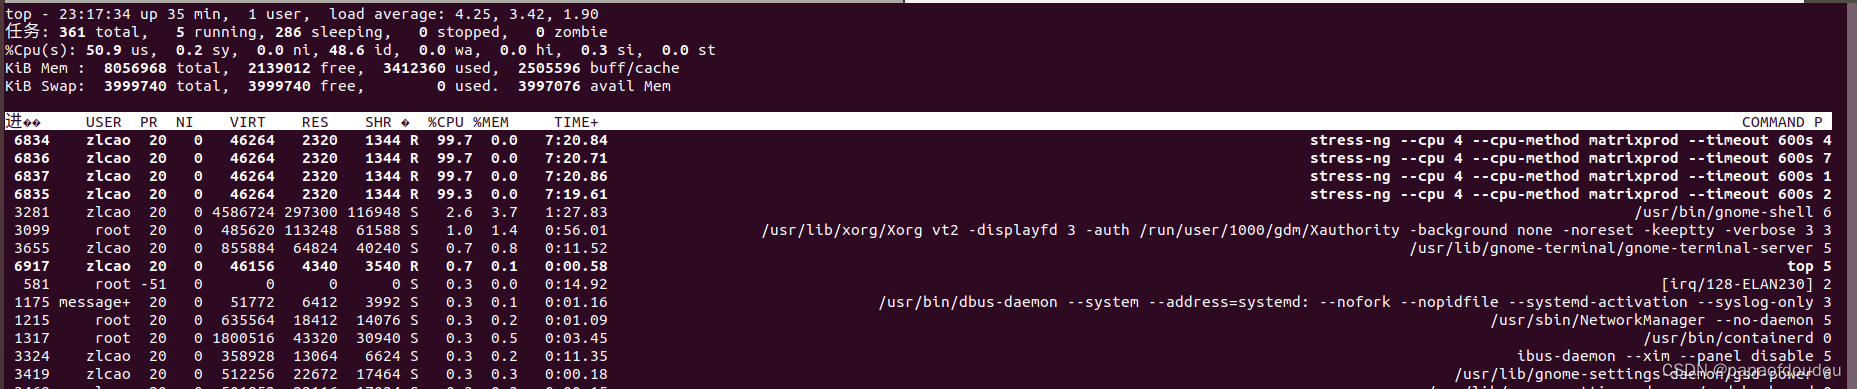
内存负载测试,如下命令使用4个内存分配进程, 每次分配大小512M,分配后不释放,保持测试600秒:
stress-ng --vm 4 --vm-bytes 512M --timeout 600s

Linux下的stress-ng压测工具太强悍了!-电子头条-EEWORLD电子工程世界
--cpu 0,表示所有核上启动测试进程:
stress-ng --cpu 0 --cpu-method all --verify --syslog -v --timeout 2h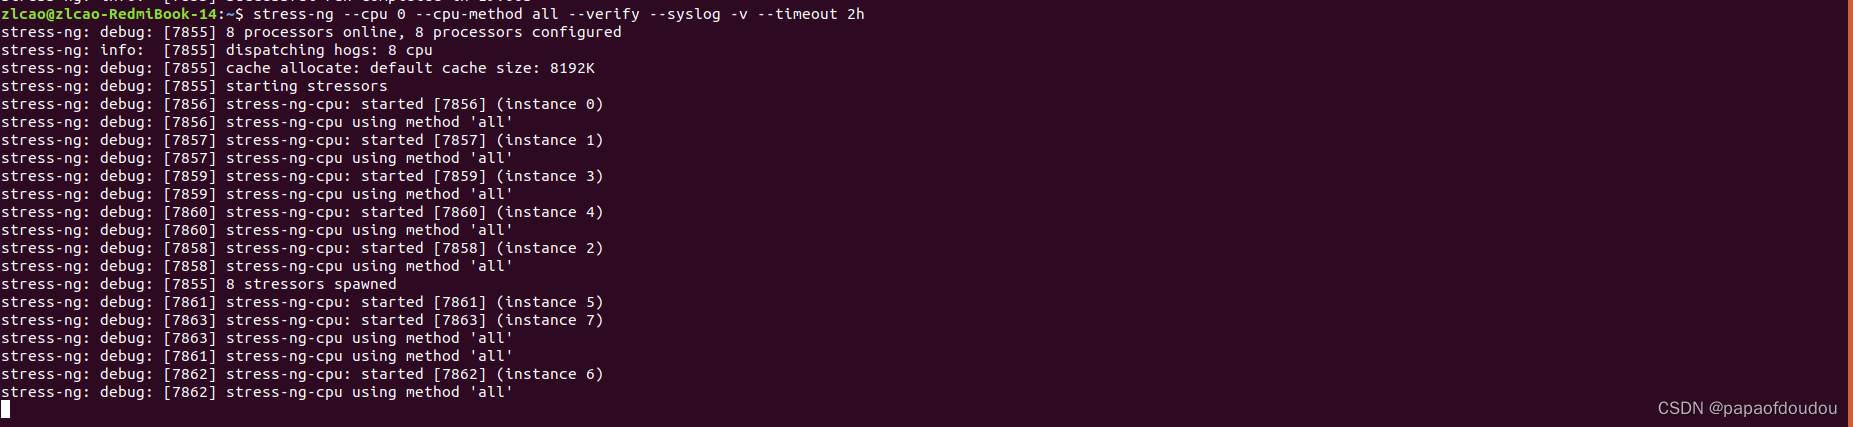
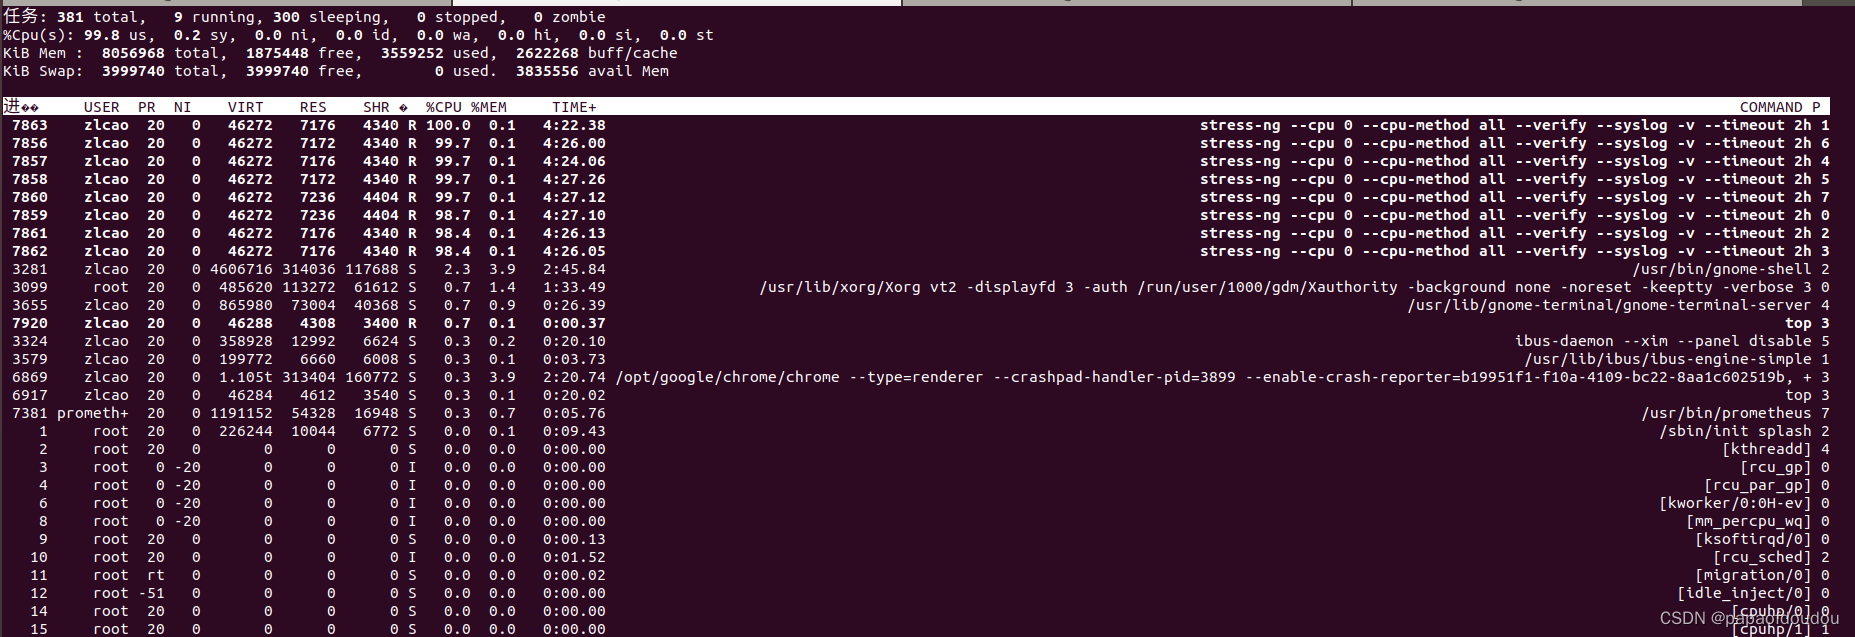
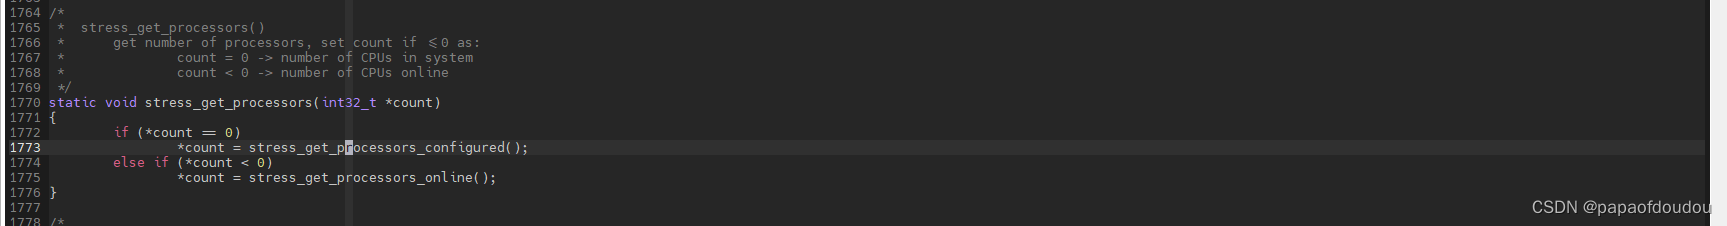
当--cpu/-c参数为0或者负值,进程数会设置为系统全部的核数或者在线核数。
Strace 编译&静态编译
$ git clone https://github.com/strace/strace.git // or
$ git clone https://gitee.com/mirrorz/strace.git
$ sudo apt-get install autoconf automake libtool
$ ./bootstrap
$ ./configure --enable-mpers=no LDFLAGS='-static -pthread' --prefix=/home/zlcao/workspace/st/install
$ make && make install
静态strace程序:

strace统计已运行进程的系统调用统计信息:
# strace -c -p 4352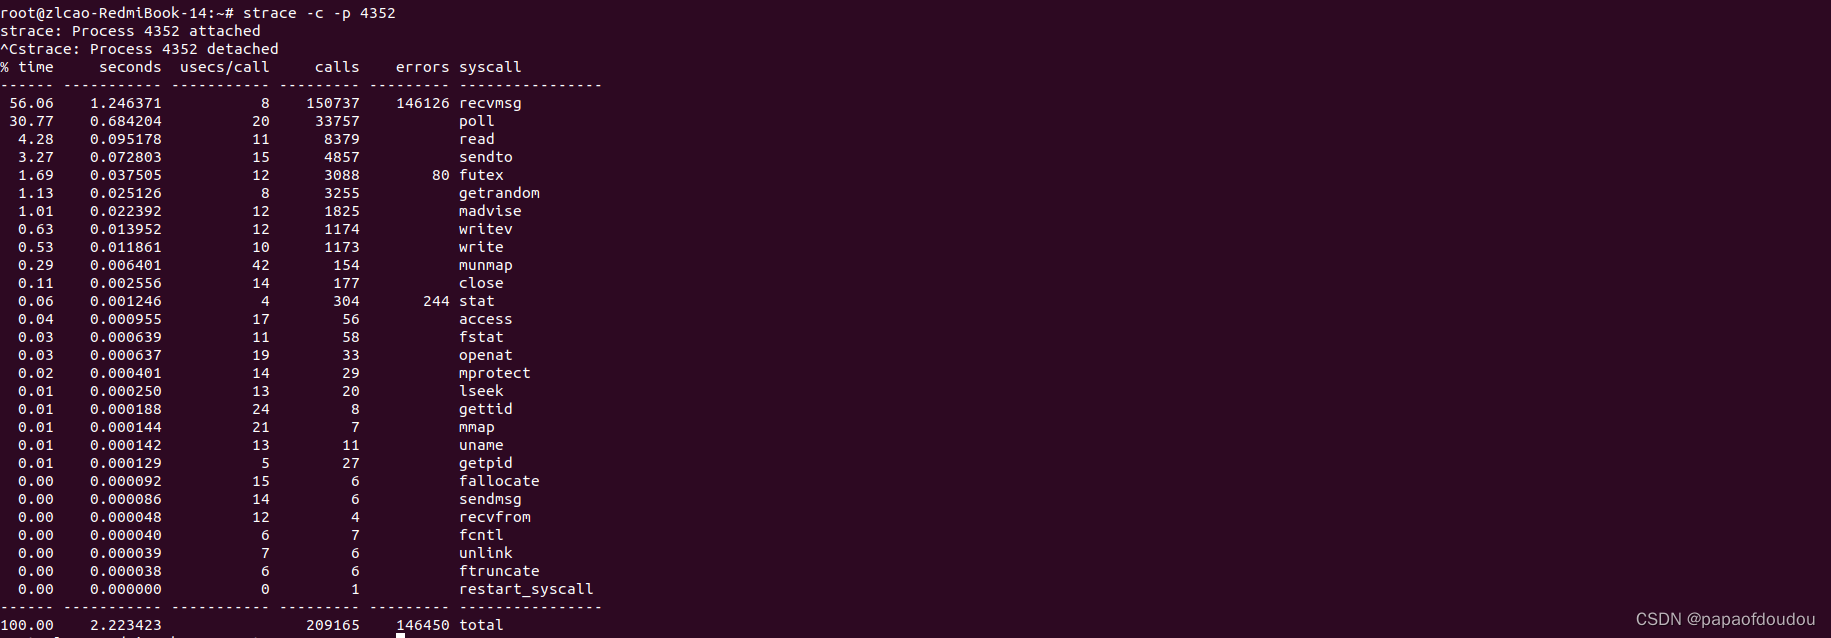
只查看进程返回错误的系统调用信息:
strace -d -p 4352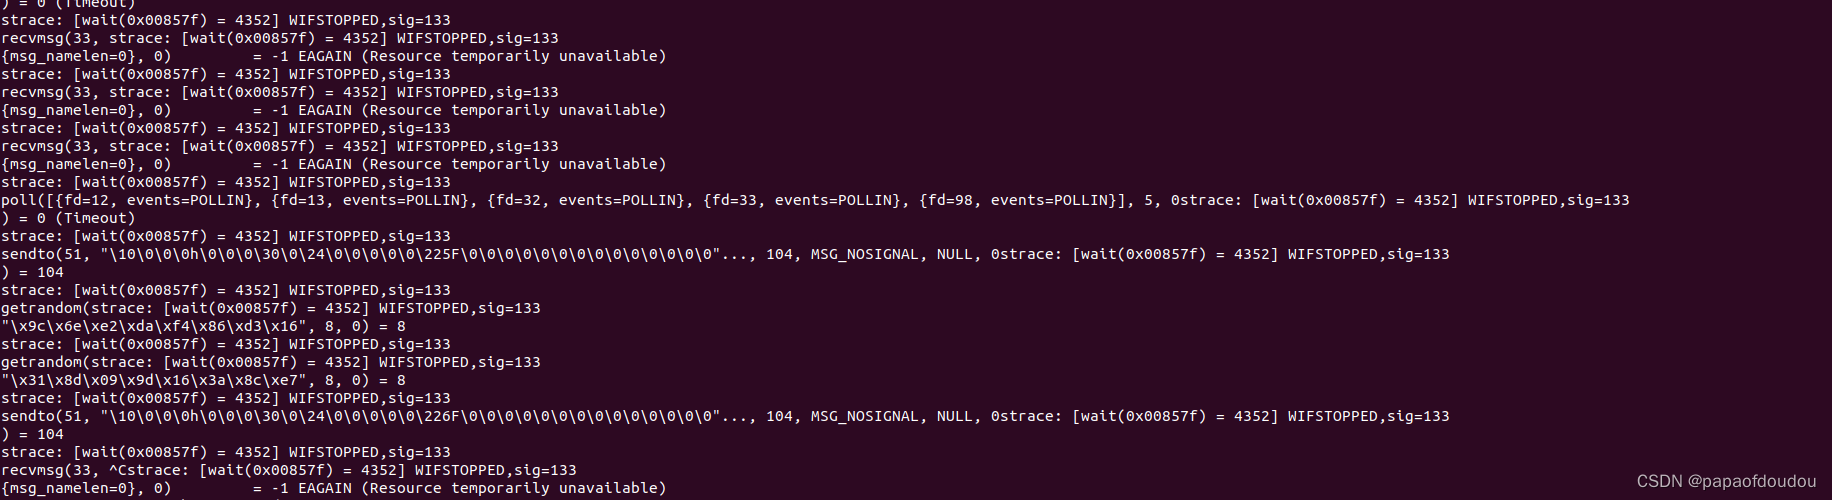
# strace -ff -p 4352 -o zilong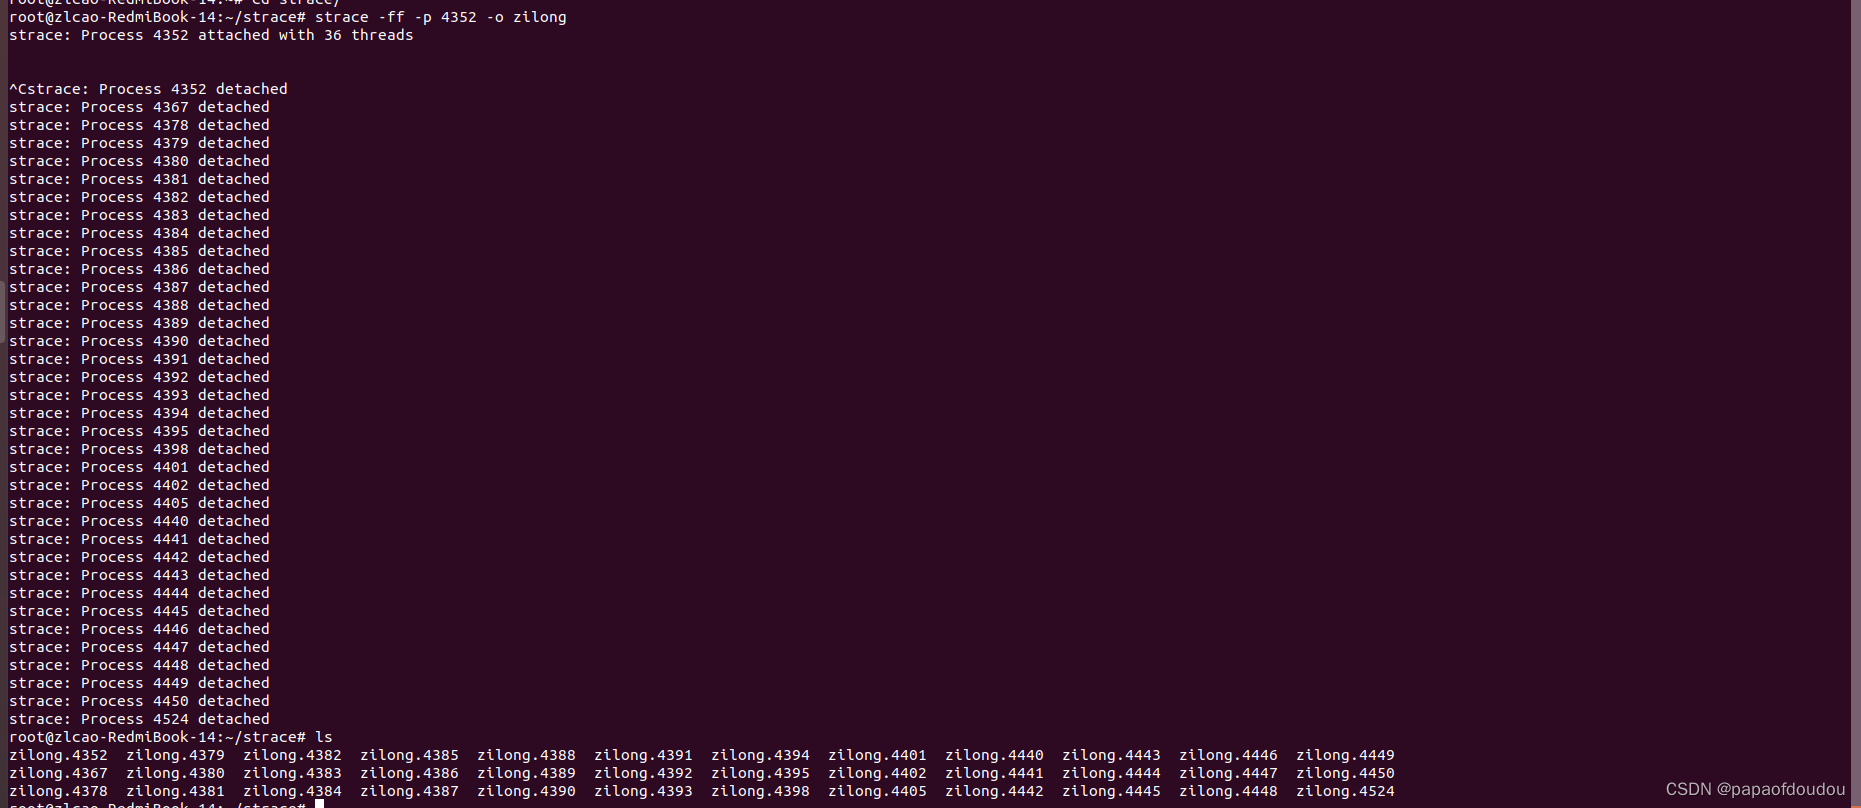
-a column 设置返回值的输出位置.默认 为40.
# strace -d -p 4352 -a 100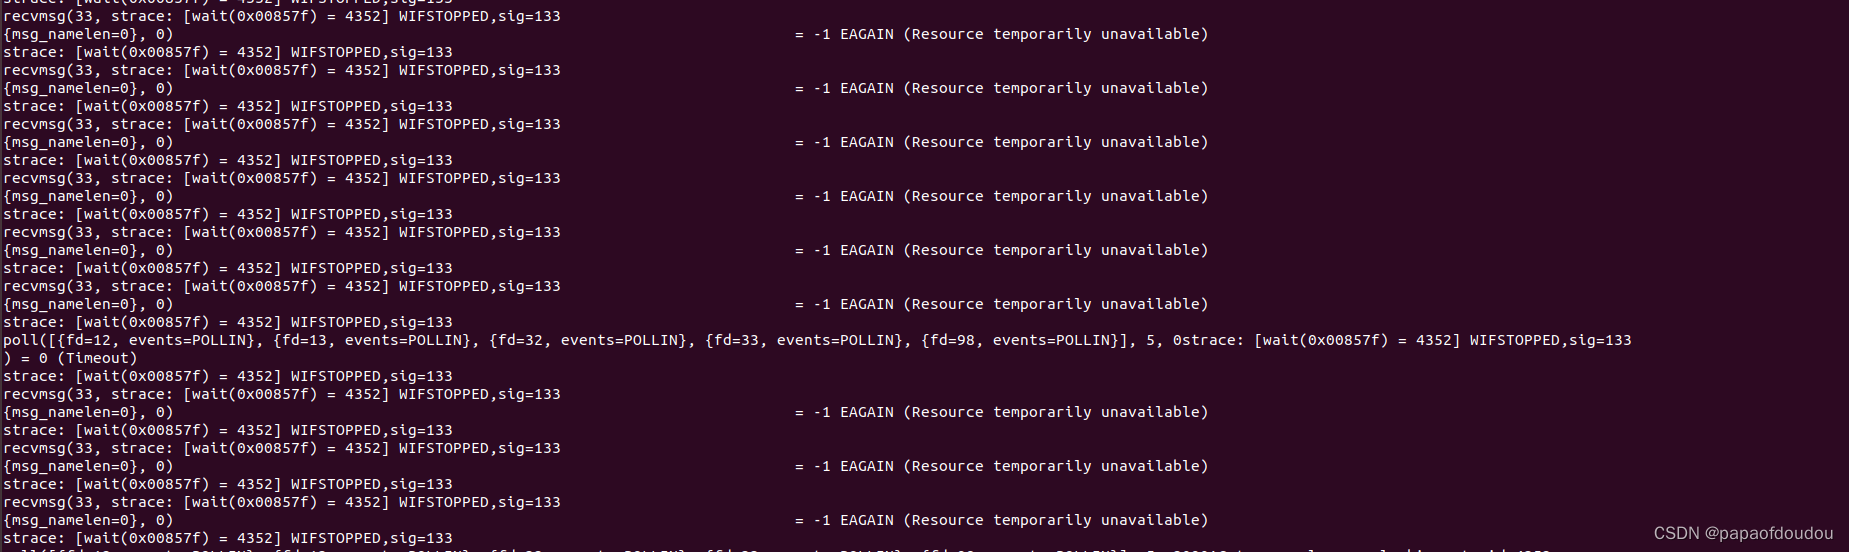
跟踪多进程,-p 指定要跟踪的进程pid, 要同时跟踪多个pid, 重复多次-p选项即可。
# strace -d -p 4352 -p 3473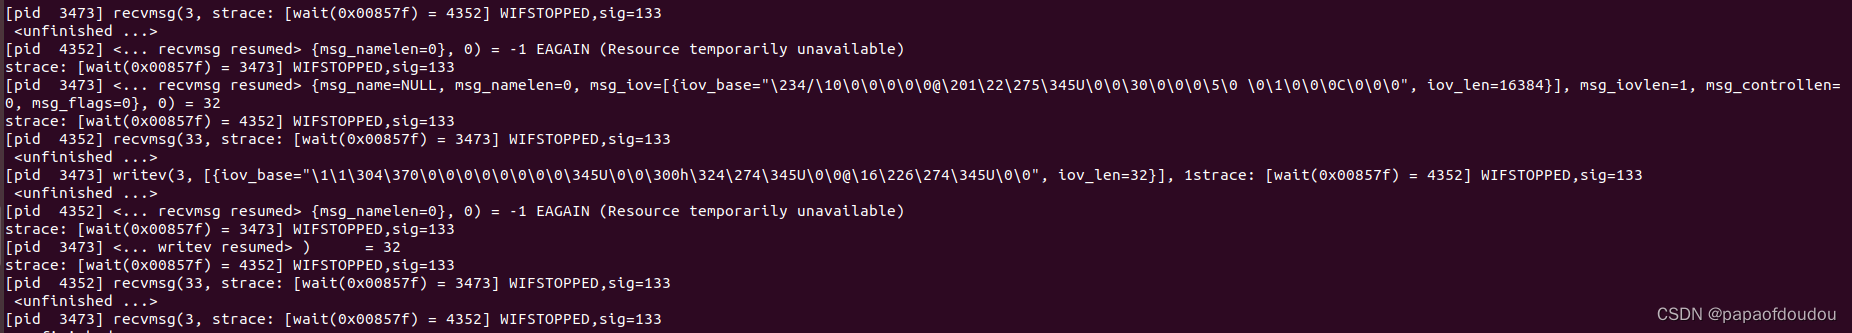
sysstat编译使用
$ git clone https://gitee.com/devops-xu/sysstat.git
$ git reset --hard v12.6.0
$ ./configure --prefix=/home/zlcao/workspace/systools/install LDFLAGS='-static'


编译出来的静态连接的程序:
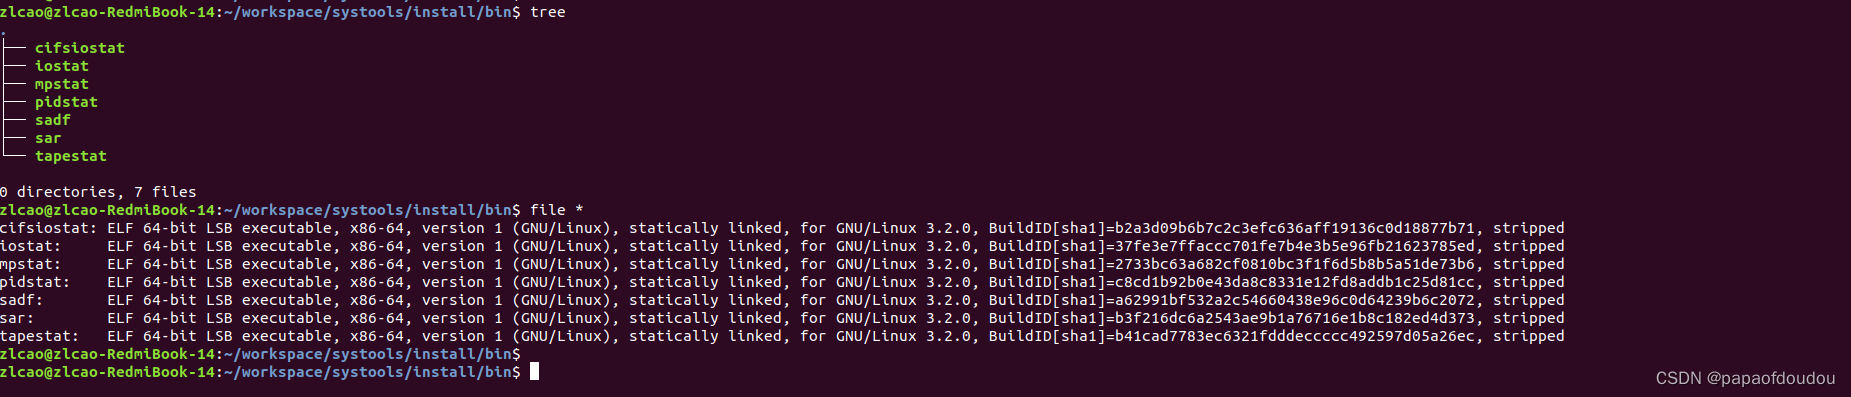
pidstat
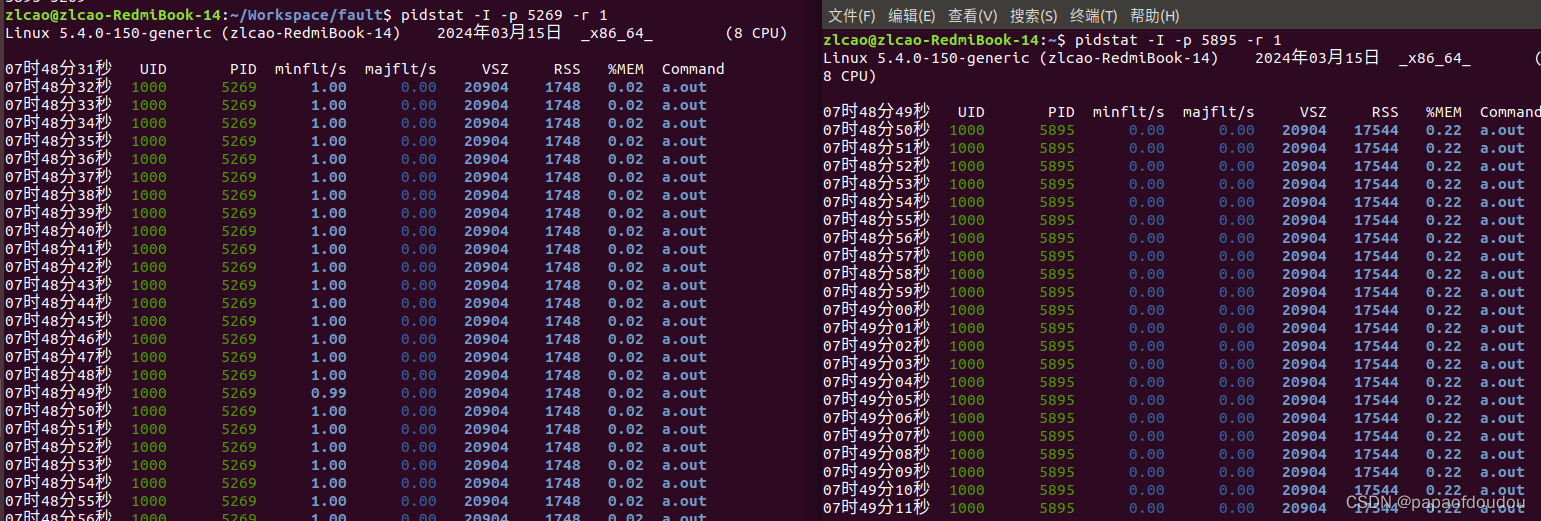
pidstat有一个很实用的功能,就是查看进程PAGE FAULT的发生频率,minflt/s表示普通的page fault,majflt/s表示要swap-in的page fault。
$ pidstat -I -p `pidof a.out` -r 1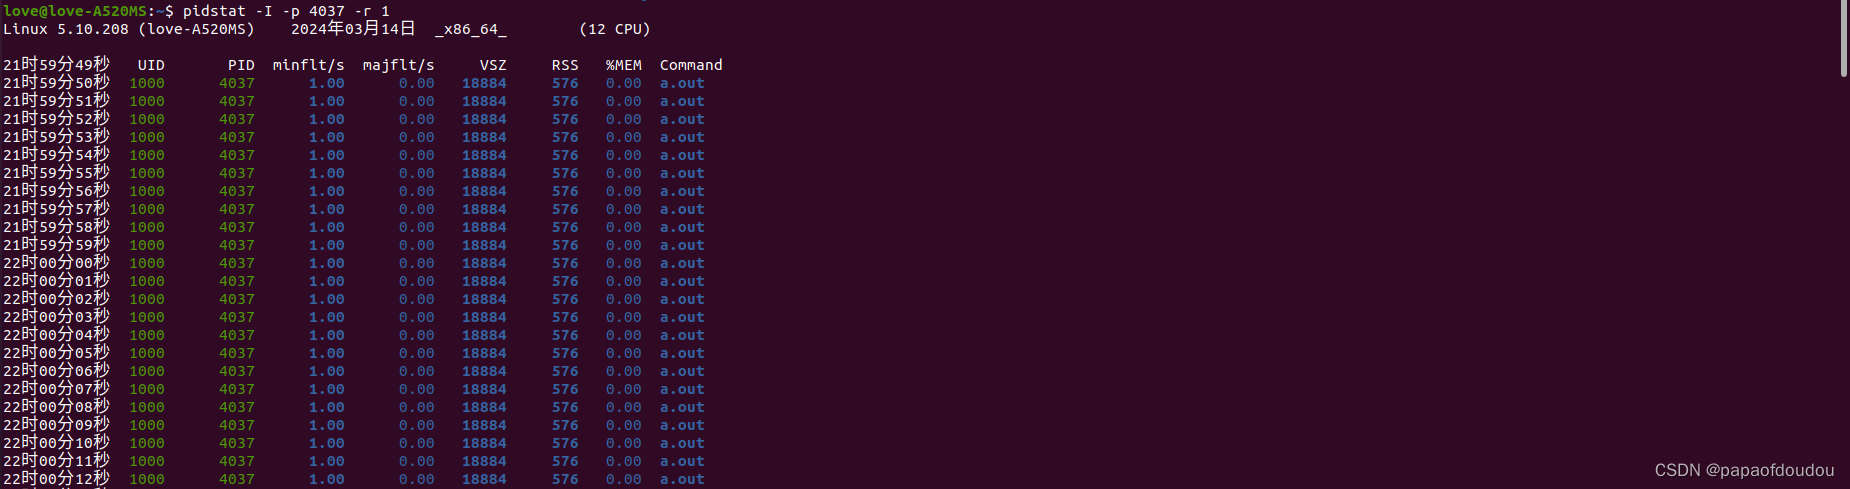
#include <stdio.h>
#include <unistd.h>
#include <stdlib.h>
#include <string.h>
#define PAGE_SIZE 0x1000
int main(void)
{
	int i;
	void *p = malloc(0x1000000);
	for(i = 0; i < 0x1000000 / PAGE_SIZE; i ++) {
		memset(p + i * PAGE_SIZE, 0x5a, PAGE_SIZE);
		sleep(1);
	}

	return 0;
}
如果在分配内存后,马上对内存区域进行mlock/munlock操作,则将不会发生PAGE FAULT, 因为MLOCK操作会事先将页面POPULATE到页表内,建立好页表后才执行,所以不会发生PAGE FAULT。
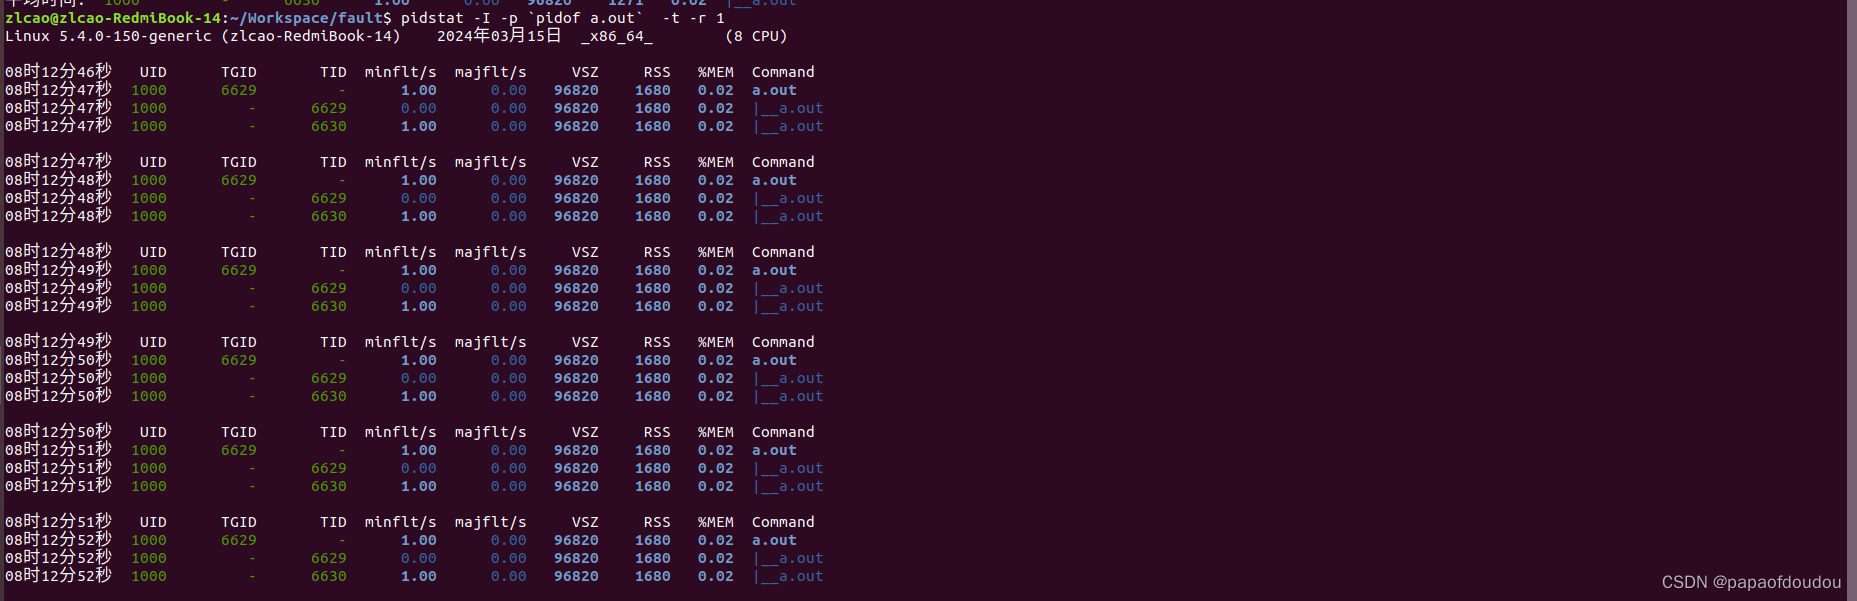
如果目标进程是多线程程序,需要定位到具体发生PAGE FAULT的线程,可以加入-t参数:
pidstat -I -p `pidof a.out` -t -r 1#include <stdio.h>
#include <stdlib.h>
#include <string.h>
#include <unistd.h>
#include <sys/mman.h>
#include <pthread.h>
#define BUF_SIZE 0x1000000
#define PAGE_SIZE 0x1000
void* lock_sync_thread(void *arg)
{
int i;
void *ptr;
ptr = malloc(BUF_SIZE);
//mlock(ptr, BUF_SIZE);
for(i = 0; i < BUF_SIZE/PAGE_SIZE; i ++) {
memset(ptr + i * PAGE_SIZE, 0x5a, PAGE_SIZE);
sleep(1);
}
//munlock(ptr, BUF_SIZE);
return NULL;
}
int main(void)
{
pthread_t t1;
pthread_create(&t1, NULL, lock_sync_thread, NULL);
pthread_join(t1, NULL);
}
Chrome浏览器是一个多进程多线程程序,随即选择一个进程,查看其各线程发生的PAGE FAULT的情况,可以看到,主线程发生了最多的PAGE FAULT,其它线程则根据业务情况,发生了数目不等的PAGE FAULT,有个别线程没有发生PAGE FAULT,和每个线程具体的业务有关。
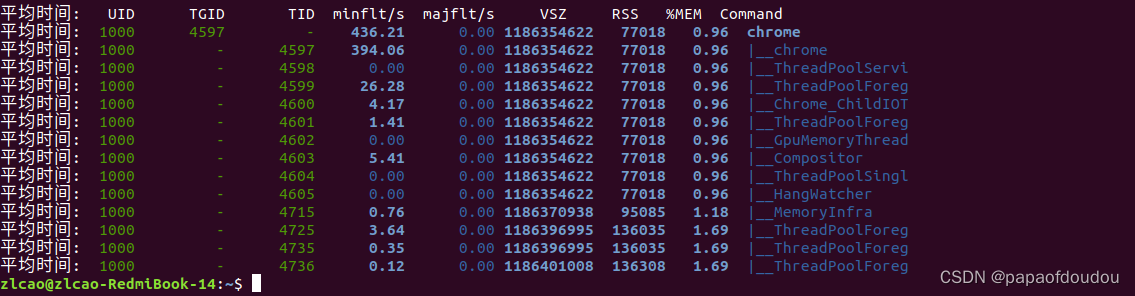
基本上和perf看到的PAGE FAULT频率和周期能匹配的上:
$ sudo perf stat -e page-faults,context-switches -p `pidof a.out`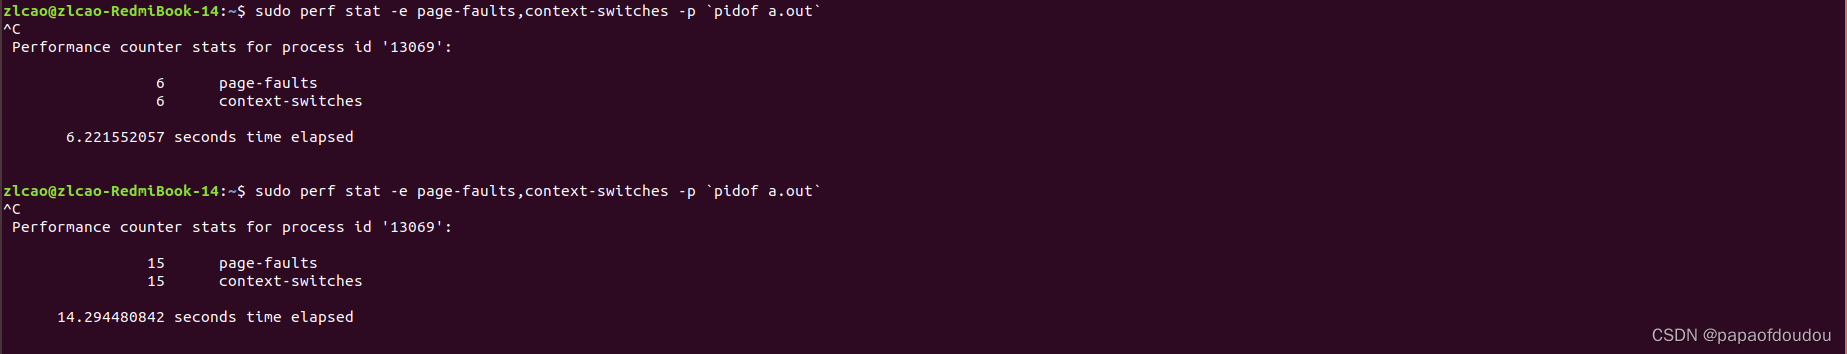
fuser/pstree
$ git clone https://gitlab.com/psmisc/psmisc.git
$ autogen.sh && ./configure && make && make install
free命令
free命令来自于procps.git项目。
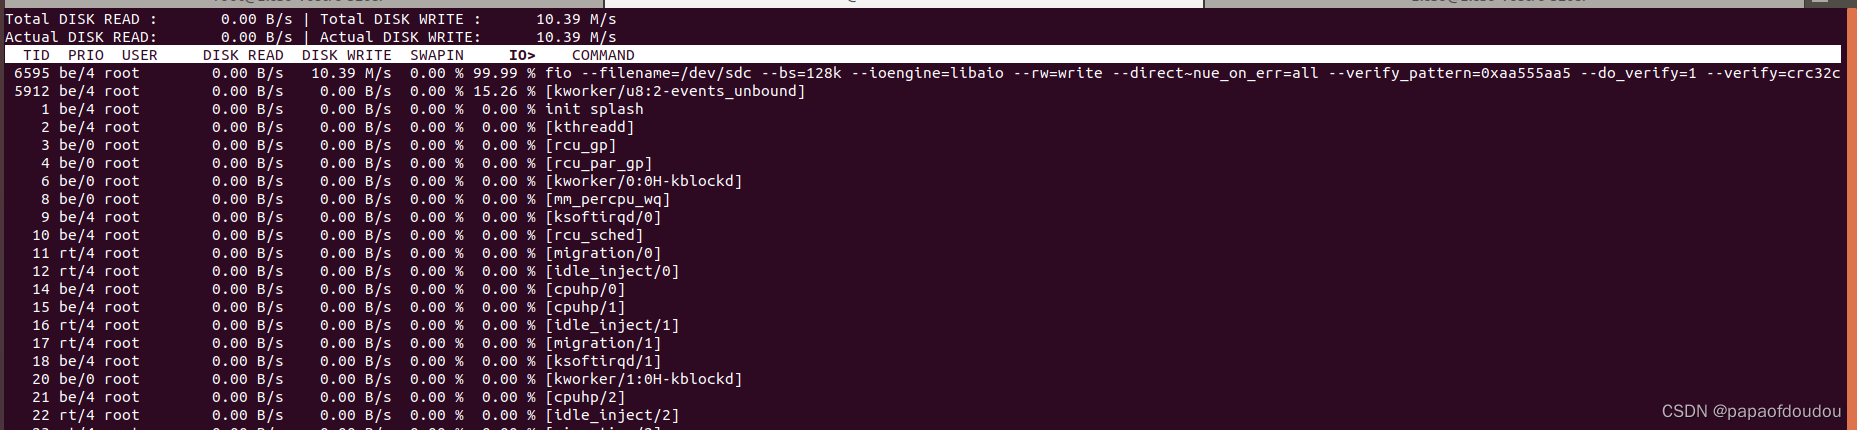
磁盘压测程序fio
fio --filename=/dev/sdc --bs=128k --ioengine=libaio --rw=write --direct=1 --group_reporting --name=SSD_DATA_PATTERN --numjobs=1 --iodepth=32 --size=16GB --thread --continue_on_err=all --verify_pattern=0xaa555aa5 --do_verify=1 --verify=crc32c
iotop显示,磁盘压测进程IO吞吐量排名第一:
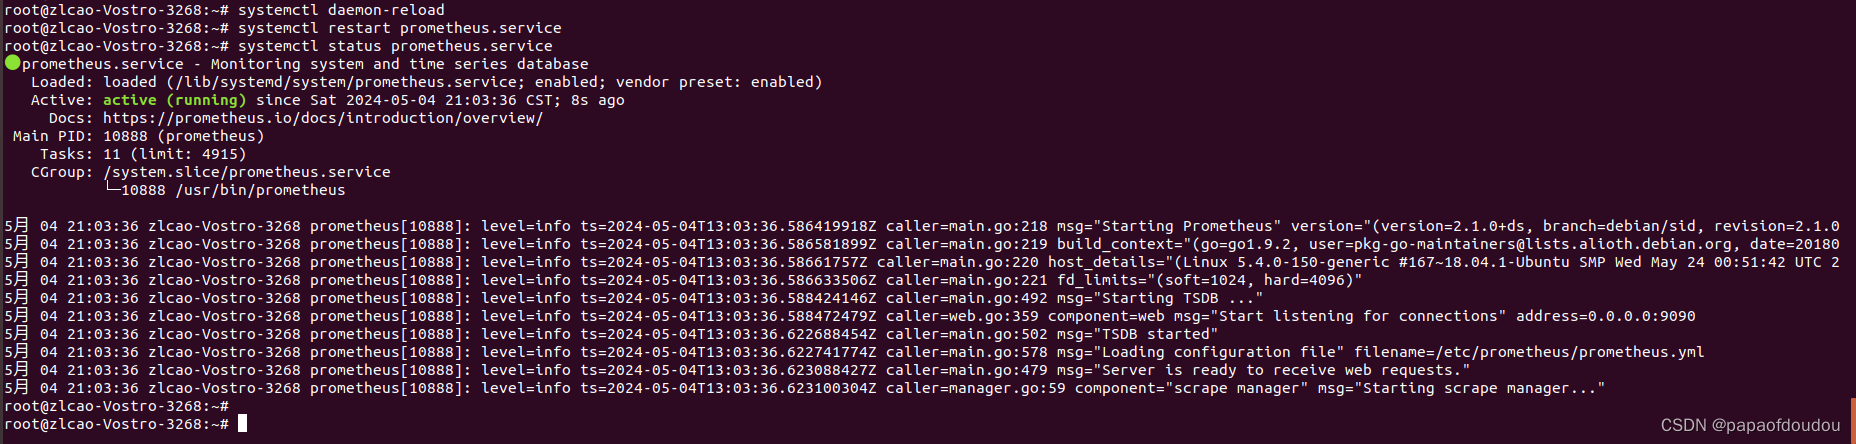
prometheus
# apt install prometheus
# systemctl daemon-reload
# systemctl restart prometheus.service
# systemctl status prometheus.service
Reference doc:
Linux Perf性能分析常用手段(火焰图,gprof,kernelshark,bts)_papaofdoudou的博客-CSDN博客
60 秒 Linux 检查清单,快速初步定位你的性能问题~ - 哔哩哔哩
编程获取Linux的内存占用和CPU使用率_linux实时监控内存和cpu占用的脚本_papaofdoudou的博客-CSDN博客


 6221
6221


 被折叠的 条评论
为什么被折叠?
被折叠的 条评论
为什么被折叠?
 到【灌水乐园】发言


