


一、任务描述
这回要做这么件事儿:
- 自动化修改文件名
- 自动化修改配置文件
- 自动化生成cluster_files并拼接
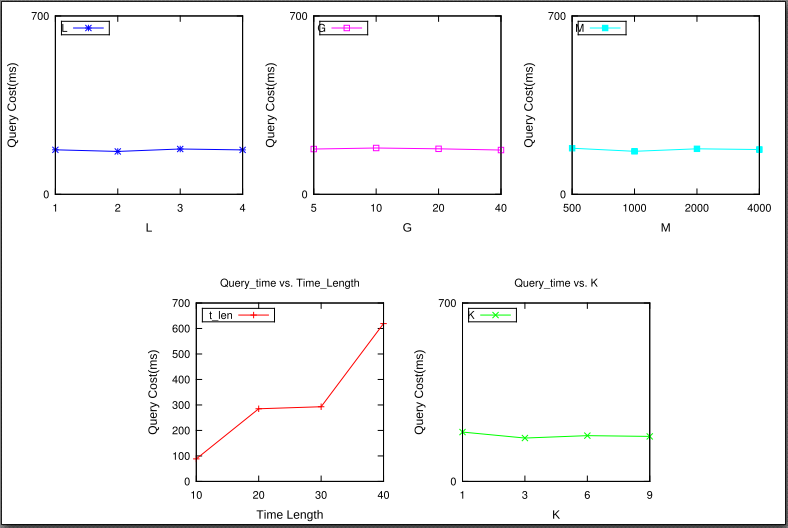
- 自动化生成query_time.dat
- 自动化画图
下面对每一步分别说明。
二、任务实现
1、自动化修改文件名
要修改生成不同时段的cluster_file的文件夹名称,如下图所示,时段区间都在文件夹名称上表示着
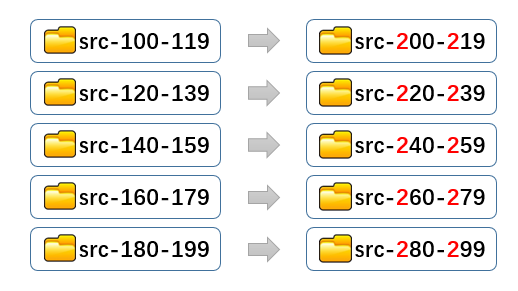
于是,编写脚本如下:
#!/bin/bash

old_sta=100
old_first_end=119
new_sta=200
new_first_end=219

for k in $(seq 0 4)
    do
        let cur_old_sta=${old_sta}+k*20
        let cur_old_end=${old_first_end}+k*20
        let cur_new_sta=${new_sta}+k*20
        let cur_new_end=${new_first_end}+k*20

        old_folder="src-${cur_old_sta}-${cur_old_end}"
        new_folder="src-${cur_new_sta}-${cur_new_end}"

        cd "/home/xuying/java_codes/localHBUpdating/"

        mv ${old_folder} ${new_folder}
    done

echo "Step 1 -- Modify Folders' names -- finished SUCESSFULLY!"
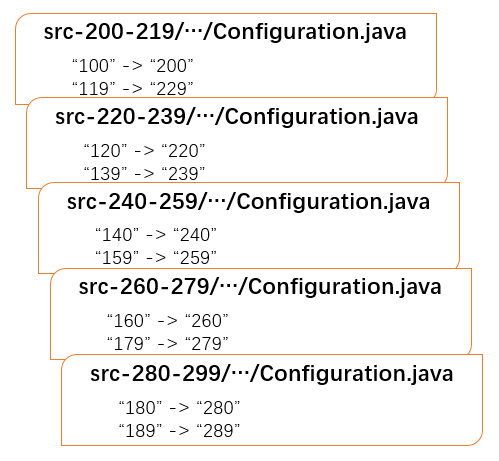
脚本如下:
#!/bin/bash

old_sta=100
old_first_end=119
new_sta=200
new_first_end=219

for k in $(seq 0 4)
    do
        let cur_old_sta=${old_sta}+k*20
        let cur_old_end=${old_first_end}+k*20
        let cur_sta=${new_sta}+k*20
        let cur_end=${new_first_end}+k*20

        src_folder="src-${cur_sta}-${cur_end}"
        file_loc="/home/xuying/java_codes/localHBUpdating/${src_folder}/utility"
        echo ${file_loc}
        cd ${file_loc}

        sed -i "s/${cur_old_sta}/${cur_sta}/g" Configuration.java
        sed -i "s/${cur_old_end}/${cur_end}/g" Configuration.java

    done

echo "Step 2 -- Modify Config in CltFileGen -- finished SUCESSFULLY!"
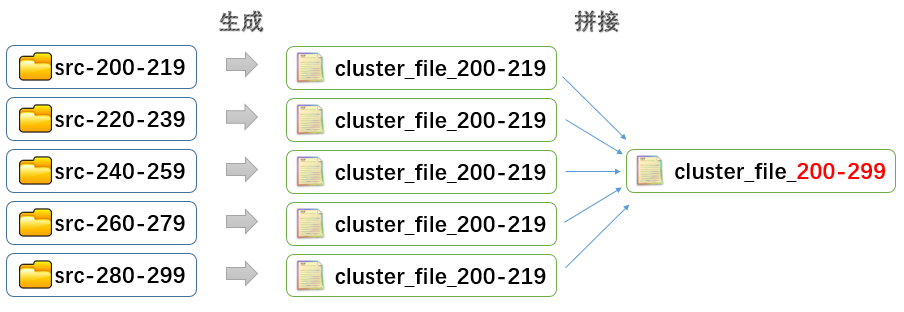
脚本如下:
#!/bin/bash

new_sta=200
new_firt_end=219

let joint_sta=${new_sta}
let joint_end=${new_first_end}+80

joint_file_name="cluster_file_${joint_sta}-${joint_end}.txt"
echo ${joint_file_name}

for k in $(seq 1 4)
    do
        let lastk=k-1
        let sta_1=${new_sta}+${lastk}*20
        let end_1=${new_firt_end}+${lastk}*20
        let sta_2=${new_sta}+k*20
        let end_2=${new_firt_end}+k*20

        file_name_1="cluster_file_${sta_1}-${end_1}.txt"
        file_name_2="cluster_file_${sta_2}-${end_2}.txt"
        last_joint_name="${lastk}.txt"
        tmp_joint_name="${k}.txt"

        file_loc="/home/xuying/java_codes/localHBUpdating"
        cd ${file_loc}

        if [[ ${k} == "1" ]] ;
        then
            cat ${file_name_1} ${file_name_2} > ${tmp_joint_name}
        else
            cat ${last_joint_name} ${file_name_2} > ${tmp_joint_name}
            rm ${last_joint_name}
        fi

        if [[ ${k} == "4" ]] ;
        then
            dst_loc="/home/xuying/java_codes/GCMP-Query/data"
            cp ${tmp_joint_name} "${dst_loc}/${joint_file_name}"
        fi
    done

echo "Step 3 -- Generate Cluster Files and Joint Them -- finished SUCESSFULLY!"

脚本如下:
#!/bin/bash

old_end=99
old_length=100
new_end=199
new_length=200

file_loc="/home/xuying/java_codes/GCMP-Query/src/util"
cd ${file_loc}

sed -i "s/${old_end}/${new_end}/g" Configuration.java
sed -i "s/${old_length}/${new_length}/g" Configuration.java

run_loc="/home/xuying/java_codes/GCMP-Query/src"
cd ${run_loc}

javac main/Demo.java
echo "Compile successfully!"
java main.Demo
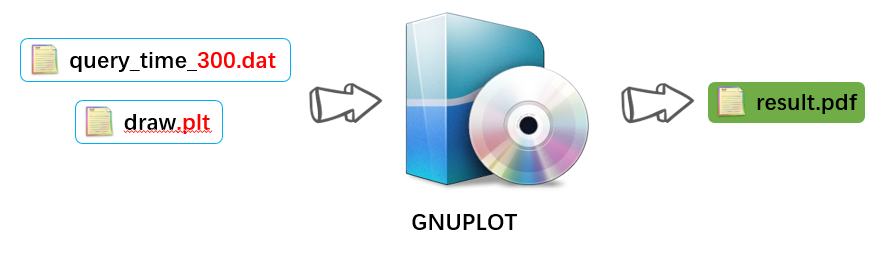
脚本如下:
#!/bin/bash

old_length=100
new_length=200

draw_loc="/home/xuying/java_codes/GCMP-Query/gnuplot_draw"
cd ${draw_loc}

sed -i "s/${old_length}/${new_length}/g" draw.plt

./draw.plt

echo "Step 4 -- Plot the results -- finished SUCCESSFULLY!"88.400000 193.600000 174.700000 177.600000 180.900000
285.000000 170.100000 168.200000 181.700000 168.800000
293.100000 179.500000 177.800000 178.500000 178.600000
619.200000 176.600000 174.200000 173.700000 175.700000#!/usr/bin/gnuplot
reset
set terminal pdfcairo lw 2 font "Helvetica, 18" size 12, 8
set output "query_time.pdf"
set multiplot
################################################### (1--r)
set origin 0.18, 0.0
set size 0.33, 0.45
set tmargin 1
set xlabel font "Arial,20"
set ylabel font "Arial,20"
set ylabel "Query Cost(ms)"
set xlabel "Time Length"
set title "Query_time vs. Time_Length"
set key box on inside left top
#vertical Left enhanced samplen 3 spacing 0.8 width -0.5 height 0 box lw 1 width 2
set xrange [0:3]
set xtics ("10" 0, "20" 1, "30" 2, "40" 3)
unset label
plot "time_len.dat" using ($1) title 't_len' with linespoints lt 1 pt 1 lw 1 lc 1
###################################################
set origin 0.52, 0.0
set size 0.33, 0.45
set tmargin 1
set xlabel font "Arial,20"
set ylabel font "Arial,20"
set ylabel "Query Cost(ms)"
set xlabel "K"
set title "Query_time vs. K"
unset key
set key box on inside left top
#vertical Left enhanced samplen 3 spacing 0.8 width -0.5 height 0 box lw 1 width 2
set xrange [0:3]
set xtics ("1" 0, "3" 1, "6" 2, "9" 3)
set ytics 700
#set yrange [0:4]
#set ytics ("0" 0, "50" 1, "100" 2, "150" 3, "200" 4)
#unset label
plot "K.dat" using ($1) title 'K' with linespoints lt 1 pt 2 lw 1 lc 2
###################################################
reset
set origin 0.0, 0.55
set size 0.33, 0.45
set tmargin 1
set xlabel font "Arial,20"
set ylabel font "Arial,20"
set ylabel "Query Cost(ms)"
set xlabel "L"
set title "Query_time vs. L"
set key box on inside left top
#vertical Left enhanced samplen 3 spacing 0.8 width -0.5 height 0 box lw 1 width 2
set xrange [0:3]
set xtics ("1" 0, "2" 1, "3" 2, "4" 3)
set ytics 700
#set yrange [0:7]
#set ytics ("0" 0, "100" 1, "200" 2, "300" 3, "400" 4, "500" 5, "600" 6, "700" 7)
unset label
plot 'L.dat' \
using ($1) title 'L' with linespoints lt 1 pt 3 lw 1 lc 3
###################################################
reset
set origin 0.33, 0.55
set size 0.33, 0.45
set tmargin 1
set xlabel font "Arial,20"
set ylabel font "Arial,20"
set ylabel "Query Cost(ms)"
set xlabel "G"
set title "Query_time vs. G"
set key box on inside left top
#vertical Left enhanced samplen 3 spacing 0.8 width -0.5 height 0 box lw 1 width 2
set xrange [0:3]
set xtics ("5" 0, "10" 1, "20" 2, "40" 3)
set ytics 700
#set yrange [0:7]
#set ytics ("0" 0, "100" 1, "200" 2, "300" 3, "400" 4, "500" 5, "600" 6, "700" 7)
unset label
plot 'G.dat' \
using ($1) title 'G' with linespoints lt 1 pt 4 lw 1 lc 4
###################################################
reset
set origin 0.66, 0.55
set size 0.33, 0.45
set tmargin 1
set xlabel font "Arial,20"
set ylabel font "Arial,20"
set ylabel "Query Cost(ms)"
set xlabel "M"
set title "Query_time vs. M"
set key box on inside left top
#vertical Left enhanced samplen 3 spacing 0.8 width -0.5 height 0 box lw 1 width 2
set xrange [0:3]
set xtics ("500" 0, "1000" 1, "2000" 2, "4000" 3)
set ytics 700
#set yrange [0:7]
#set ytics ("0" 0, "100" 1, "200" 2, "300" 3, "400" 4, "500" 5, "600" 6, "700" 7)
unset label
plot 'M.dat' \
using ($1) title 'M' with linespoints lt 1 pt 5 lw 1 lc 5
###################################################
unset multiplot
#
6、统一起来
此处,还可以写个 0_bash_config 的脚本,将各个脚本文件中的预设参数值给统一替换:
#!/bin/bash

let old_sta_pre_value=0
let old_sta_nxt_value=${old_sta_pre_value}+100

let new_sta_pre_value=100
let new_sta_nxt_value=${new_sta_pre_value}+100

let old_first_end_pre_value=19
let old_first_end_nxt_value=${old_first_end_pre_value}+100

let new_first_end_pre_value=119
let new_first_end_nxt_value=${new_first_end_pre_value}+100

let old_end_pre_value=99
let old_end_nxt_value=${old_end_pre_value}+100

let new_end_pre_value=199
let new_end_nxt_value=${new_end_pre_value}+100

let old_length_pre_value=100
let old_length_nxt_value=${old_length_pre_value}+100

let new_length_pre_value=200
let new_length_nxt_value=${new_length_pre_value}+100

echo "new_length_nxt_value=${new_length_nxt_value}"

pre_string_1="old_sta=${old_sta_pre_value}"
nxt_string_1="old_sta=${old_sta_nxt_value}"

pre_string_2="new_sta=${new_sta_pre_value}"
nxt_string_2="new_sta=${new_sta_nxt_value}"

pre_string_3="old_first_end=${old_first_end_pre_value}"
nxt_string_3="old_first_end=${old_first_end_nxt_value}"

pre_string_4="new_first_end=${new_first_end_pre_value}"
nxt_string_4="new_first_end=${new_first_end_nxt_value}"

pre_string_5="old_end=${old_end_pre_value}"
nxt_string_5="old_end=${old_end_nxt_value}"

pre_string_6="new_end=${new_end_pre_value}"
nxt_string_6="new_end=${new_end_nxt_value}"

pre_string_7="old_length=${old_length_pre_value}"
nxt_string_7="old_length=${old_length_nxt_value}"

pre_string_8="new_length=${new_length_pre_value}"
nxt_string_8="new_length=${new_length_nxt_value}"

bash_loc="/home/xuying/java_codes/bashes"

sed -i "s/${pre_string_1}/${nxt_string_1}/g" ${bash_loc}/*
sed -i "s/${pre_string_2}/${nxt_string_2}/g" ${bash_loc}/*
sed -i "s/${pre_string_3}/${nxt_string_3}/g" ${bash_loc}/*
sed -i "s/${pre_string_4}/${nxt_string_4}/g" ${bash_loc}/*
sed -i "s/${pre_string_5}/${nxt_string_5}/g" ${bash_loc}/*
sed -i "s/${pre_string_6}/${nxt_string_6}/g" ${bash_loc}/*
sed -i "s/${pre_string_7}/${nxt_string_7}/g" ${bash_loc}/*
sed -i "s/${pre_string_8}/${nxt_string_8}/g" ${bash_loc}/*


echo "Step 0 -- Config all bash files -- finished SUCESSFULLY!"
最后,还可以写一个 run_all 的脚本文件:
#!/bin/bash

./0_config
./1_mod_folder_name
./2_mod_cltgen_config
./3_gen_cluter_files
./4_run_gcmp_query
./5_plot_result

echo "** Congratulations!! all is Completed!!!  **"
好了,写到这儿,只要代码没错。那么,每次重新从 生成 cluster_files 到 生成最终结果图,只需要两步:
1) 修改 0_bash_config 中的参数值
2) 运行 run_all
root@bmc~: chmod +x run_all
root@bmc~: ./run_all
大家周一愉快:)


 381
381

 被折叠的 条评论
为什么被折叠?
被折叠的 条评论
为什么被折叠?
 到【灌水乐园】发言


