前言
Google Earth Engine (GEE) 是一个强大的基于云的系统,用于分析大量遥感数据。 Google Earth Engine 大放异彩的一个领域是能够计算从深度图像堆栈中提取的值的时间序列。 虽然 GEE 擅长处理数字,但它的制图能力有限。 这就是 QGIS 的用武之地。使用适用于 QGIS 和 Python 的 Google 地球引擎插件,您可以将 GEE 的计算能力与 QGIS 的制图功能结合起来。 在这篇文章中,我将展示如何编写 PyQGIS 代码以编程方式获取时间序列数据,并渲染地图模板以创建如下所示的动画地图。

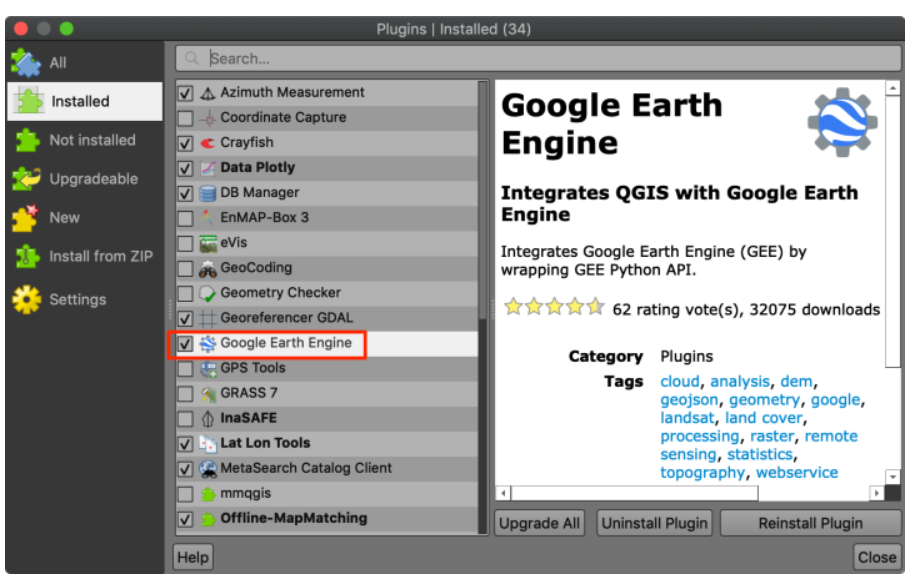
1、GEE插件安装
在 QGIS 中,转到插件 → 管理和安装插件并安装“Google Earth Engine”插件。 安装后,系统会提示您使用 Google Earth Engine 帐户进行身份验证。

2、模板下载
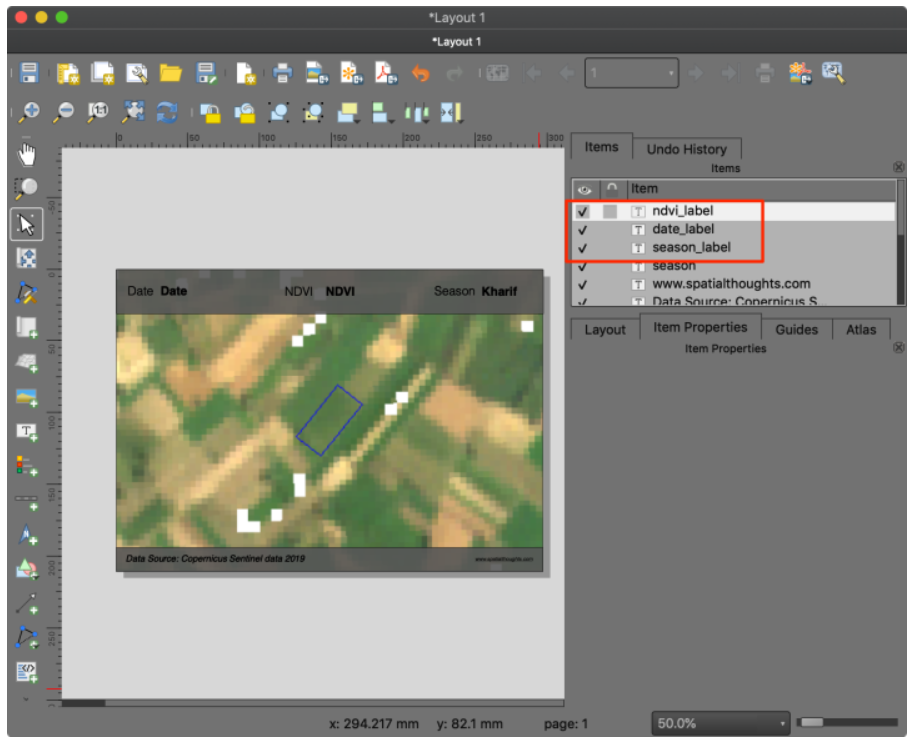
我使用 QGIS Print Layout 准备了地图布局并将其保存为模板文件。 下载模板 ndvi_map.qpt 并将其保存到您的桌面。 请注意,对于动画的每一帧,我们必须提取图像数据并使用 date_label、ndvi_label 和 season_label 的值渲染模板。

3、数据准备与制作
我们将使用 Sentinel-2 表面反射率 (SR) 数据来计算印度北部一个农场 2019 年的 NDVI 值。 Nicholas Clinton 在本教程中很好地演示了从图像集合中提取时间序列背后的概念。 此示例针对 Python 改编此代码并添加一些增强功能以选择 100% 农场区域无云的图像。
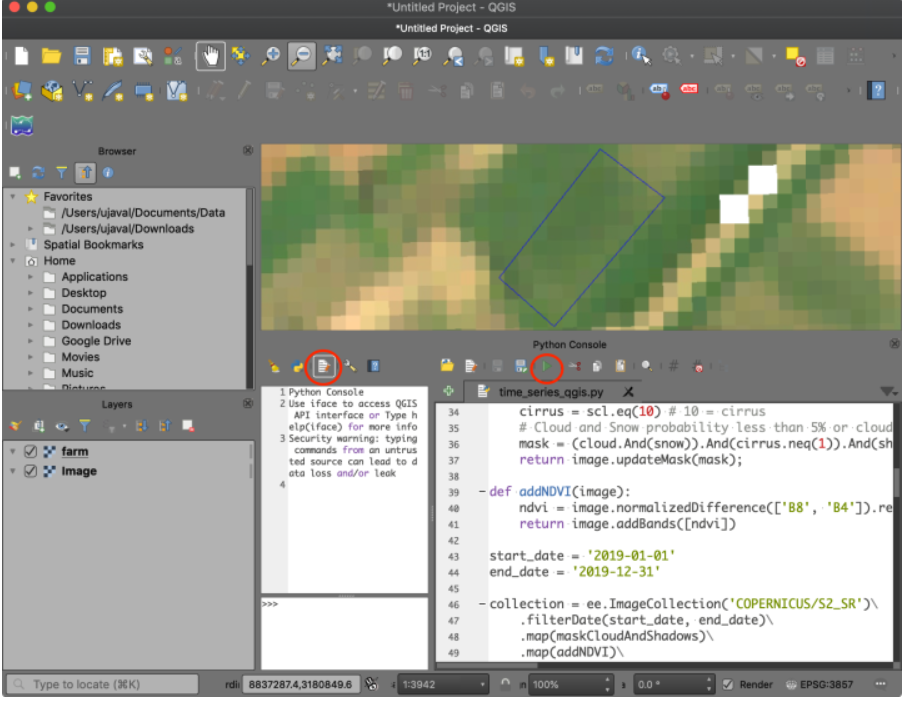
Earth Engine 代码与 PyQGIS 代码无缝集成。 您可以像在 Python 控制台的其他地方使用 Earth Engine Python API 一样使用它。 打开插件 → Python 控制台。 单击“显示编辑器”按钮打开内置编辑器。 复制/粘贴下面的代码,然后单击“运行”以执行代码。

import ee
from ee_plugin import Map
import os
from datetime import datetime

# Script assumes you put the ndvi_map.qpt file on your Desktop
home_dir = os.path.join(os.path.expanduser('~'))
template = os.path.join(home_dir, 'Desktop', 'ndvi_map.qpt')

geometry = ee.Geometry.Polygon([[
    [79.38757620268325, 27.45829434648896],
    [79.38834214903852, 27.459092793050313],
    [79.38789690234205, 27.459397436737895],
    [79.38718343474409, 27.458592985177017]
    ]])
farm = ee.Feature(geometry, {'name': 'farm'})
fc = ee.FeatureCollection([farm])
Map.centerObject(fc)
empty = ee.Image().byte();
outline = empty.paint(**{
  'featureCollection': fc,
  'color': 1,
  'width': 1
});
viz_params = {'bands': ['B4', 'B3', 'B2'], 'min': 0, 'max': 2000}

def maskCloudAndShadows(image):
    cloudProb = image.select('MSK_CLDPRB')
    snowProb = image.select('MSK_SNWPRB')
    cloud = cloudProb.lt(5)
    snow = snowProb.lt(5)
    scl = image.select('SCL');
    shadow = scl.eq(3) #3 = cloud shadow
    cirrus = scl.eq(10) # 10 = cirrus
    # Cloud and Snow probability less than 5% or cloud shadow classification
    mask = (cloud.And(snow)).And(cirrus.neq(1)).And(shadow.neq(1))
    return image.updateMask(mask);

def addNDVI(image):
    ndvi = image.normalizedDifference(['B8', 'B4']).rename('ndvi')
    return image.addBands([ndvi])

start_date = '2019-01-01'
end_date = '2019-12-31'

collection = ee.ImageCollection('COPERNICUS/S2_SR')\
    .filterDate(start_date, end_date)\
    .map(maskCloudAndShadows)\
    .map(addNDVI)\
    .filter(ee.Filter.intersects('.geo', farm.geometry()))

def get_ndvi(image):
    stats = image.select('ndvi').reduceRegion(**{
        'geometry': farm.geometry(),
        'reducer': ee.Reducer.mean().combine(**{
            'reducer2': ee.Reducer.count(),
            'sharedInputs': True}
            ).setOutputs(['mean', 'pixelcount']),
        'scale': 10
        })
    ndvi = stats.get('ndvi_mean')
    pixelcount = stats.get('ndvi_pixelcount')
    return ee.Feature(None, {
        'ndvi': ndvi,
        'validpixels': pixelcount,
        'id': image.id(),
        'date': ee.Date(image.get('system:time_start')).format('YYYY-MM-dd')
      })


with_ndvi = collection.map(get_ndvi)
# Find how many pixels in the farm extent
max_validpixels = with_ndvi.aggregate_max('validpixels').getInfo()

def select_color(ndvi):
    ndvi_colors = {
        0.3: QColor('#dfc27d'),
        0.5: QColor('#c2e699'),
        1: QColor('#31a354')}

    for max_value, color in ndvi_colors.items():
        if ndvi < max_value:
            return color

def select_season(date_str):
    seasons = {
        'Kharif': [7, 8, 9,10],
        'Rabi': [11, 12, 1, 2, 3],
        'Summer': [4, 5, 6]
    }
    date = datetime.strptime(date_str, '%Y-%m-%d')
    month = date.month
    for season, months in seasons.items():
        if month in months:
            return season

features = with_ndvi.getInfo()['features']
for feature in features:
    ndvi = feature['properties']['ndvi']
    validpixels = feature['properties']['validpixels']
    date = feature['properties']['date']
    id = feature['properties']['id']
    # The following condition ensures we pick images where
    # all pixels in the farm geometry are unmasked
    if ndvi and (validpixels == max_validpixels):
        image = ee.Image(collection.filter(
            ee.Filter.eq('system:index', id)).first())
        Map.addLayer(image, viz_params, 'Image')
        Map.addLayer(outline, {'palette': '0000FF'}, 'farm')
        project = QgsProject.instance()
        layout = QgsLayout(project)
        layout.initializeDefaults()
        with open(template) as f:
            template_content = f.read()
        doc = QDomDocument()
        doc.setContent(template_content)
        # adding to existing items
        items, ok = layout.loadFromTemplate(doc, QgsReadWriteContext(), False)
        ndvi_label = layout.itemById('ndvi_label')
        ndvi_label.setText('{:.2f}'.format(ndvi))
        ndvi_label.setFontColor(select_color(ndvi))

        date_label = layout.itemById('date_label')
        date_label.setText(date)

        season = select_season(date)
        season_label = layout.itemById('season_label')
        season_label.setText(season)

        exporter = QgsLayoutExporter(layout)
        output_image = os.path.join(home_dir, 'Desktop', '{}.png'.format(date))
        exporter.exportToImage(output_image, QgsLayoutExporter.ImageExportSettings())
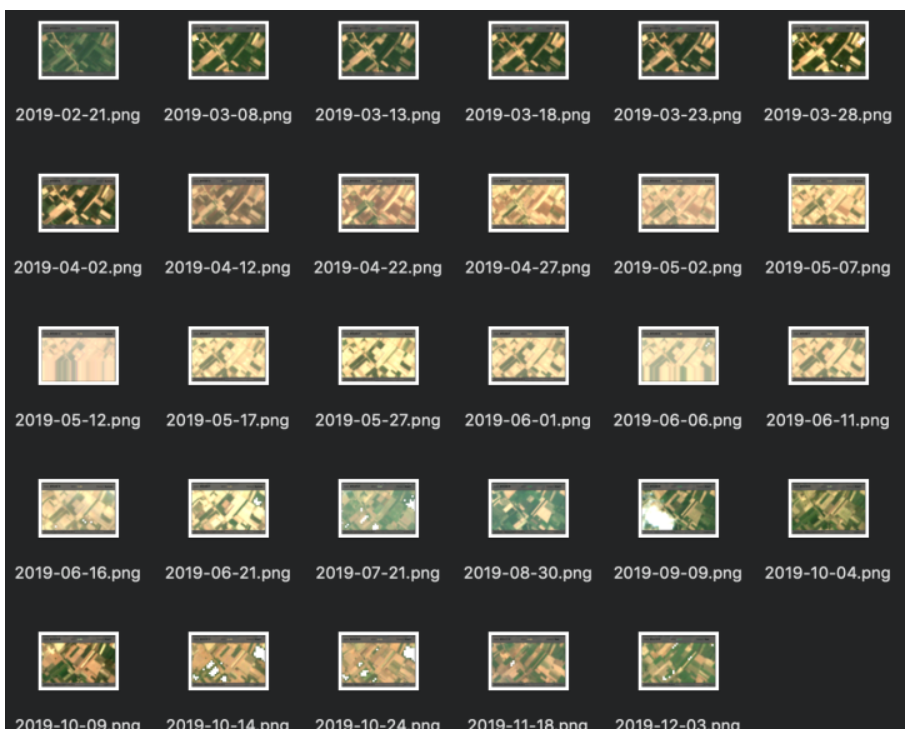
该脚本将遍历每个图像并使用适当的图像和数据呈现模板。 所有处理都使用 Google Earth Engine 在云端完成,只有结果会流式传输到 QGIS。 如果一切顺利,几分钟后,系统将处理完千兆字节的数据,您的桌面上将出现一堆图像。 您可以使用像 ezgif.com 这样的程序为它们制作动画。


 1352
1352

 被折叠的 条评论
为什么被折叠?


