


 通过自定义刻度线提升图表展示效果,实现更精确的数据可视化,同时分享了导出高分辨率图片的技巧。
经过一番折腾,发现最好的方法还是自定义刻度线,而且这也是最自由的方法了,而且实现起来还不复杂
查找替换的方法试过了 出图也不满意
原代码:
ListLinePlot[data,
  PlotStyle -> Directive[Black, Thin],
  MeshStyle -> Black, PlotMarkers -> "\[FilledDiamond]",
  Frame -> {{True, False}, {True, False}},
  FrameLabel -> {s@"Temperature T/\[Degree]C", s@"Pressure P/MPa"},
  FrameTicksStyle ->
   Directive[FontFamily -> "Times New Roman", 12, Black],
  FrameStyle -> AbsoluteThickness[1]] /.
 s[t_] :> Style[t, FontFamily -> "Times New Roman", 12, Black, Italic]
最终代码
ListLinePlot[data,
  PlotStyle -> Directive[Black, AbsoluteThickness@.5],
  MeshStyle -> Black, PlotMarkers -> Style["\[FilledDiamond]", 8],
  Frame -> {{True, False}, {True, False}},
  FrameTicks -> {Table[
     If[Mod[i, 5] == 0, {i, i, {0.02, 0}}, {i, "", {0.01, 0}}], {i, 0, 25}],
    Table[
     If[Mod[i, 5] == 0, {i, i, {0.02, 0}}, {i, "", {0.01, 0}}], {i, 0, 35}]},
  FrameLabel -> {s@"Temperature T/\[Degree]C", s@"Pressure P/MPa"},
  FrameTicksStyle ->
   Directive[FontFamily -> "Times New Roman", 12, Black]] /.
 s[t_] :> Style[t, FontFamily -> "Times New Roman", 12, Black, Italic]
导出图片的代码,注意最后的ImageResolution -> 300
Export["1.png",图片 , ImageResolution -> 300]
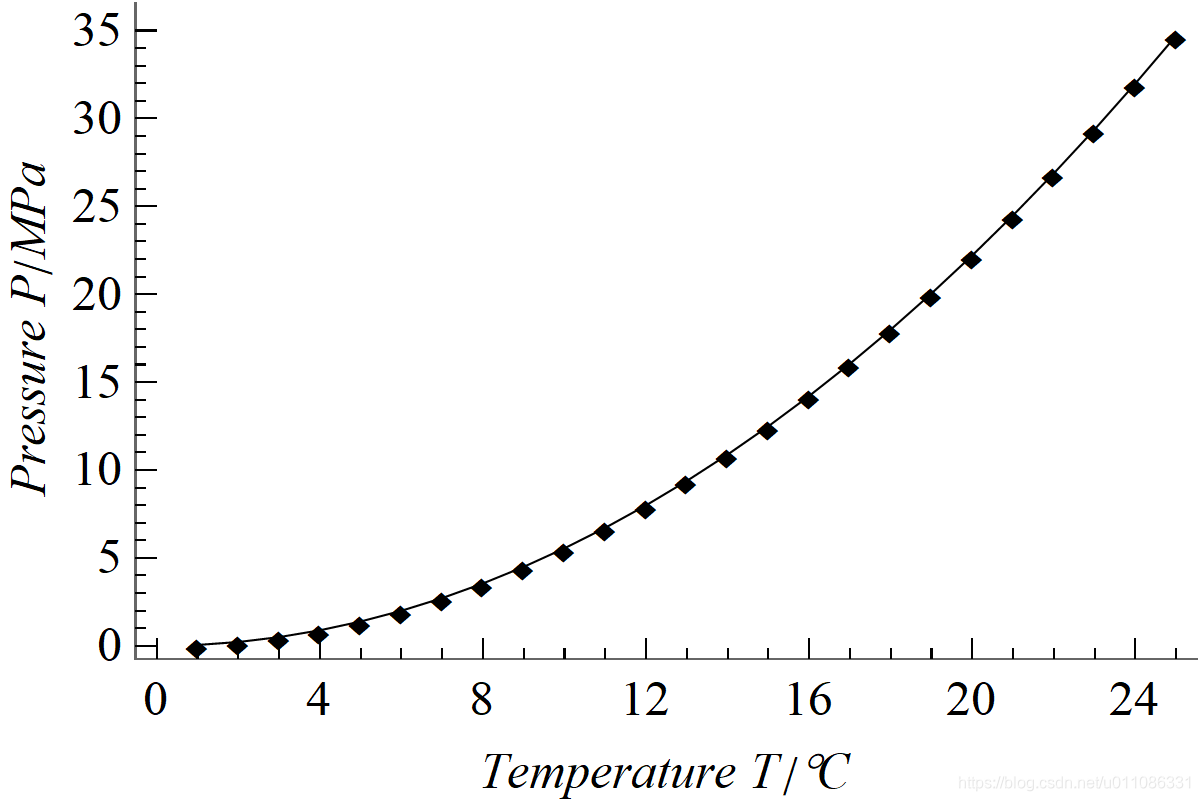
最终得到的图片


 8990
8990

 被折叠的 条评论
为什么被折叠?
被折叠的 条评论
为什么被折叠?
 到【灌水乐园】发言


