


本系列所有文章可以在这里查看http://blog.csdn.net/cloud_castle/article/category/2123873
接上文Qt5官方demo解析集30——Extending QML - Binding Example
最近在做QML制表,因此想找一些相关曲线绘制的demo看看,结果发现了这个例子,觉得挺不错,它相比于我们之前的Extend和Particle系列显得更大一些,涉及到的面也更广一些。因此想拿过来给大家分享~
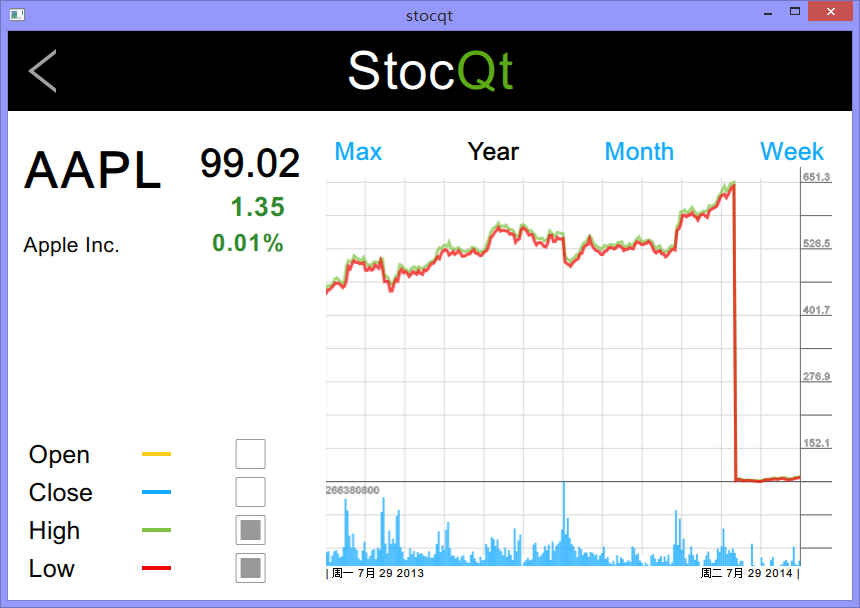
这个例子是基于QML的股票走势图绘制,数据来源于yahoo的纳达克斯-100指数,向左滑动可以选择股票。
曲线页面:
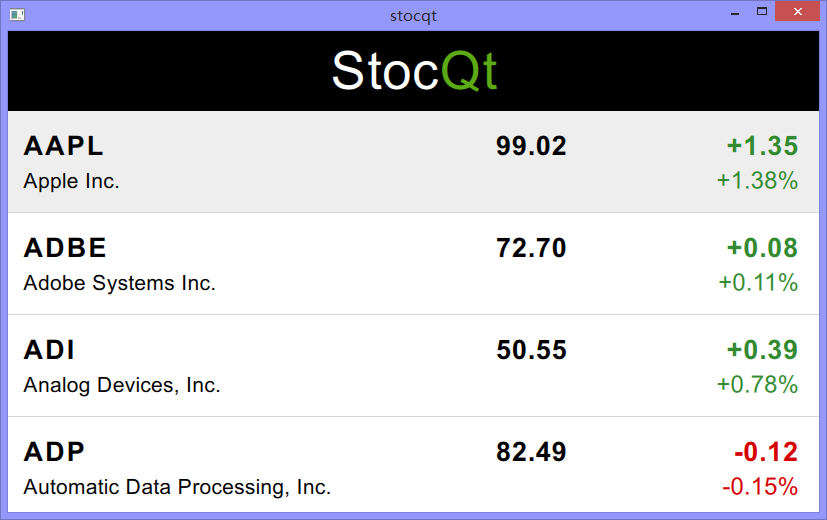
列表页面:
工程目录如下:
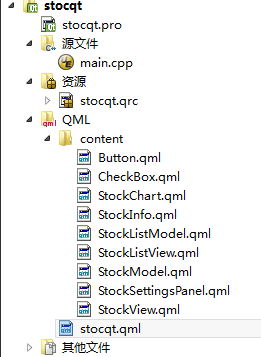
这个例子的结构会稍微复杂一些,我建议大家在QtCreator中将这个例子打开,这样有什么想法或是疑虑时我们可以将代码改改,或是添加一些输出信息,举一反三的学习总是比较有效的。
ok,我们自顶而下的跟着调用的顺序来:
stocqt.qml:
import QtQuick 2.0
import QtQml.Models 2.1
import "./content"                   // 添加其他qml文件路径

Rectangle {
    id: mainRect
    width: 1000
    height: 700

    property int listViewActive: 0      // 该页面实际是一个ListView的一部分,这个属性用来表明前面的列表页面是否被激活

    Rectangle {                         // 导航栏
        id: banner
        height: 80
        anchors.top: parent.top
        width: parent.width
        color: "#000000"

        Image {
            id: arrow
            source: "./content/images/icon-left-arrow.png"
            anchors.left: banner.left
            anchors.leftMargin: 20
            anchors.verticalCenter: banner.verticalCenter
            visible: root.currentIndex == 1 ? true : false  // 曲线页面是ListView的第二个页面,currentIndex的值也就是1

            MouseArea {
                anchors.fill: parent
                onClicked: listViewActive = 1;
            }
        }

        Item {                                    // 将相关组件放在一个Item容器中
            id: textItem
            width: stocText.width + qtText.width           // 容器的尺寸由组件决定
            height: stocText.height + qtText.height
            anchors.horizontalCenter: banner.horizontalCenter
            anchors.verticalCenter: banner.verticalCenter

            Text {                                  // Stoc
                id: stocText
                anchors.verticalCenter: textItem.verticalCenter
                color: "#ffffff"
                font.family: "Abel"
                font.pointSize: 40
                text: "Stoc"
            }
            Text {                                   // Qt
                id: qtText
                anchors.verticalCenter: textItem.verticalCenter
                anchors.left: stocText.right
                color: "#5caa15"
                font.family: "Abel"
                font.pointSize: 40
                text: "Qt"
            }
        }
    }

    ListView {                        // 标题栏下方则是ListView的内容,它为列表页面与曲线页面提供了滑动切换的能力
        id: root
        width: parent.width
        anchors.top: banner.bottom
        anchors.bottom: parent.bottom
        snapMode: ListView.SnapOneItem        // 设置该属性使View停止在一个完整的页面上
        highlightRangeMode: ListView.StrictlyEnforceRange
        highlightMoveDuration: 250                  // 这里设置了一个无形的高亮,它不显示,但提供了0.25秒的切换动画
        focus: false
        orientation: ListView.Horizontal
        boundsBehavior: Flickable.StopAtBounds     // 滑动时停在边界,默认可以拉拽更远并在弹回时带有超调效果
        currentIndex: listViewActive == 0 ? 1 : 0  // 使用属性绑定,当listViewActive被激活时,使currentIndex置0,从而跳转到列表页面
        onCurrentIndexChanged: {
            if (currentIndex == 1)
                listViewActive = 0;
        }

        StockModel {                            // 初始化数据模型
            id: stock
            stockId: listView.currentStockId     // 注意这个listView不是其父ListView,而是下面那个,即列表页面
            stockName: listView.currentStockName  // 列表页面将当前所选的股票ID及名字赋给StockModel,使其取得相应的数据
            onStockIdChanged: stock.updateStock(); // 当ID改变时数据更新
            onDataReady: {
                console.log(listView.currentStockId, listView.currentStockName)
                root.positionViewAtIndex(1, ListView.SnapPosition)    // 上面的高亮即为这里的ListView.SnapPosition做准备,数据变更后切换到曲线页面,带有0.25秒的过渡动画
                stockView.update()                                    // 页面更新
            }
        }

        model: ObjectModel {       // ObjectModel源自上面import的Qt.QML.Model 2.1,它使得ListView可以使用一组对象作为模型
            StockListView {           // 列表页面
                id: listView
                width: root.width
                height: root.height
            }

            StockView {               // 曲线页面
                id: stockView
                width: root.width
                height: root.height
                stocklist: listView
                stock: stock
            }
        }
    }
}
StockModel.qml:
import QtQuick 2.0

ListModel {                                  // ListModel作为根项目,自定义属性作为接口,并定义了多个函数。但他本身在初始化时并不进行运算
    id: model
    property string stockId: ""              // 股票ID
    property string stockName: ""            // 股票名
    property string stockDataCycle: "d"      // 数据周期
    property bool ready: false               // 标志位
    property real stockPrice: 0.0           // 股票价格
    property real stockPriceChanged: 0.0    // 价格变化

    signal dataReady                      // 耗时的数据类通常需要定义这个信号

    function indexOf(date) {                               // 返回从特定date的数据在数据集中的位置
        var newest = new Date(model.get(0).date);               // 获取第一个数据对象的日期
        var oldest = new Date(model.get(model.count - 1).date); // 最后一个数据对象的日期
        if (newest <= date)
            return -1;                                // 在最新日期之后直接返回

        if (oldest >= date)
            return model.count - 1;                  // 在最先日期之前全部返回

        var currDiff = 0;
        var bestDiff = Math.abs(date.getTime() - newest.getTime());
        var retval = 0;                                            // 返回变量
        for (var i = 0; i < model.count; i++) {
            var d = new Date(model.get(i).date);
            currDiff = Math.abs(d.getTime() - date.getTime());    // 计算时间差值
            if (currDiff < bestDiff) {                         // 从最新时间向目标时间推进
                bestDiff = currDiff;
                retval = i;                                   // retval记录数据位置
            }
            if (currDiff > bestDiff)                       // 当达到目标时间后
                return retval;                             // 将数据位置返回
        }

        return -1;
    }

    function requestUrl() {                        // 创建请求数据的url字符串函数
        if (stockId === "")
            return;

        var startDate = new Date(2011, 4, 25);      // 指定一个开始时间

        var endDate = new Date();                   // 结束时间为当前时间

        if (stockDataCycle !== "d" && stockDataCycle !== "w" && stockDataCycle !== "m")
            stockDataCycle = "d";                  // 如果数据周期不是'天'、'周'、'月',则定义为'天'

        /*                                          // 注释给出了向yahoo请求数据的格式
            Fetch stock data from yahoo finance:
             url: http://ichart.finance.yahoo.com/table.csv?s=NOK&a=5&b=11&c=2010&d=7&e=23&f=2010&g=d&ignore=.csv
                s:stock name/id, a:start day, b:start month, c:start year  default: 25 April 1995, oldest c= 1962
                d:end day, e:end month, f:end year, default:today  (data only available 3 days before today)
                g:data cycle(d daily,  w weekly, m monthly, v Dividend)
          */
        var request = "http://ichart.finance.yahoo.com/table.csv?";
        request += "s=" + stockId;
        request += "&a=" + startDate.getMonth();
        request += "&b=" + startDate.getDate();
        request += "&c=" + startDate.getFullYear();
        request += "&d=" + endDate.getMonth();
        request += "&e=" + endDate.getDate();
        request += "&f=" + endDate.getFullYear();
        request += "&g=" + stockDataCycle;
        request += "&ignore=.csv";
        return request;                             // 返回这一长串url
    }

    function createStockPrice(r) {               // 存储数据对象函数
        return {                                 // 用来接收下面分离的7位数据,以类似结构体的形式存储下来
                "date": r[0],                    // 这也是该model真正存储的数据类型格式
                "open":r[1],
                "high":r[2],
                "low":r[3],
                "close":r[4],
                "volume":r[5],
                "adjusted":r[6]
               };
    }

    function updateStock() {               // 数据更新
        var req = requestUrl();             // 得到请求数据的url字符串

        if (!req)
            return;

        var xhr = new XMLHttpRequest;      // 创建一个XMLHttp的请求对象

        xhr.open("GET", req, true);        // 初始化请求参数,还未发送请求

        model.ready = false;               // 标志位置false
        model.clear();                     // 数据清空
        var i = 1;                          // 输出一下调试信息可知,返回的数据第一行为描述符,因此将其跳过
        xhr.onreadystatechange = function() {  // readyState是XMLHttpRequest的一个属性,其值从0变化到4
            if (xhr.readyState === XMLHttpRequest.LOADING || xhr.readyState === XMLHttpRequest.DONE) {
                var records = xhr.responseText.split('\n');        // LOADING为3,DONE为4,分别表示数据正在载入和载入完成
                                                                   // 以换行符分割数据
                for (;i < records.length; i++ ) {
                    var r = records[i].split(',');                 // 以逗号将数据分割
                    if (r.length === 7)                            // 数据校验
                        model.append(createStockPrice(r));         // 函数调用,向model中添加数据
                }

                if (xhr.readyState === XMLHttpRequest.DONE) {
                    if (model.count > 0) {
                        model.ready = true;
                        model.stockPrice = model.get(0).adjusted;  // 将最新的的调整收盘价赋予stockPrice
                        model.stockPriceChanged = model.count > 1 ? (Math.round((model.stockPrice - model.get(1).close) * 100) / 100) : 0;                                                                                   // 相比前一天的收盘价变化率
                        model.dataReady();                         //emit signal
                    }
                }
            }
        }
        xhr.send()                                         // 实际发出数据请求
    }
}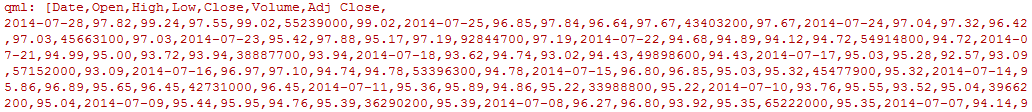
实际的数据被'\n'分开,也就是说,类似下面这个样子:
Data,Open,High,Low,Close,Volume,Adj Close,
2014-7-28,97.82,99.24,97.55,99.02,55239000,99.02,
2014-7-25 ......(7-26,7-27?周末休市啦......)
为了得到各股的变化率等,StockListView也采取了类似的实现方式:
StockListView.qml:
import QtQuick 2.0

Rectangle {
    id: root
    width: 320
    height: 410
    anchors.top: parent.top
    anchors.bottom: parent.bottom
    color: "white"

    property string currentStockId: ""
    property string currentStockName: ""

    ListView {
        id: view
        anchors.fill: parent
        width: parent.width
        clip: true                            // clip以延时加载数据
        keyNavigationWraps: true
        highlightMoveDuration: 0
        focus: true
        snapMode: ListView.SnapToItem
        model: StockListModel{}                 // 定义model

        function requestUrl(stockId) {            // 最近5天的url创建函数,与StockModel不同的是,由于未定义stockId属性,它带有这样一个参数
            var endDate = new Date("");            // today
            var startDate = new Date()
            startDate.setDate(startDate.getDate() - 5);

            var request = "http://ichart.finance.yahoo.com/table.csv?";
            request += "s=" + stockId;
            request += "&g=d";
            request += "&a=" + startDate.getMonth();
            request += "&b=" + startDate.getDate();
            request += "&c=" + startDate.getFullYear();
            request += "&d=" + endDate.getMonth();
            request += "&e=" + endDate.getDate();
            request += "&f=" + endDate.getFullYear();
            request += "&g=d";
            request += "&ignore=.csv";
            return request;
        }

        function getCloseValue(index) {
            var req = requestUrl(model.get(index).stockId);   // 得到对应的股票Id

            if (!req)
                return;

            var xhr = new XMLHttpRequest;

            xhr.open("GET", req, true);

            xhr.onreadystatechange = function() {
                if (xhr.readyState === XMLHttpRequest.LOADING || xhr.readyState === XMLHttpRequest.DONE) {
                    var records = xhr.responseText.split('\n');
                    if (records.length > 0) {
                        var r = records[1].split(',');               // 第一条数据,即最新一天的数据
                        model.setProperty(index, "value", r[4]);     // 与StockModel类似,第五个数据为'Close',即收盘价
                                                                     // 这里将model中index位置数据的"value"值设置为该收盘价                                                                                                    // 注意这个model是StockListModel而不是StockModel
                        var today = parseFloat(r[4]);            // parseFloat()将字符串转化成浮点数,变量声明为var而不是real
                        r = records[2].split(',');                  // 再取前一天数据
                        var yesterday = parseFloat(r[4]);
                        var change = today - yesterday;             // 计算变化值
                        if (change >= 0.0)
                            model.setProperty(index, "change", "+" + change.toFixed(2));  // 同样对model赋值大于零则带+号,保留两位小数
                        else
                            model.setProperty(index, "change", change.toFixed(2));

                        var changePercentage = (change / yesterday) * 100.0;         // 变化率百分比
                        if (changePercentage >= 0.0)
                            model.setProperty(index, "changePercentage", "+" + changePercentage.toFixed(2) + "%");
                        else
                            model.setProperty(index, "changePercentage", changePercentage.toFixed(2) + "%");
                    }
                }
            }
            xhr.send()              // 发送请求
        }

        onCurrentIndexChanged: {                       // 当该ListView中的某个项目被选中
            mainRect.listViewActive = 0;                         // 切换主ListView的页面
            root.currentStockId = model.get(currentIndex).stockId;       // 获取 Id 与 name
            root.currentStockName = model.get(currentIndex).name;
        }

        delegate: Rectangle {                    // 委托组件,基本都是布局,不多说了
            height: 102
            width: parent.width
            color: "transparent"
            MouseArea {
                anchors.fill: parent;
                onClicked: {
                    view.currentIndex = index;
                }
            }

            Text {
                id: stockIdText
                anchors.top: parent.top
                anchors.topMargin: 15
                anchors.left: parent.left
                anchors.leftMargin: 15
                width: 125
                height: 40
                color: "#000000"
                font.family: "Open Sans"                // 我的机器貌似不支持这种字体
                font.pointSize: 20
                font.weight: Font.Bold
                verticalAlignment: Text.AlignVCenter
                text: stockId
            }

            Text {
                id: stockValueText
                anchors.top: parent.top
                anchors.topMargin: 15
                anchors.right: parent.right
                anchors.rightMargin: 0.31 * parent.width
                width: 190
                height: 40
                color: "#000000"
                font.family: "Open Sans"
                font.pointSize: 20
                font.bold: true
                horizontalAlignment: Text.AlignRight
                verticalAlignment: Text.AlignVCenter
                text: value
                Component.onCompleted: view.getCloseValue(index);
            }

            Text {
                id: stockValueChangeText
                anchors.top: parent.top
                anchors.topMargin: 15
                anchors.right: parent.right
                anchors.rightMargin: 20
                width: 135
                height: 40
                color: "#328930"
                font.family: "Open Sans"
                font.pointSize: 20
                font.bold: true
                horizontalAlignment: Text.AlignRight
                verticalAlignment: Text.AlignVCenter
                text: change
                onTextChanged: {
                    if (parseFloat(text) >= 0.0)           // 正为绿色,负为红色
                        color = "#328930";
                    else
                        color = "#d40000";
                }
            }

            Text {
                id: stockNameText
                anchors.top: stockIdText.bottom
                anchors.left: parent.left
                anchors.leftMargin: 15
                width: 330
                height: 30
                color: "#000000"
                font.family: "Open Sans"
                font.pointSize: 16
                font.bold: false
                elide: Text.ElideRight
                maximumLineCount: 1
                verticalAlignment: Text.AlignVCenter
                text: name
            }

            Text {
                id: stockValueChangePercentageText
                anchors.top: stockIdText.bottom
                anchors.right: parent.right
                anchors.rightMargin: 20
                width: 120
                height: 30
                color: "#328930"
                font.family: "Open Sans"
                font.pointSize: 18
                font.bold: false
                horizontalAlignment: Text.AlignRight
                verticalAlignment: Text.AlignVCenter
                text: changePercentage
                onTextChanged: {
                    if (parseFloat(text) >= 0.0)
                        color = "#328930";
                    else
                        color = "#d40000";
                }
            }

            Rectangle {
                id: endingLine
                anchors.bottom: parent.bottom
                anchors.left: parent.left
                height: 1
                width: parent.width
                color: "#d7d7d7"
            }
        }

        highlight: Rectangle {
            width: parent.width
            color: "#eeeeee"
        }
    }
}
为了支撑这个StockListView,我们还需要一个StockListModel.qml:
它同样是一个ListModel,由许多个ListElement构成,代码也很明了。除了name和stockId 被赋值外,value,change,changePercentage都是在view中被动态赋值的,因此均初始化为0.0。
import QtQuick 2.0

ListModel {
    id: stocks
    // Data from : http://en.wikipedia.org/wiki/NASDAQ-100          // 这里告诉了我们数据来源
    ListElement {name: "Apple Inc."; stockId: "AAPL"; value: "0.0"; change: "0.0"; changePercentage: "0.0"}
    ListElement {name: "Adobe Systems Inc."; stockId: "ADBE"; value: "0.0"; change: "0.0"; changePercentage: "0.0"}
    ListElement {name: "Analog Devices, Inc."; stockId: "ADI"; value: "0.0"; change: "0.0"; changePercentage: "0.0"}
    ListElement {name: "Automatic Data Processing, Inc."; stockId: "ADP"; value: "0.0"; change: "0.0"; changePercentage: "0.0"}
    ListElement {name: "Autodesk, Inc."; stockId: "ADSK"; value: "0.0"; change: "0.0"; changePercentage: "0.0"}
    ListElement {name: "Akamai Technologies, Inc."; stockId: "AKAM"; value: "0.0"; change: "0.0"; changePercentage: "0.0"}
    ListElement {name: "Altera Corp."; stockId: "ALTR"; value: "0.0"; change: "0.0"; changePercentage: "0.0"}
    ListElement {name: "Alexion Pharmaceuticals, Inc."; stockId: "ALXN"; value: "0.0"; change: "0.0"; changePercentage: "0.0"}
    ListElement {name: "Applied Materials, Inc."; stockId: "AMAT"; value: "0.0"; change: "0.0"; changePercentage: "0.0"}
    ListElement {name: "Amgen Inc."; stockId: "AMGN"; value: "0.0"; change: "0.0"; changePercentage: "0.0"}
    ListElement {name: "Amazon.com Inc."; stockId: "AMZN"; value: "0.0"; change: "0.0"; changePercentage: "0.0"}
    ListElement {name: "Activision Blizzard, Inc."; stockId: "ATVI"; value: "0.0"; change: "0.0"; changePercentage: "0.0"}
    ListElement {name: "Avago Technologies Limited"; stockId: "AVGO"; value: "0.0"; change: "0.0"; changePercentage: "0.0"}
    ListElement {name: "Bed Bath & Beyond Inc."; stockId: "BBBY"; value: "0.0"; change: "0.0"; changePercentage: "0.0"}
    ListElement {name: "Baidu, Inc."; stockId: "BIDU"; value: "0.0"; change: "0.0"; changePercentage: "0.0"}
    ListElement {name: "Biogen Idec Inc."; stockId: "BIIB"; value: "0.0"; change: "0.0"; changePercentage: "0.0"}
    ListElement {name: "Broadcom Corp."; stockId: "BRCM"; value: "0.0"; change: "0.0"; changePercentage: "0.0"}
    ListElement {name: "CA Technologies"; stockId: "CA"; value: "0.0"; change: "0.0"; changePercentage: "0.0"}
    ListElement {name: "Celgene Corporation"; stockId: "CELG"; value: "0.0"; change: "0.0"; changePercentage: "0.0"}
    ListElement {name: "Cerner Corporation"; stockId: "CERN"; value: "0.0"; change: "0.0"; changePercentage: "0.0"}
    ListElement {name: "Check Point Software Technologies Ltd."; stockId: "CHKP"; value: "0.0"; change: "0.0"; changePercentage: "0.0"}
    ListElement {name: "CH Robinson Worldwide Inc."; stockId: "CHRW"; value: "0.0"; change: "0.0"; changePercentage: "0.0"}
    ListElement {name: "Charter Communications, Inc."; stockId: "CHTR"; value: "0.0"; change: "0.0"; changePercentage: "0.0"}
    ListElement {name: "Comcast Corporation"; stockId: "CMCSA"; value: "0.0"; change: "0.0"; changePercentage: "0.0"}
    ListElement {name: "Costco Wholesale Corporation"; stockId: "COST"; value: "0.0"; change: "0.0"; changePercentage: "0.0"}
    ListElement {name: "Cisco Systems, Inc."; stockId: "CSCO"; value: "0.0"; change: "0.0"; changePercentage: "0.0"}
    ListElement {name: "Catamaran Corporation"; stockId: "CTRX"; value: "0.0"; change: "0.0"; changePercentage: "0.0"}
    ListElement {name: "Cognizant Technology Solutions Corporation"; stockId: "CTSH"; value: "0.0"; change: "0.0"; changePercentage: "0.0"}
    ListElement {name: "Citrix Systems, Inc."; stockId: "CTXS"; value: "0.0"; change: "0.0"; changePercentage: "0.0"}
    ListElement {name: "Discovery Communications, Inc."; stockId: "DISCA"; value: "0.0"; change: "0.0"; changePercentage: "0.0"}
    ListElement {name: "Dish Network Corp."; stockId: "DISH"; value: "0.0"; change: "0.0"; changePercentage: "0.0"}
    ListElement {name: "Dollar Tree, Inc."; stockId: "DLTR"; value: "0.0"; change: "0.0"; changePercentage: "0.0"}
    ListElement {name: "DIRECTV"; stockId: "DTV"; value: "0.0"; change: "0.0"; changePercentage: "0.0"}
    ListElement {name: "eBay Inc."; stockId: "EBAY"; value: "0.0"; change: "0.0"; changePercentage: "0.0"}
    ListElement {name: "Equinix, Inc."; stockId: "EQIX"; value: "0.0"; change: "0.0"; changePercentage: "0.0"}
    ListElement {name: "Express Scripts Holding Company"; stockId: "ESRX"; value: "0.0"; change: "0.0"; changePercentage: "0.0"}
    ListElement {name: "Expeditors International of Washington Inc."; stockId: "EXPD"; value: "0.0"; change: "0.0"; changePercentage: "0.0"}
    ListElement {name: "Expedia Inc."; stockId: "EXPE"; value: "0.0"; change: "0.0"; changePercentage: "0.0"}
    ListElement {name: "Fastenal Company"; stockId: "FAST"; value: "0.0"; change: "0.0"; changePercentage: "0.0"}
    ListElement {name: "Facebook, Inc."; stockId: "FB"; value: "0.0"; change: "0.0"; changePercentage: "0.0"}
    ListElement {name: "F5 Networks, Inc."; stockId: "FFIV"; value: "0.0"; change: "0.0"; changePercentage: "0.0"}
    ListElement {name: "Fiserv, Inc."; stockId: "FISV"; value: "0.0"; change: "0.0"; changePercentage: "0.0"}
    ListElement {name: "Twenty-First Century Fox, Inc."; stockId: "FOXA"; value: "0.0"; change: "0.0"; changePercentage: "0.0"}
    ListElement {name: "Gilead Sciences Inc."; stockId: "GILD"; value: "0.0"; change: "0.0"; changePercentage: "0.0"}
    ListElement {name: "Keurig Green Mountain, Inc."; stockId: "GMCR"; value: "0.0"; change: "0.0"; changePercentage: "0.0"}
    ListElement {name: "Google Inc."; stockId: "GOOG"; value: "0.0"; change: "0.0"; changePercentage: "0.0"}
    ListElement {name: "Google Inc."; stockId: "GOOGL"; value: "0.0"; change: "0.0"; changePercentage: "0.0"}
    ListElement {name: "Garmin Ltd."; stockId: "GRMN"; value: "0.0"; change: "0.0"; changePercentage: "0.0"}
    ListElement {name: "Henry Schein, Inc."; stockId: "HSIC"; value: "0.0"; change: "0.0"; changePercentage: "0.0"}
    ListElement {name: "Illumina Inc."; stockId: "ILMN"; value: "0.0"; change: "0.0"; changePercentage: "0.0"}
    ListElement {name: "Intel Corporation"; stockId: "INTC"; value: "0.0"; change: "0.0"; changePercentage: "0.0"}
    ListElement {name: "Intuit Inc."; stockId: "INTU"; value: "0.0"; change: "0.0"; changePercentage: "0.0"}
    ListElement {name: "Intuitive Surgical, Inc."; stockId: "ISRG"; value: "0.0"; change: "0.0"; changePercentage: "0.0"}
    ListElement {name: "KLA-Tencor Corporation"; stockId: "KLAC"; value: "0.0"; change: "0.0"; changePercentage: "0.0"}
    ListElement {name: "Kraft Foods Group, Inc."; stockId: "KRFT"; value: "0.0"; change: "0.0"; changePercentage: "0.0"}
    ListElement {name: "Liberty Global plc"; stockId: "LBTYA"; value: "0.0"; change: "0.0"; changePercentage: "0.0"}
    ListElement {name: "Liberty Interactive Corporation"; stockId: "LINTA"; value: "0.0"; change: "0.0"; changePercentage: "0.0"}
    ListElement {name: "Linear Technology Corporation"; stockId: "LLTC"; value: "0.0"; change: "0.0"; changePercentage: "0.0"}
    ListElement {name: "Liberty Media Corporation"; stockId: "LMCA"; value: "0.0"; change: "0.0"; changePercentage: "0.0"}
    ListElement {name: "Marriott International, Inc."; stockId: "MAR"; value: "0.0"; change: "0.0"; changePercentage: "0.0"}
    ListElement {name: "Mattel, Inc"; stockId: "MAT"; value: "0.0"; change: "0.0"; changePercentage: "0.0"}
    ListElement {name: "Mondelez International, Inc."; stockId: "MDLZ"; value: "0.0"; change: "0.0"; changePercentage: "0.0"}
    ListElement {name: "Monster Beverage Corporation"; stockId: "MNST"; value: "0.0"; change: "0.0"; changePercentage: "0.0"}
    ListElement {name: "Microsoft Corporation"; stockId: "MSFT"; value: "0.0"; change: "0.0"; changePercentage: "0.0"}
    ListElement {name: "Micron Technology Inc."; stockId: "MU"; value: "0.0"; change: "0.0"; changePercentage: "0.0"}
    ListElement {name: "Maxim Integrated Products, Inc."; stockId: "MXIM"; value: "0.0"; change: "0.0"; changePercentage: "0.0"}
    ListElement {name: "Mylan, Inc."; stockId: "MYL"; value: "0.0"; change: "0.0"; changePercentage: "0.0"}
    ListElement {name: "Netflix, Inc."; stockId: "NFLX"; value: "0.0"; change: "0.0"; changePercentage: "0.0"}
    ListElement {name: "NetApp, Inc."; stockId: "NTAP"; value: "0.0"; change: "0.0"; changePercentage: "0.0"}
    ListElement {name: "NVIDIA Corporation"; stockId: "NVDA"; value: "0.0"; change: "0.0"; changePercentage: "0.0"}
    ListElement {name: "NXP Semiconductors NV"; stockId: "NXPI"; value: "0.0"; change: "0.0"; changePercentage: "0.0"}
    ListElement {name: "O'Reilly Automotive Inc."; stockId: "ORLY"; value: "0.0"; change: "0.0"; changePercentage: "0.0"}
    ListElement {name: "Paychex, Inc."; stockId: "PAYX"; value: "0.0"; change: "0.0"; changePercentage: "0.0"}
    ListElement {name: "PACCAR Inc."; stockId: "PCAR"; value: "0.0"; change: "0.0"; changePercentage: "0.0"}
    ListElement {name: "The Priceline Group Inc."; stockId: "PCLN"; value: "0.0"; change: "0.0"; changePercentage: "0.0"}
    ListElement {name: "QUALCOMM Incorporated"; stockId: "QCOM"; value: "0.0"; change: "0.0"; changePercentage: "0.0"}
    ListElement {name: "Regeneron Pharmaceuticals, Inc."; stockId: "REGN"; value: "0.0"; change: "0.0"; changePercentage: "0.0"}
    ListElement {name: "Ross Stores Inc."; stockId: "ROST"; value: "0.0"; change: "0.0"; changePercentage: "0.0"}
    ListElement {name: "SBA Communications Corp."; stockId: "SBAC"; value: "0.0"; change: "0.0"; changePercentage: "0.0"}
    ListElement {name: "Starbucks Corporation"; stockId: "SBUX"; value: "0.0"; change: "0.0"; changePercentage: "0.0"}
    ListElement {name: "Sigma-Aldrich Corporation"; stockId: "SIAL"; value: "0.0"; change: "0.0"; changePercentage: "0.0"}
    ListElement {name: "Sirius XM Holdings Inc."; stockId: "SIRI"; value: "0.0"; change: "0.0"; changePercentage: "0.0"}
    ListElement {name: "SanDisk Corp."; stockId: "SNDK"; value: "0.0"; change: "0.0"; changePercentage: "0.0"}
    ListElement {name: "Staples, Inc."; stockId: "SPLS"; value: "0.0"; change: "0.0"; changePercentage: "0.0"}
    ListElement {name: "Stericycle, Inc."; stockId: "SRCL"; value: "0.0"; change: "0.0"; changePercentage: "0.0"}
    ListElement {name: "Seagate Technology Public Limited Company"; stockId: "STX"; value: "0.0"; change: "0.0"; changePercentage: "0.0"}
    ListElement {name: "Symantec Corporation"; stockId: "SYMC"; value: "0.0"; change: "0.0"; changePercentage: "0.0"}
    ListElement {name: "TripAdvisor Inc."; stockId: "TRIP"; value: "0.0"; change: "0.0"; changePercentage: "0.0"}
    ListElement {name: "Tractor Supply Company"; stockId: "TSCO"; value: "0.0"; change: "0.0"; changePercentage: "0.0"}
    ListElement {name: "Tesla Motors, Inc."; stockId: "TSLA"; value: "0.0"; change: "0.0"; changePercentage: "0.0"}
    ListElement {name: "Texas Instruments Inc."; stockId: "TXN"; value: "0.0"; change: "0.0"; changePercentage: "0.0"}
    ListElement {name: "Viacom, Inc."; stockId: "VIAB"; value: "0.0"; change: "0.0"; changePercentage: "0.0"}
    ListElement {name: "VimpelCom Ltd."; stockId: "VIP"; value: "0.0"; change: "0.0"; changePercentage: "0.0"}
    ListElement {name: "Vodafone Group Public Limited Company"; stockId: "VOD"; value: "0.0"; change: "0.0"; changePercentage: "0.0"}
    ListElement {name: "Verisk Analytics, Inc."; stockId: "VRSK"; value: "0.0"; change: "0.0"; changePercentage: "0.0"}
    ListElement {name: "Vertex Pharmaceuticals Incorporated"; stockId: "VRTX"; value: "0.0"; change: "0.0"; changePercentage: "0.0"}
    ListElement {name: "Western Digital Corporation"; stockId: "WDC"; value: "0.0"; change: "0.0"; changePercentage: "0.0"}
    ListElement {name: "Whole Foods Market, Inc."; stockId: "WFM"; value: "0.0"; change: "0.0"; changePercentage: "0.0"}
    ListElement {name: "Wynn Resorts Ltd."; stockId: "WYNN"; value: "0.0"; change: "0.0"; changePercentage: "0.0"}
    ListElement {name: "Xilinx Inc."; stockId: "XLNX"; value: "0.0"; change: "0.0"; changePercentage: "0.0"}
}
骨架已成,我们接下来就要为它添加血肉了。我在网上看到有人认为底层先于界面开发更快,也有人认为先搭界面框架再做底层更好。嗯...我倒觉得谈不上好坏之分,关键在于动手之前得有一个清晰的架构。不过底层在设计之初能够拥有丰富的API 减少日后改动,界面最初设计不要要求太高(因为总是会改的。。。),这样应该会让人比较舒服一些~
好了,扯远了,下面的StockView即是我们一开始看到的曲线界面,看看它包含哪些东西:
import QtQuick 2.0
import QtQuick.Window 2.1               // 下面的代码使用了Screen因此引入这个模块

Rectangle {
    id: root
    width: 320
    height: 480
    color: "transparent"

    property var stock: null
    property var stocklist: null
    signal settingsClicked

    function update() {                          // 用来更新图表显示
        chart.update()
    }

    Rectangle {
        id: mainRect
        color: "transparent"
        anchors.fill: parent

        StockInfo {                              // 提供左上方的股票信息
            id: stockInfo
            anchors.left: parent.left
            anchors.leftMargin: 10
            anchors.top: parent.top
            anchors.topMargin: 15
            height: 160
            anchors.right: Screen.primaryOrientation === Qt.PortraitOrientation ? parent.right : chart.left                                                                                                // 基于属性绑定的屏幕转向后布局方式的变化
            anchors.rightMargin: 20
            stock: root.stock
        }

        StockChart {                              // 右方的曲线绘制部分
            id: chart
            anchors.bottom: Screen.primaryOrientation === Qt.PortraitOrientation ? settingsPanel.top : parent.bottom
            anchors.bottomMargin: 20
            anchors.top : Screen.primaryOrientation === Qt.PortraitOrientation ? stockInfo.bottom : parent.top
            anchors.topMargin: 20
            anchors.right: parent.right
            anchors.rightMargin: 20
            width: Screen.primaryOrientation === Qt.PortraitOrientation ? parent.width - 40 : 0.6 * parent.width
            stockModel: root.stock
            settings: settingsPanel
        }

        StockSettingsPanel {                      //  左下方的显示设置面板
            id: settingsPanel
            anchors.left: parent.left
            anchors.leftMargin: 20
            anchors.right: Screen.primaryOrientation === Qt.PortraitOrientation ? parent.right : chart.left
            anchors.rightMargin: 20
            anchors.bottom: parent.bottom
            onDrawOpenPriceChanged: root.update()           // 更新
            onDrawClosePriceChanged: root.update();
            onDrawHighPriceChanged: root.update();
            onDrawLowPriceChanged: root.update();
        }
    }
}
可以看到StockView由3个主要部分构成,分别是显示当前股票信息的StockInfo、设置显示曲线的StockSettingPanel、以及最后的绘图部分StockChart。
我们按顺序来看,StockInfo.qml:
import QtQuick 2.0

Rectangle {                      // 根项目是一个透明的Rectangle。为什么不用Item,我想可能是因为当时布局的时候把color设置出来可能更方便一些
    id: root
    width: 440
    height: 160
    color: "transparent"

    property var stock: null          // var类型的stock属性,它接受的是stocqt.qml中定义的StockModel

    Text {                               // id
        id: stockIdText
        anchors.left: parent.left
        anchors.leftMargin: 5
        anchors.top: parent.top
        anchors.topMargin: 15
        color: "#000000"
        font.family: "Open Sans"
        font.pointSize: 38
        font.weight: Font.DemiBold
        text: root.stock.stockId        // 类似的,对显示文本赋值
    }

    Text {                            // name
        id: stockNameText
        anchors.left: parent.left
        anchors.leftMargin: 5
        anchors.bottom: priceChangePercentage.bottom
        anchors.right: priceChangePercentage.left
        anchors.rightMargin: 15
        color: "#000000"
        font.family: "Open Sans"
        font.pointSize: 16
        elide: Text.ElideRight
        text: root.stock.stockName
    }

    Text {                                 // 价格
        id: price
        anchors.right: parent.right
        anchors.rightMargin: 5
        anchors.top: parent.top
        anchors.topMargin: 15
        horizontalAlignment: Text.AlignRight
        color: "#000000"
        font.family: "Open Sans"
        font.pointSize: 30
        font.weight: Font.DemiBold
        text: root.stock.stockPrice
    }

    Text {                            // 价格变化
        id: priceChange
        anchors.right: parent.right
        anchors.rightMargin: 20
        anchors.top: price.bottom
        anchors.topMargin: 5
        horizontalAlignment: Text.AlignRight
        color: root.stock.stockPriceChanged < 0 ? "#d40000" : "#328930"
        font.family: "Open Sans"
        font.pointSize: 20
        font.weight: Font.Bold
        text: root.stock.stockPriceChanged
    }

    Text {                                 // 价格变化百分比
        id: priceChangePercentage
        anchors.right: parent.right
        anchors.rightMargin: 20
        anchors.top: priceChange.bottom
        anchors.topMargin: 5
        horizontalAlignment: Text.AlignRight
        color: root.stock.stockPriceChanged < 0 ? "#d40000" : "#328930"
        font.family: "Open Sans"
        font.pointSize: 18
        font.weight: Font.Bold
        text: Math.abs(Math.round(root.stock.stockPriceChanged/(root.stock.stockPrice - root.stock.stockPriceChanged) * 100))/100  +"%"
    }
}
stockSettingPanel.qml:
import QtQuick 2.0

Rectangle {
    id: root
    width: 440
    height: 160
    color: "transparent"

    property bool drawOpenPrice: openButton.buttonEnabled       // 对外的标志位
    property bool drawClosePrice: closeButton.buttonEnabled
    property bool drawHighPrice: highButton.buttonEnabled
    property bool drawLowPrice: lowButton.buttonEnabled

    property string openColor: "#face20"                   // 各曲线的颜色设置
    property string closeColor: "#14aaff"
    property string highColor: "#80c342"
    property string lowColor: "#f30000"
    property string volumeColor: "#14aaff"                 // 成交量绘制颜色

    Text {
        id: openText
        anchors.left: root.left
        anchors.top: root.top
        color: "#000000"
        font.family: "Open Sans"
        font.pointSize: 19
        text: "Open"
    }

    Text {
        id: closeText
        anchors.left: root.left
        anchors.top: openText.bottom
        anchors.topMargin: 10
        color: "#000000"
        font.family: "Open Sans"
        font.pointSize: 19
        text: "Close"
    }

    Text {
        id: highText
        anchors.left: root.left
        anchors.top: closeText.bottom
        anchors.topMargin: 10
        color: "#000000"
        font.family: "Open Sans"
        font.pointSize: 19
        text: "High"
    }

    Text {
        id: lowText
        anchors.left: root.left
        anchors.top: highText.bottom
        anchors.topMargin: 10
        color: "#000000"
        font.family: "Open Sans"
        font.pointSize: 19
        text: "Low"
    }

    Rectangle {
        height: 4
        anchors.left: root.left
        anchors.leftMargin: 114
        anchors.right: openButton.left
        anchors.rightMargin: 65
        anchors.verticalCenter: openText.verticalCenter
        color: openColor
    }

    Rectangle {
        height: 4
        anchors.left: root.left
        anchors.leftMargin: 114
        anchors.right: closeButton.left
        anchors.rightMargin: 65
        anchors.verticalCenter: closeText.verticalCenter
        color: closeColor
    }

    Rectangle {
        height: 4
        anchors.left: root.left
        anchors.leftMargin: 114
        anchors.right: highButton.left
        anchors.rightMargin: 65
        anchors.verticalCenter: highText.verticalCenter
        color: highColor
    }

    Rectangle {
        height: 4
        anchors.left: root.left
        anchors.leftMargin: 114
        anchors.right: lowButton.left
        anchors.rightMargin: 65
        anchors.verticalCenter: lowText.verticalCenter
        color: lowColor
    }

    CheckBox {                             // 自定义的CheckBox,提供了属性buttonEnabled表明是否被checked
        id: openButton
        buttonEnabled: false
        anchors.verticalCenter: openText.verticalCenter
        anchors.right: root.right
        anchors.rightMargin: 40
    }

    CheckBox {
        id: closeButton
        buttonEnabled: false
        anchors.verticalCenter: closeText.verticalCenter
        anchors.right: root.right
        anchors.rightMargin: 40
    }

    CheckBox {
        id: highButton
        buttonEnabled: true
        anchors.verticalCenter: highText.verticalCenter
        anchors.right: root.right
        anchors.rightMargin: 40
    }

    CheckBox {
        id: lowButton
        buttonEnabled: true
        anchors.verticalCenter: lowText.verticalCenter
        anchors.right: root.right
        anchors.rightMargin: 40
    }
}
自定义的CheckBox.qml:
import QtQuick 2.0

Item {
    id: button
    property bool buttonEnabled: true
    width: 30
    height: 30
    x: 5
    MouseArea {
        id: mouse
        anchors.fill: parent
        onClicked: {
            if (buttonEnabled)
                buttonEnabled = false;
            else
                buttonEnabled = true;
        }
    }
    Rectangle {
        id: checkbox
        width: 30
        height: 30
        anchors.left: parent.left
        border.color: "#999999"
        border.width: 1
        antialiasing: true
        radius: 2
        color: "transparent"
        Rectangle {
            anchors.fill: parent
            anchors.margins: 5
            antialiasing: true
            radius: 1
            color: mouse.pressed || buttonEnabled ? "#999999" : "transparent"
        }
    }
}
接着还有一个自定义的控件Button.qml,它在下面的StockChart将会用到:
import QtQuick 2.0

Rectangle {
    id: button
    signal clicked
    property alias text: txt.text            // 设置txt.text的属性别名为text,这样Rectangle就不用再声明一个属性以访问txt的text
    property bool buttonEnabled: false
    width: Math.max(64, txt.width + 16)
    height: 32
    color: "transparent"
    MouseArea {
        anchors.fill: parent
        onClicked: button.clicked()
    }
    Text {
        anchors.centerIn: parent
        font.family: "Open Sans"
        font.pointSize: 19
        font.weight: Font.DemiBold
        color: button.buttonEnabled ? "#000000" : "#14aaff"
        id: txt
    }
}
最终的绘制部分终于来了,StockChart.qml:
import QtQuick 2.0
Rectangle {
id: chart
width: 320
height: 200
property var stockModel: null
property var startDate: new Date() // new Date()初始化得到的是当前时间
property var endDate: new Date()
property string activeChart: "year" // 设置表格显示的时间跨度为一年
property var settings
property int gridSize: 4 // 每个网格宽度为4px
property real gridStep: gridSize ? (width - canvas.tickMargin) / gridSize : canvas.xGridStep // 网格数为(宽度 - 最右方那一栏的宽度)/ 网格宽度,如果gridSize为0,采用画布中的计算方式
function update() { // 更新函数
endDate = new Date();
if (chart.activeChart === "year") { // 显示一年数据
chart.startDate = new Date(chart.endDate.getFullYear() - 1, // 在当前时间的基础上减一年
chart.endDate.getMonth(),
chart.endDate.getDate());
chart.gridSize = 12; // 设置网格宽度为12,以固定网格数
}
else if (chart.activeChart === "month") { // 显示一个月数据
chart.startDate = new Date(chart.endDate.getFullYear(), // 在当前时间基础上减一个月
chart.endDate.getMonth() - 1,
chart.endDate.getDate());
gridSize = 0; // gridSize为0时,采用canvas中定义的网格宽度计算。使每个数据都绘制在坐标线上
}
else if (chart.activeChart === "week") { // 显示一周数据
chart.startDate = new Date(chart.endDate.getFullYear(), // 在当前时间基础上减七天
chart.endDate.getMonth(),
chart.endDate.getDate() - 7);
gridSize = 0;
}
else {
chart.startDate = new Date(2005, 3, 25); // 否则以2005年为初始年,并定义网格宽度为4
gridSize = 4;
}
canvas.requestPaint(); // 当更新时需要调用画布的这个函数
}
Row { // Row布局了4个自定义的按钮
id: activeChartRow
anchors.left: chart.left
anchors.right: chart.right
anchors.top: chart.top
anchors.topMargin: 4
spacing: 52
onWidthChanged: { // 该函数保证宽度变化时优先压缩spacing,且不会造成按钮重叠
var buttonsLen = maxButton.width + yearButton.width + monthButton.width + weekButton.width;
var space = (width - buttonsLen) / 3;
spacing = Math.max(space, 10);
}
Button {
id: maxButton
text: "Max"
buttonEnabled: chart.activeChart === "max"
onClicked: {
chart.activeChart = "max"; // 改变当前图表显示模式,这里的max 实际对应update中的'else',即2005年作为起始年
chart.update(); // 更新
}
}
Button {
id: yearButton
text: "Year"
buttonEnabled: chart.activeChart === "year"
onClicked: {
chart.activeChart = "year";
chart.update();
}
}
Button {
id: monthButton
text: "Month"
buttonEnabled: chart.activeChart === "month"
onClicked: {
chart.activeChart = "month";
chart.update();
}
}
Button {
id: weekButton
text: "Week"
buttonEnabled: chart.activeChart === "week"
onClicked: {
chart.activeChart = "week";
chart.update();
}
}
}
Text { // 下方的起始日期显示
id: fromDate
color: "#000000"
font.family: "Open Sans"
font.pointSize: 8
anchors.left: parent.left
anchors.bottom: parent.bottom
text: "| " + startDate.toDateString()
}
Text { // 结束日期显示
id: toDate
color: "#000000"
font.family: "Open Sans"
font.pointSize: 8
anchors.right: parent.right
anchors.rightMargin: canvas.tickMargin
anchors.bottom: parent.bottom
text: endDate.toDateString() + " |"
}
Canvas { // 画布,基本上与HTML的Canvas相同
id: canvas
// 注释介绍将下面两行语句取消注释以获得OpenGL的硬件加速渲染,为什么没有开?有些平台不支持嘛...
// Uncomment below lines to use OpenGL hardware accelerated rendering.
// See Canvas documentation for available options.
//renderTarget: Canvas.FramebufferObject // 渲染到OpenGL的帧缓冲
//renderStrategy: Canvas.Threaded // 渲染工作在一个私有渲染线程中进行
anchors.top: activeChartRow.bottom // 作为Item的派生类型,我们同样可以设置它的布局与属性
anchors.left: parent.left
anchors.right: parent.right
anchors.bottom: fromDate.top
property int pixelSkip: 1
property int numPoints: 1 // 存储数据点的个数
property int tickMargin: 32 // 右边格的宽度
property real xGridStep: (width - tickMargin) / numPoints // 网格宽度
property real yGridOffset: height / 26 // y方向向下的偏移度,用在水平线的绘制
property real yGridStep: height / 12 // 网格高度
function drawBackground(ctx) { // 界面的绘制由onPaint开始,这是绘制背景的一个函数。ctx作为传参,类似C++中的painter
ctx.save(); // 保存之前绘制内容
ctx.fillStyle = "#ffffff"; // 填充颜色,之所以叫Style是因为它还可以使用渐变等等...
ctx.fillRect(0, 0, canvas.width, canvas.height); // fillRect是一个便利函数,用来填充一个矩形区域
ctx.strokeStyle = "#d7d7d7"; // 描边颜色
ctx.beginPath();
// 水平网格线
for (var i = 0; i < 12; i++) {
ctx.moveTo(0, canvas.yGridOffset + i * canvas.yGridStep);
ctx.lineTo(canvas.width, canvas.yGridOffset + i * canvas.yGridStep);
}
// 垂直网格线
var height = 35 * canvas.height / 36; // 垂直线的高度为画布高度的 35/36
var yOffset = canvas.height - height; // 垂直线离顶部距离为高度的 1/36
var xOffset = 0;
for (i = 0; i < chart.gridSize; i++) {
ctx.moveTo(xOffset + i * chart.gridStep, yOffset);
ctx.lineTo(xOffset + i * chart.gridStep, height);
}
ctx.stroke(); // 描线
// 右方以及下方颜色较深的那几根线
ctx.strokeStyle = "#666666";
ctx.beginPath();
var xStart = canvas.width - tickMargin; // x = 画布宽度 - 价格部分宽度
ctx.moveTo(xStart, 0);
ctx.lineTo(xStart, canvas.height); // 向下画直线
for (i = 0; i < 12; i++) {
ctx.moveTo(xStart, canvas.yGridOffset + i * canvas.yGridStep); // 12根短横线
ctx.lineTo(canvas.width, canvas.yGridOffset + i * canvas.yGridStep);
}
ctx.moveTo(0, canvas.yGridOffset + 9 * canvas.yGridStep); // 移动绘制点到第九根横线左端
ctx.lineTo(canvas.width, canvas.yGridOffset + 9 * canvas.yGridStep); // 向右绘制横线
ctx.closePath(); // 完成路径
ctx.stroke(); // 描边
ctx.restore(); // 载入保存的内容
}
function drawScales(ctx, high, low, vol) // 绘制右方股票价格标尺函数
{
ctx.save();
ctx.strokeStyle = "#888888";
ctx.font = "10px Open Sans"
ctx.beginPath();
// prices on y-axis
var x = canvas.width - tickMargin + 3; // 离右边实线3px
var priceStep = (high - low) / 9.0; // 相隔最高价与最低价的差值除以9
for (var i = 0; i < 10; i += 2) { // 隔一级显示
var price = parseFloat(high - i * priceStep).toFixed(1);
ctx.text(price, x, canvas.yGridOffset + i * yGridStep - 2); // 绘制text的坐标在文字的左下角
}
// highest volume
ctx.text(vol, 0, canvas.yGridOffset + 9 * yGridStep + 12); // 绘制最高成交量
ctx.closePath();
ctx.stroke();
ctx.restore();
}
function drawPrice(ctx, from, to, color, price, points, highest, lowest) // 数据曲线绘制
{
ctx.save();
ctx.globalAlpha = 0.7; // 透明度
ctx.strokeStyle = color; // color由StockSettingPanel指定
ctx.lineWidth = 3;
ctx.beginPath();
var end = points.length; // 数据长度
var range = highest - lowest; // 取值范围
if (range == 0) {
range = 1; // range作为被除数不能为0
}
for (var i = 0; i < end; i += pixelSkip) {
var x = points[i].x;
var y = points[i][price]; // 取出对应设置的价格数据
var h = 9 * yGridStep; // 设置绘制高度为九倍的网格高度
y = h * (lowest - y)/range + h + yGridOffset; // lowest - y为非正数,h + yGridOffset为曲线绘制的底部
if (i == 0) {
ctx.moveTo(x, y); // 移动到初始点
} else {
ctx.lineTo(x, y); // 向后绘制
}
}
ctx.stroke();
ctx.restore();
}
function drawVolume(ctx, from, to, color, price, points, highest) // 成交量绘制函数
{
ctx.save();
ctx.fillStyle = color;
ctx.globalAlpha = 0.8;
ctx.lineWidth = 0; // 由于线宽影响绘制边界(参考HTML),这里将线宽设置为0
ctx.beginPath();
var end = points.length;
var margin = 0;
if (chart.activeChart === "month" || chart.activeChart === "week") {
margin = 8;
ctx.shadowOffsetX = 4; // x方向的阴影
ctx.shadowBlur = 3.5; // 模糊效果
ctx.shadowColor = Qt.darker(color);
}
// 由于柱状图的宽度限制,柱状图比实际的数据少一个
// To match the volume graph with price grid, skip drawing the initial
// volume of the first day on chart.
for (var i = 1; i < end; i += pixelSkip) {
var x = points[i - 1].x;
var y = points[i][price];
y = canvas.height * (y / highest);
y = 3 * y / 12; // 柱状图高度占画布的1/4
ctx.fillRect(x, canvas.height - y + yGridOffset,
canvas.xGridStep - margin, y); // "周"与"月"时有间隔,其他则没有
}
ctx.stroke();
ctx.restore();
}
onPaint: { // 绘制入口
if (!stockModel.ready) { // 等待数据完成
return;
}
numPoints = stockModel.indexOf(chart.startDate); // 由StockModel取得startDate到现在的数据数
if (chart.gridSize == 0)
chart.gridSize = numPoints // 使gridStep绑定到(width - canvas.tickMargin) / numPoints上
var ctx = canvas.getContext("2d"); // 创建ctx
ctx.globalCompositeOperation = "source-over"; // 混合模式
ctx.lineWidth = 1;
drawBackground(ctx); // 背景绘制
var highestPrice = 0;
var highestVolume = 0;
var lowestPrice = -1;
var points = []; // 创建一个数组
for (var i = numPoints, j = 0; i >= 0 ; i -= pixelSkip, j += pixelSkip) { // pixelSkip被定义为 1
var price = stockModel.get(i);
if (parseFloat(highestPrice) < parseFloat(price.high)) // 得到最高价
highestPrice = price.high;
if (parseInt(highestVolume, 10) < parseInt(price.volume, 10)) // 得到最低价
highestVolume = price.volume;
if (lowestPrice < 0 || parseFloat(lowestPrice) > parseFloat(price.low)) // 注意这里如果设置lowestPrice = 0或是别的数
lowestPrice = price.low; // 就有可能一直无法满足条件,因此添加这个负数使第一个price.low被赋予lowestPrice
points.push({ // 插入数据,它类似于Model,但多了一个 x 的坐标值
x: j * xGridStep,
open: price.open,
close: price.close,
high: price.high,
low: price.low,
volume: price.volume
});
}
if (settings.drawHighPrice) // 判断StockSettingPanel中相应的选项是否被勾选,然后绘制数据线段
drawPrice(ctx, 0, numPoints, settings.highColor, "high", points, highestPrice, lowestPrice);
if (settings.drawLowPrice)
drawPrice(ctx, 0, numPoints, settings.lowColor, "low", points, highestPrice, lowestPrice);
if (settings.drawOpenPrice)
drawPrice(ctx, 0, numPoints,settings.openColor, "open", points, highestPrice, lowestPrice);
if (settings.drawClosePrice)
drawPrice(ctx, 0, numPoints, settings.closeColor, "close", points, highestPrice, lowestPrice);
drawVolume(ctx, 0, numPoints, settings.volumeColor, "volume", points, highestVolume); // 成交量绘制
drawScales(ctx, highestPrice, lowestPrice, highestVolume); // 价格标尺绘制
}
}
}


 95
95

 被折叠的 条评论
为什么被折叠?
被折叠的 条评论
为什么被折叠?
 到【灌水乐园】发言


