


Qt 5.7的beta版已经出来了,这将是一个超级重大的更新,主要有几个商业版的模块在GPLv3 open source 版的用户也可以用了,其中包括了两个很炫酷的模块:
Qt Charts
Qt Data Visualization
这两个有多牛,先看看效果:
Qt Charts:
Qt Data Visualization:
下面多图预警:———————————————————–
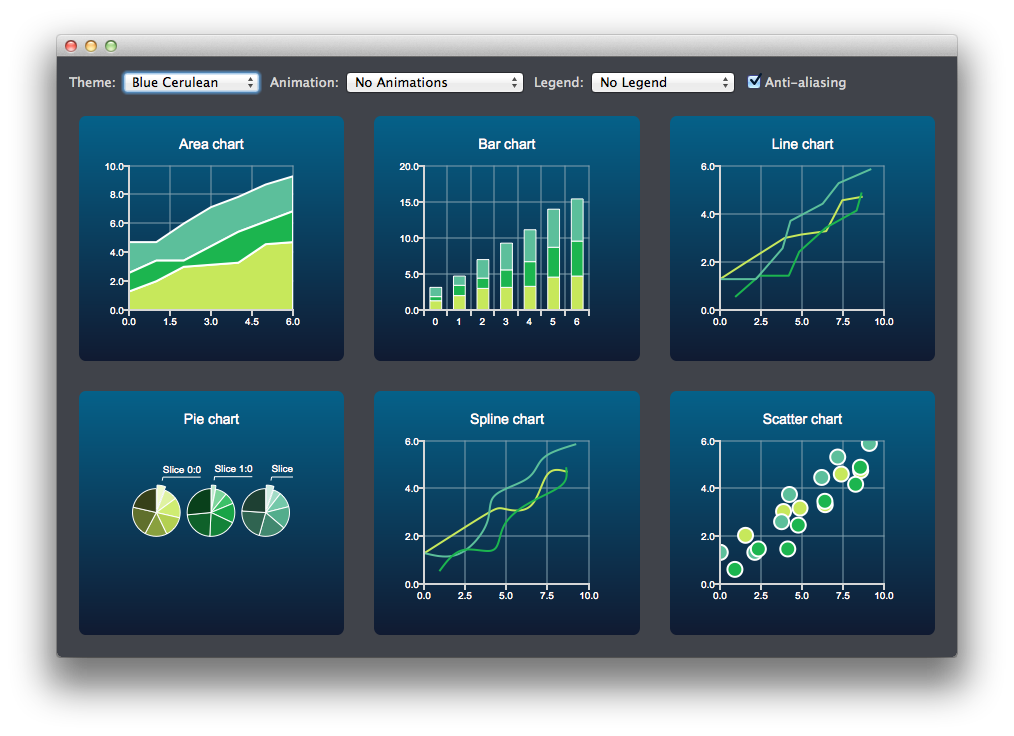
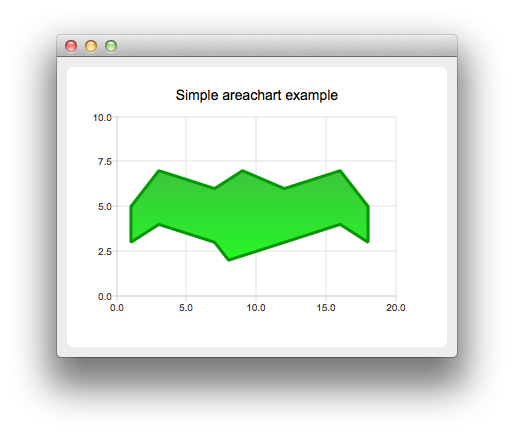
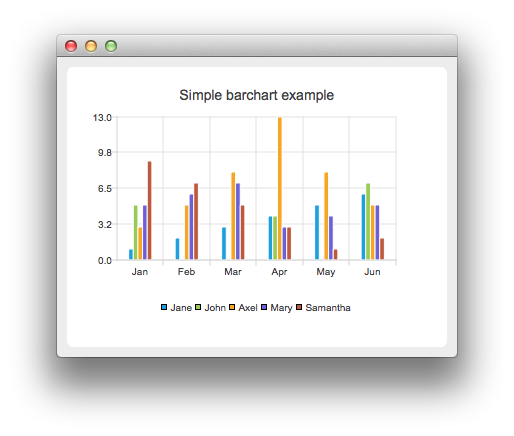
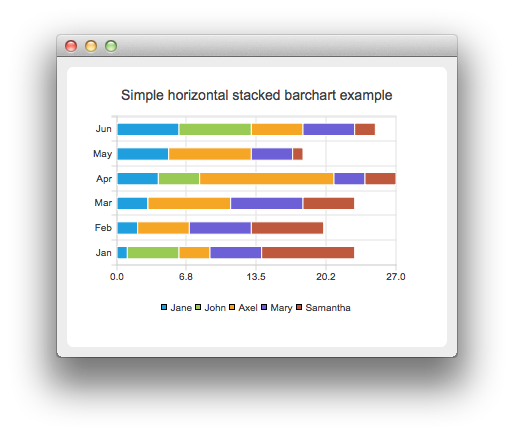
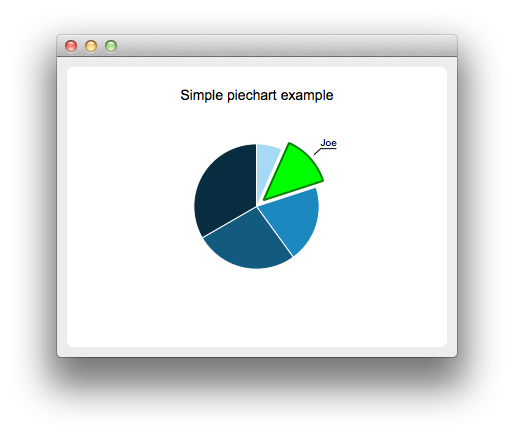
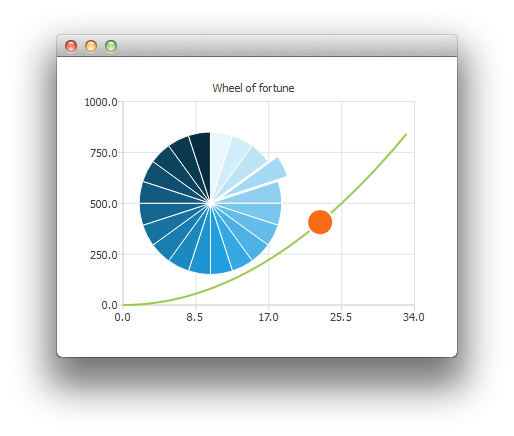
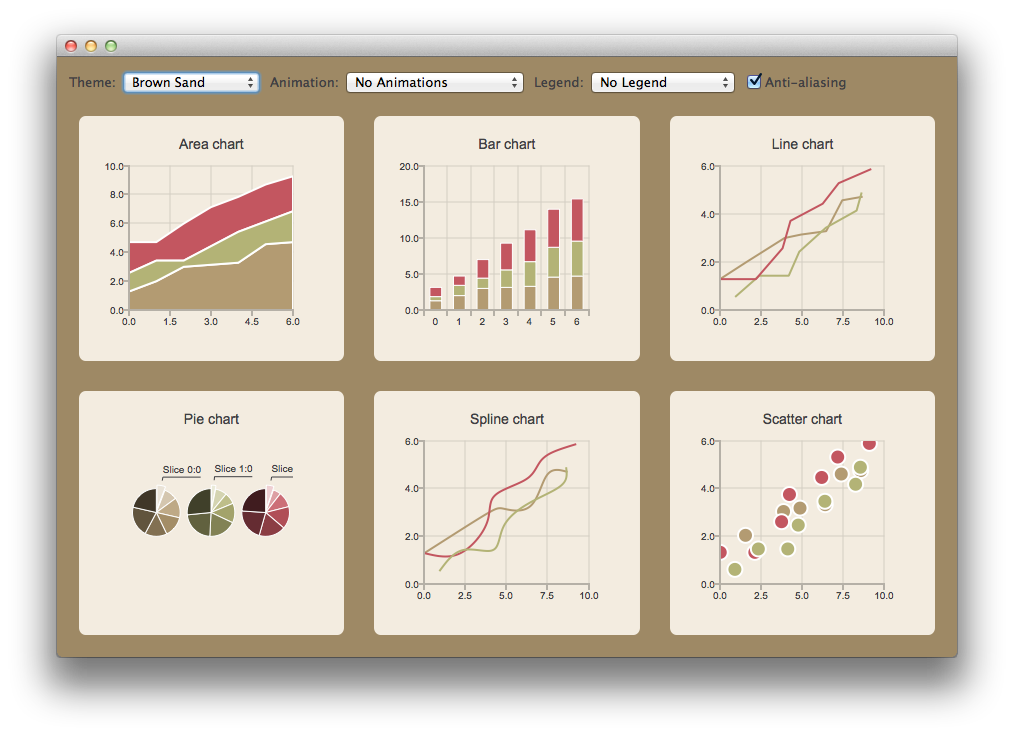
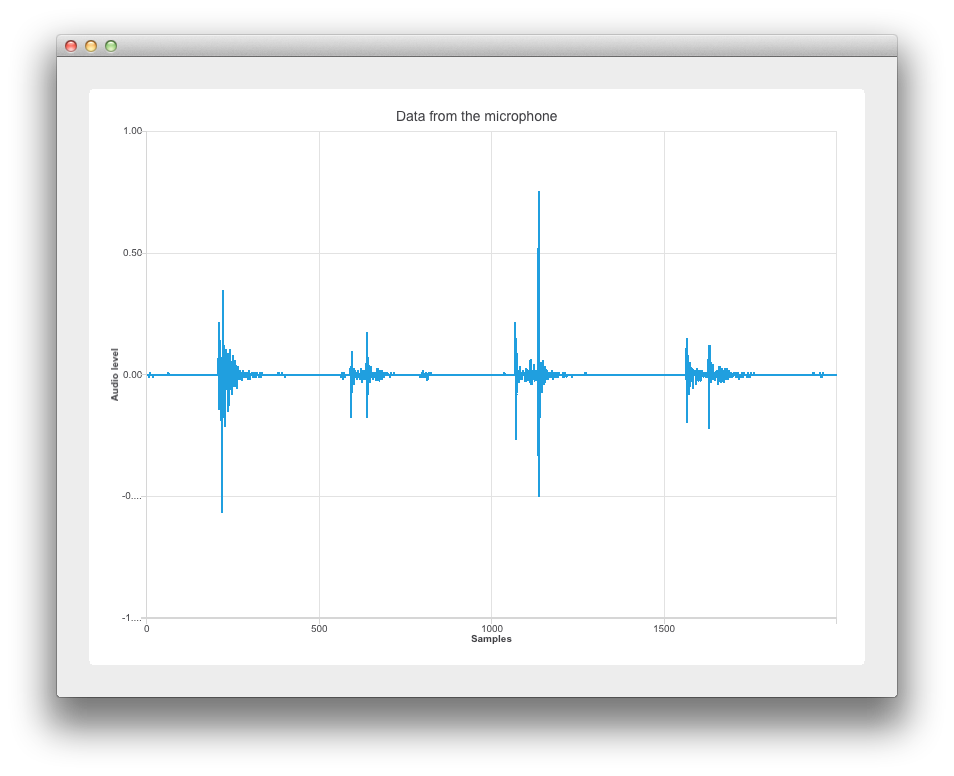
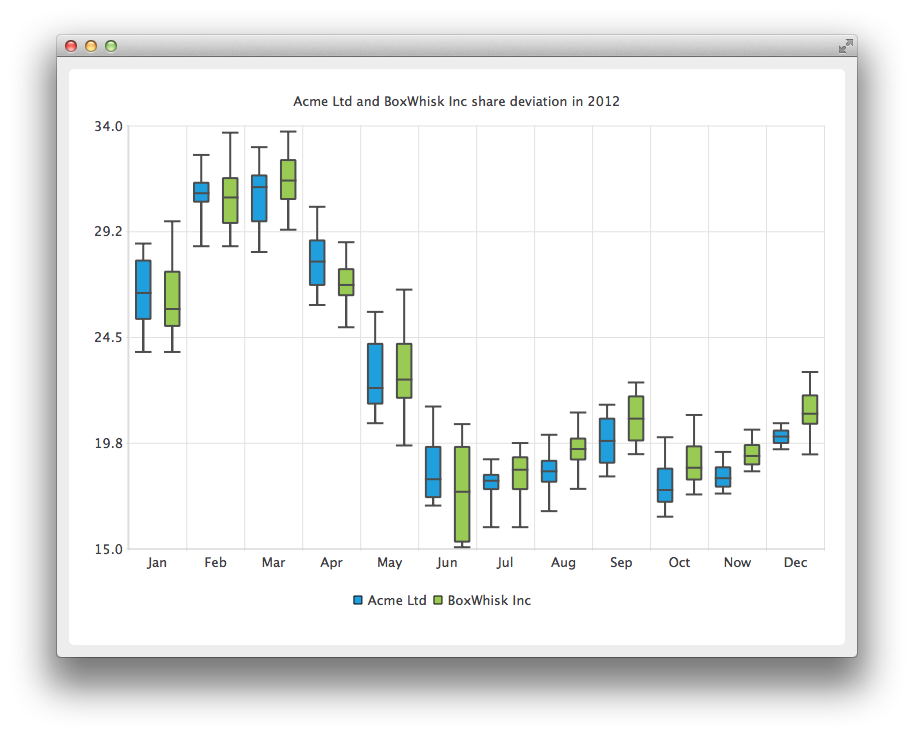
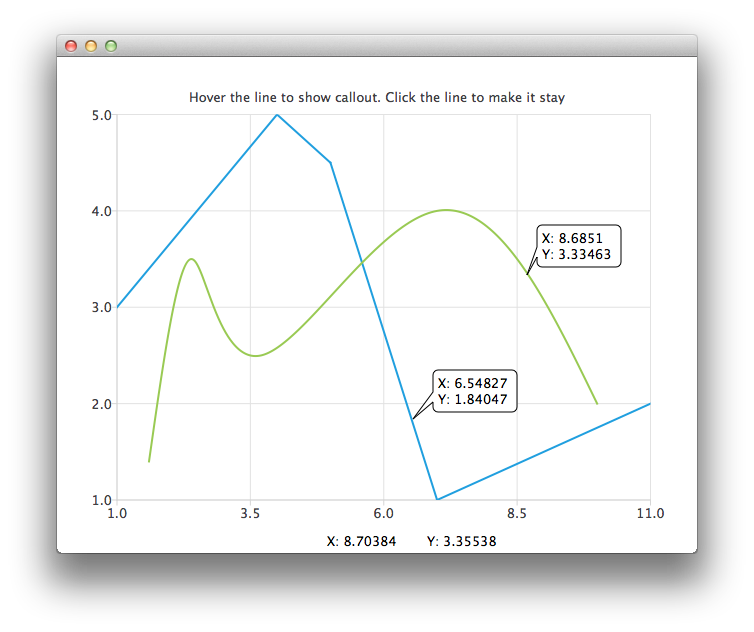
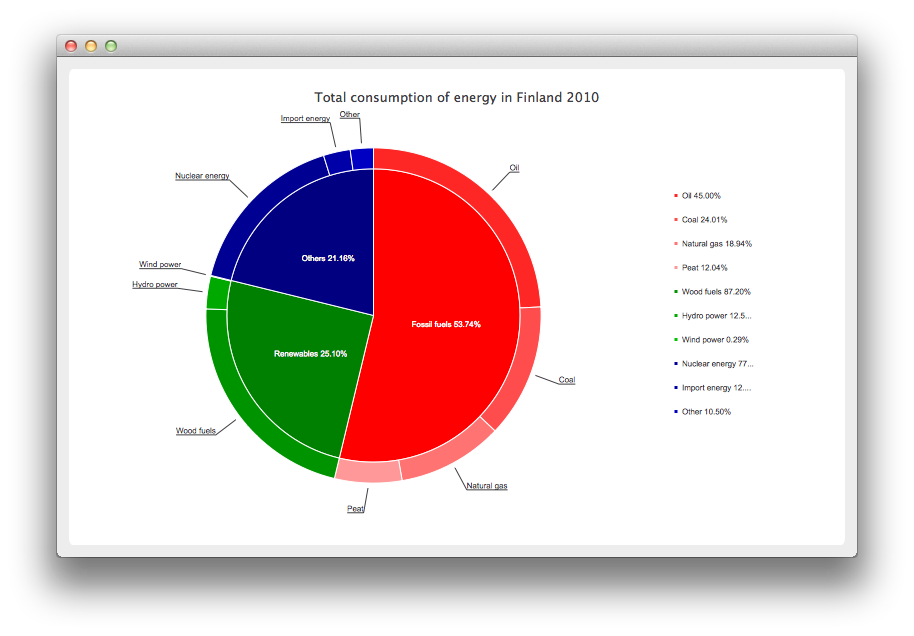
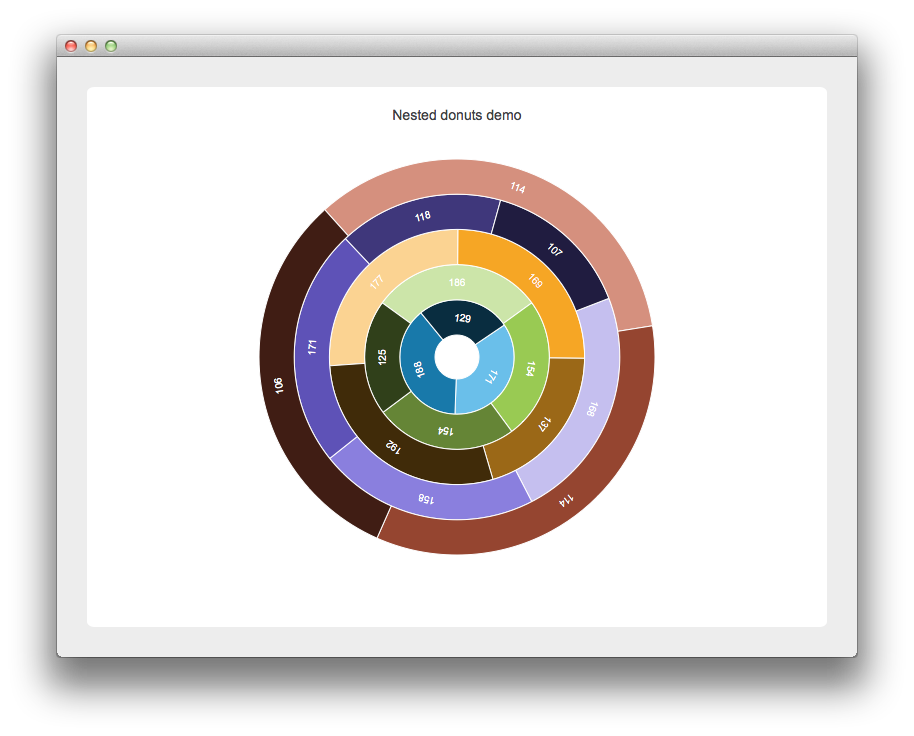
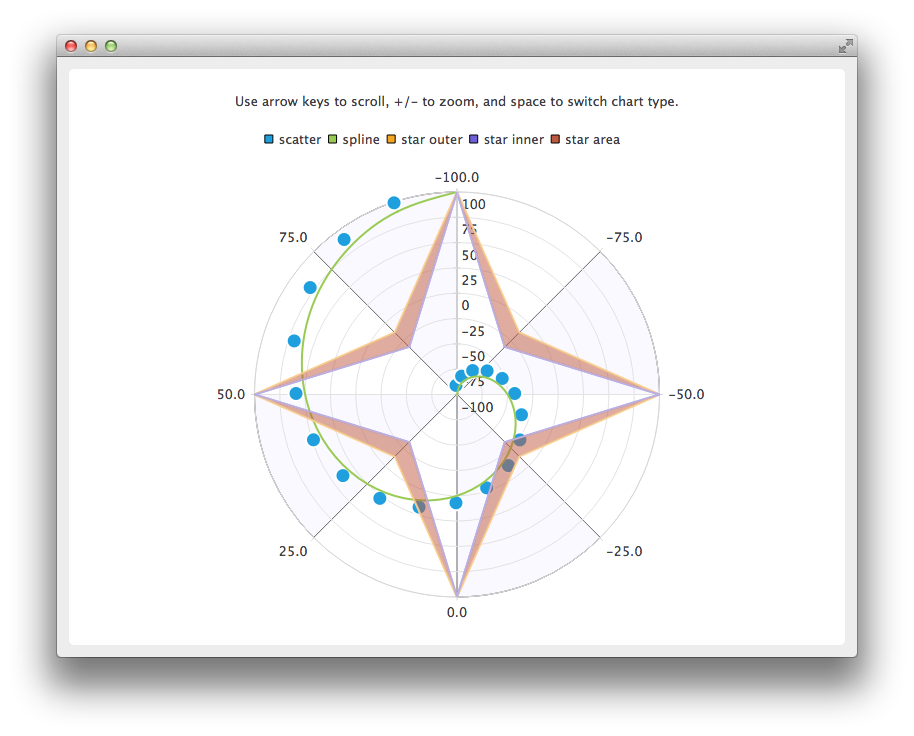
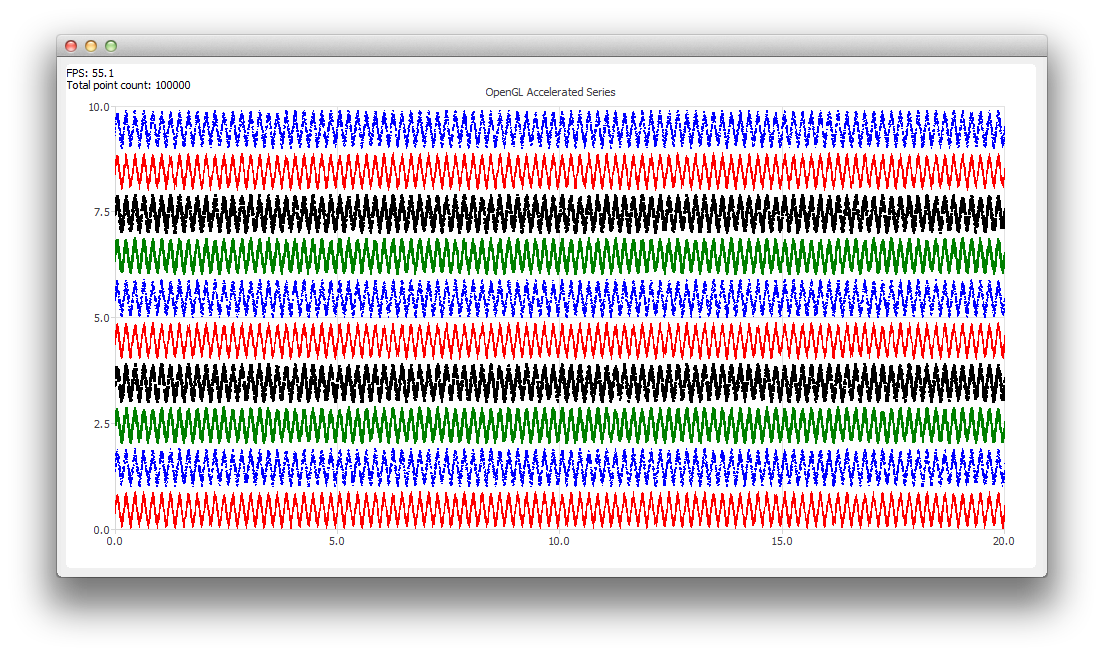
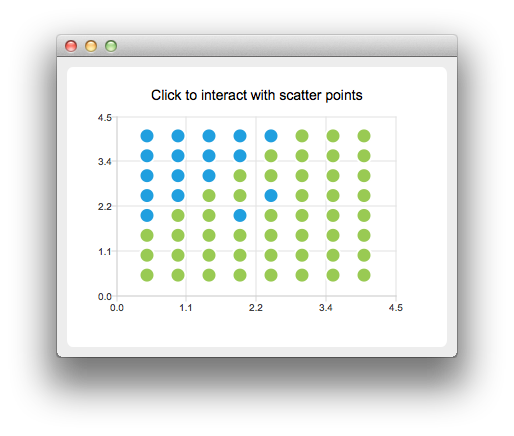
Qt Charts:
有了Qt Charts以后再也不用问如何配置qwt了
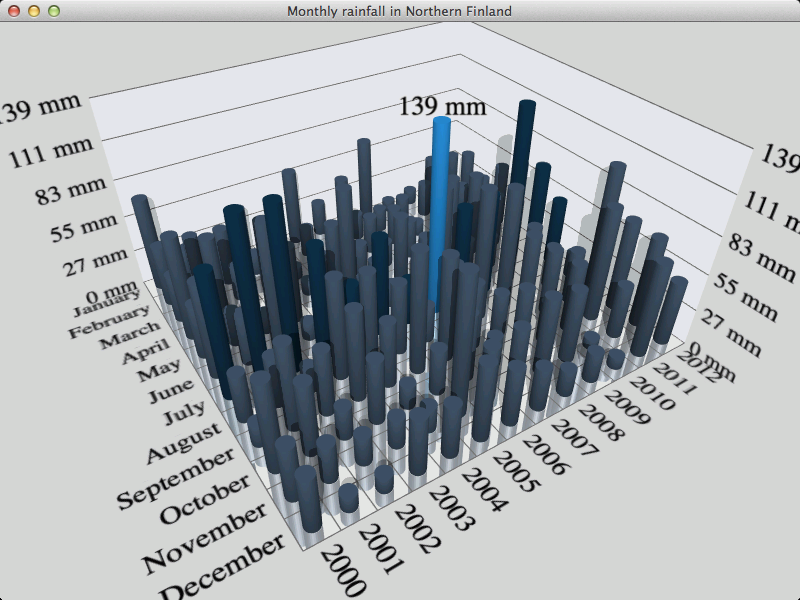
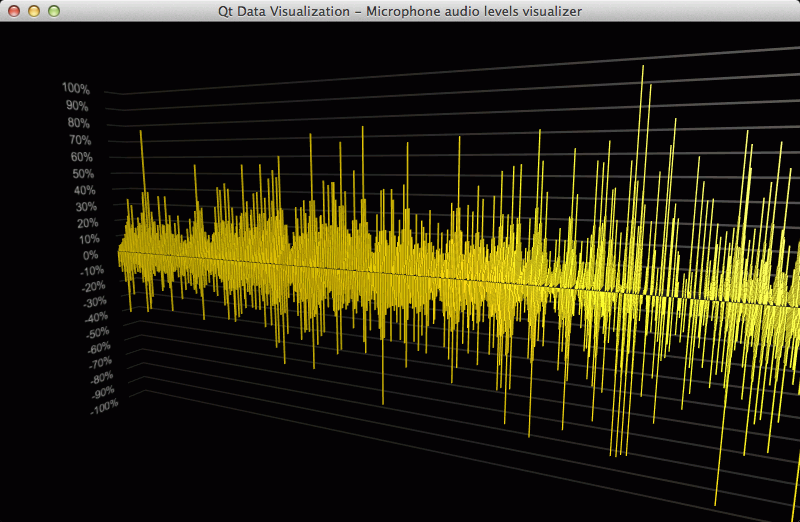
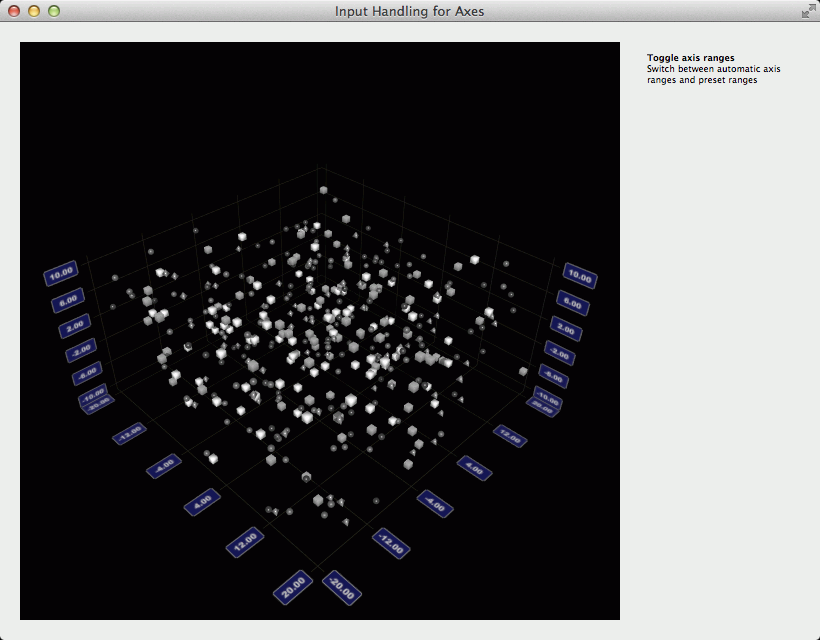
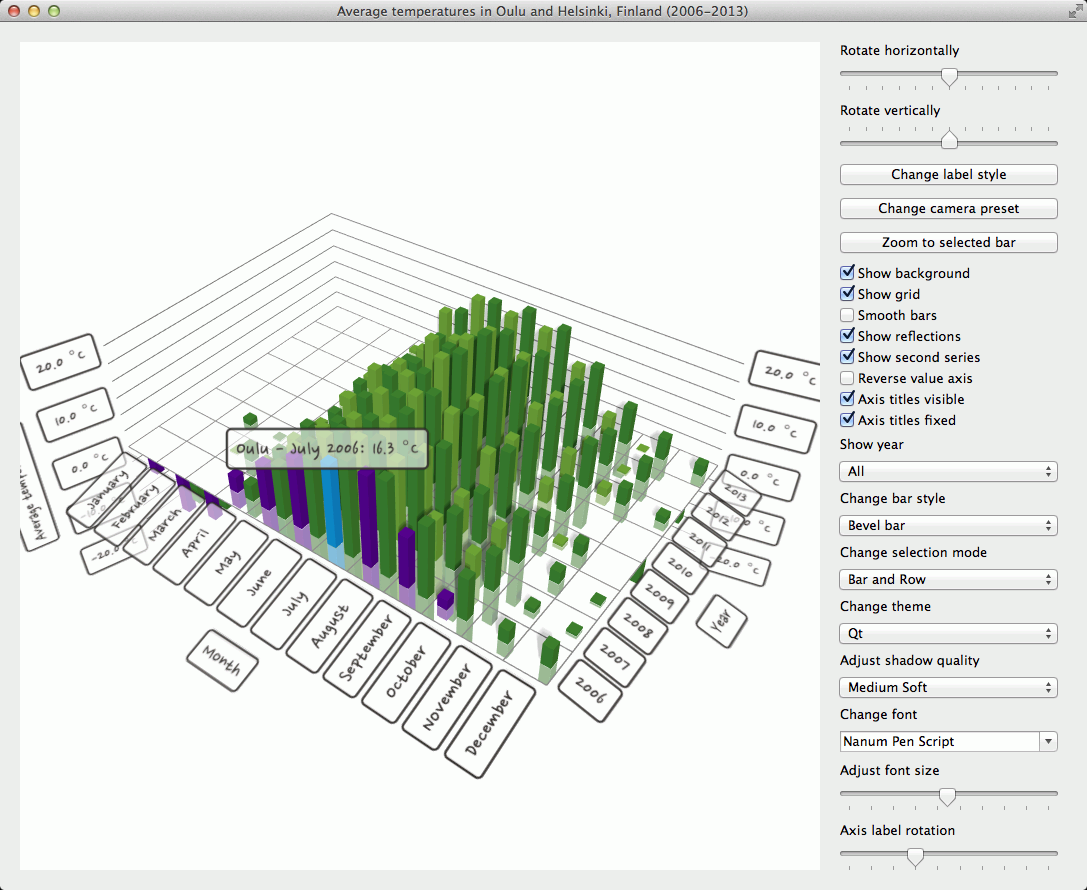
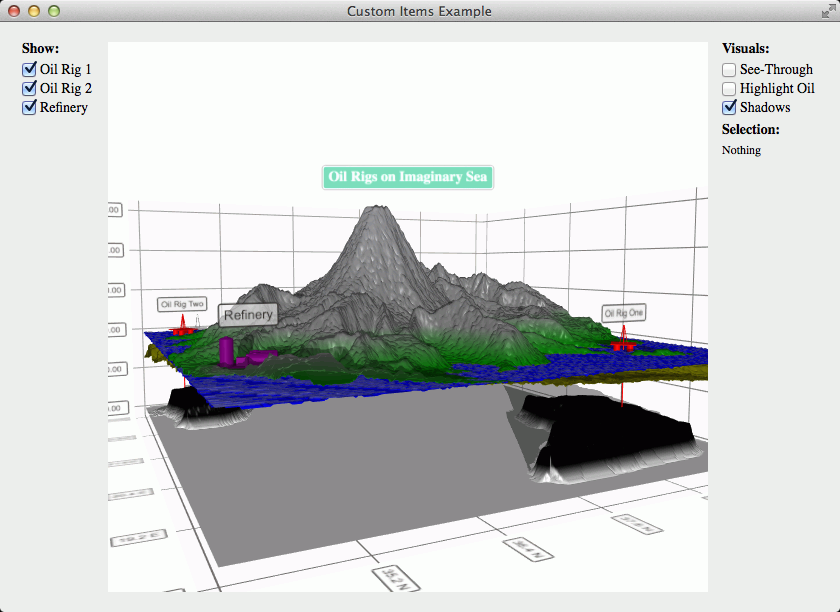
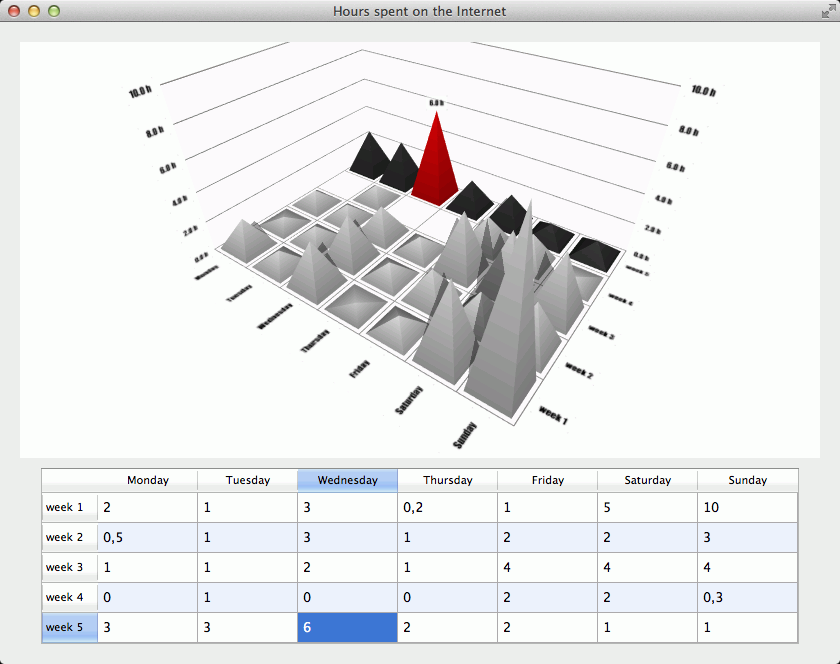
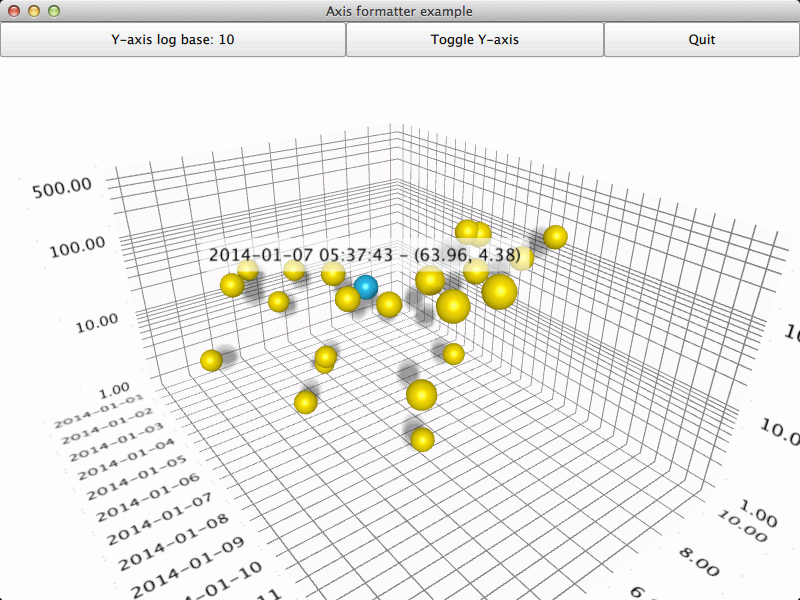
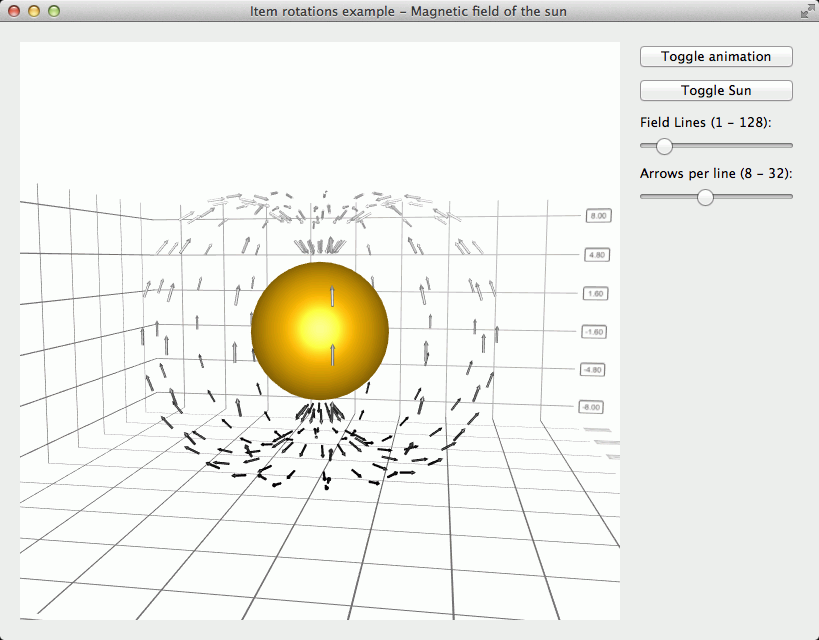
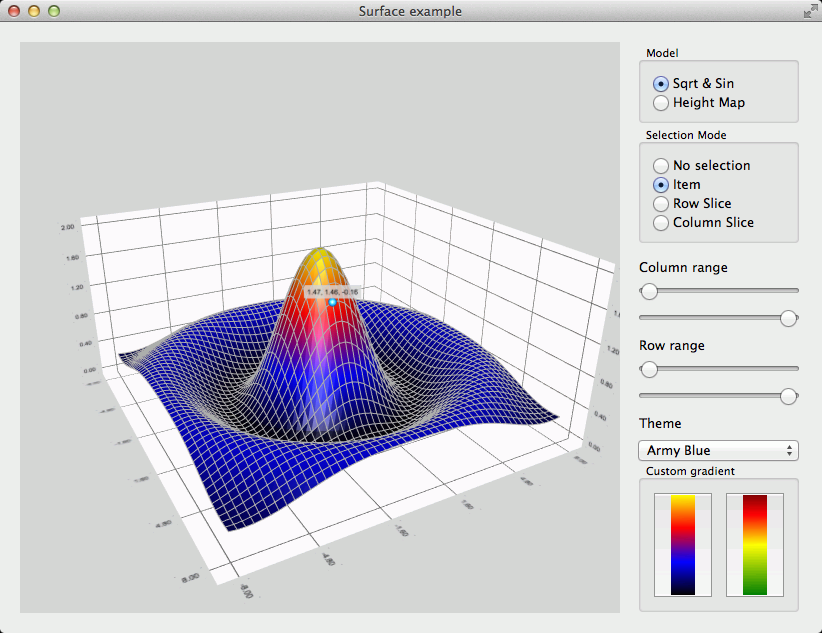
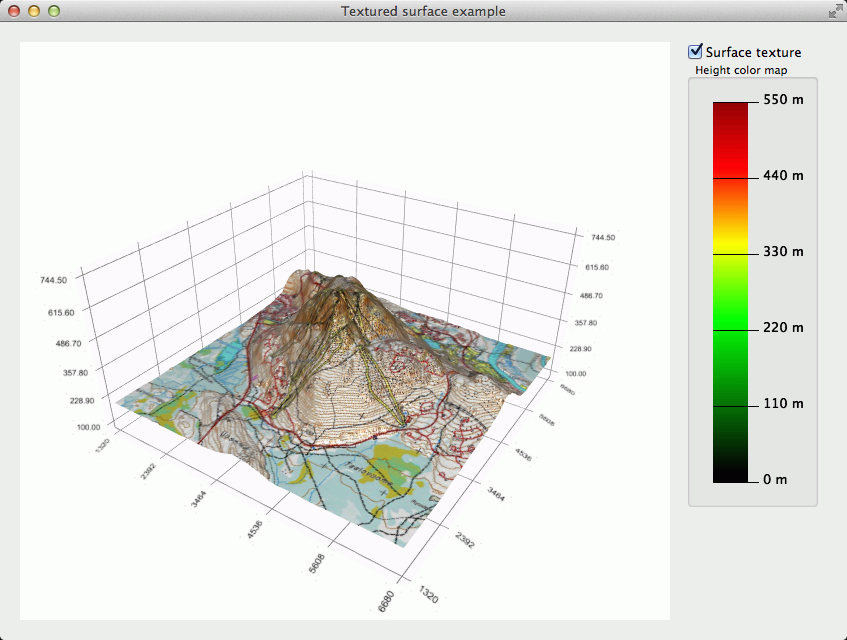
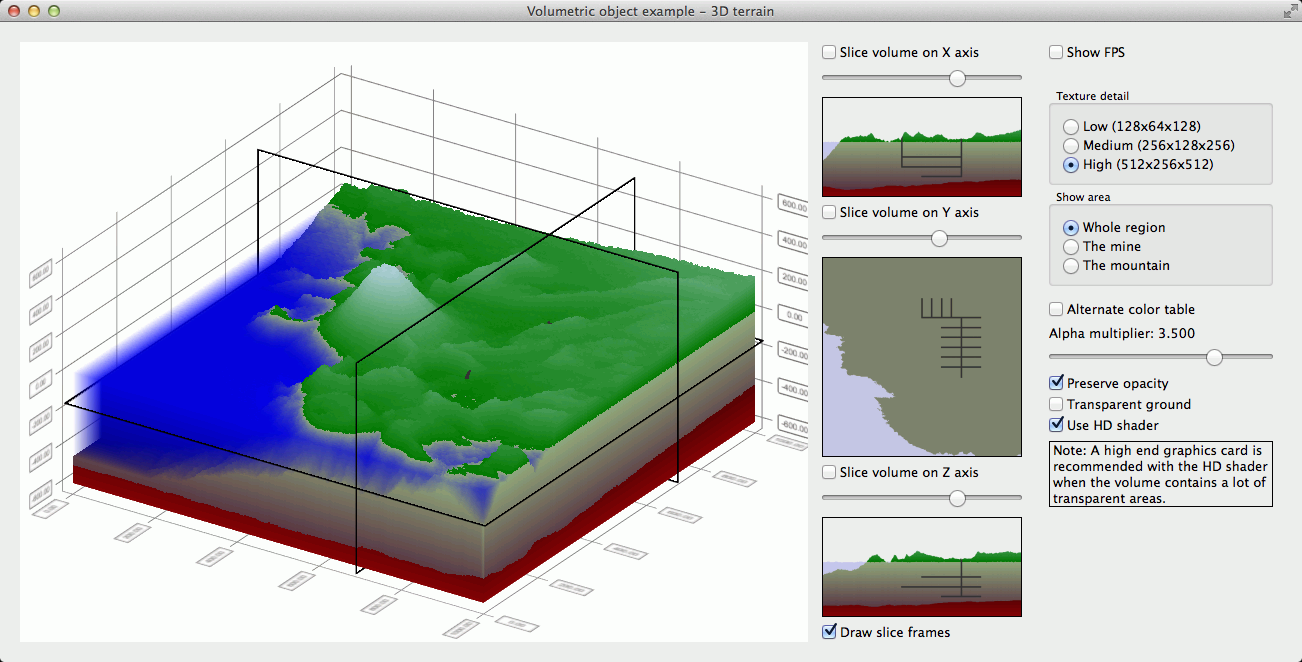
Qt Data Visualization:
上面的QtCharts没能把你惊艳到,那么下面这些呢:
Qt Charts
Previously commercial-only Qt Charts module is now included in Qt under also GPLv3 license for open source users
Qt Data Visualization
Previously commercial-only Qt Data Visualization module is now included in Qt under also GPLv3 license for open source users
Qt Virtual Keyboard
Previously commercial-only Qt Virtual Keyboard module is now included in Qt under also GPLv3 license for open source users
Qt Purchasing
Previously commercial-only Qt Purchasing module is now included in Qt under also LGPLv3 and GPLv3 license for open source users
Qt Quick 2D Renderer
Previously commercial-only Qt Quick 2D Renderer module is now included in Qt under also GPLv3 license for open source users
Qt5.7快来吧!


 322
322

 被折叠的 条评论
为什么被折叠?
被折叠的 条评论
为什么被折叠?
 到【灌水乐园】发言


