Qt Data Visualization 3D可视化

话不多说,先上效果,官方的例子很多,比我这个炫酷的也很多:


因为看了网上的资料,发现很少有人研究QtDataVisualization,所以这里我就来抛砖引玉一下。


1:简介QtDataVisualization

     QtDataVisualization是Qt提供的用于数据三维显示的模块。在Qt 5.7以前只有商业版才有此模块,而从Qt 5.7开始此模块在社区版本里也可以免费使用了。(这里备注一下,如果你发现你的qt里面没有这个模块,那就再装一个Qt 的版本吧,怎么装的就不多说了,这里给一个参考地址:http://c.biancheng.net/view/3851.html)。Data Visualization 用于数据的三维显示,包括,三维柱状图,三维空间散点,三维曲面等。(这里你就会发现空间的东西他给了最基础的,点。对于曲面来说,这个时候你已经可以像MATLAB里面的数据模型一样的用各种数学函数表达式来看到效果了。但是他没有给线,和空间平面)相信到这里你已经看出来了,Qt提供的这个模块并不能和一些专业的三维显示类库相提并论,但是对于一些简单的三维数据显示还是比较实用的,例如一些科学计算结果的三维显示。

      这里再说一下,为什么没有给线和空间的平面呢?首先我们来看一下人家的官方的文档怎么说的,看一下QSurfaceDataProxy(Qt的面数据代理)怎么解释的:

A surface data proxy handles surface related data in rows. For this it provides two auxiliary typedefs: QtDataVisualization::QSurfaceDataArray and QtDataVisualization::QSurfaceDataRow. QSurfaceDataArray is a QList that controls the rows. QSurfaceDataRow is a QVector that contains QSurfaceDataItem objects. For more information about how to feed the data to the proxy, see the sample code in the Q3DSurface documentation.

All rows must have the same number of items.

QSurfaceDataProxy takes ownership of all QSurfaceDataRow objects passed to it, whether directly or in a QSurfaceDataArray container. To use surface data row pointers to directly modify data after adding the array to the proxy, the appropriate signal must be emitted to update the graph.

To make a sensible surface, the x-value of each successive item in all rows must be either ascending or descending throughout the row. Similarly, the z-value of each successive item in all columns must be either ascending or descending throughout the column.(为了形成一个合理的曲面,所有行中每个连续项的x值必须在整行中升序或降序。类似地,所有列中每个连续项的z值必须在整个列中升序或降序。

Note: Currently only surfaces with straight rows and columns are fully supported. Any row with items that do not have the exact same z-value or any column with items that do not have the exact same x-value may get clipped incorrectly if the whole surface does not completely fit within the visible x-axis or z-axis ranges.(注意:目前只有直行和直列的曲面才得到完全支持。如果整个曲面不完全符合可见的x轴或z轴范围,则任何具有不完全相同z值项的行或包含不具有完全相同x值的项的列可能会被错误地剪裁。

Note: Surfaces with less than two rows or columns are not considered valid surfaces and will not be rendered.(注意:少于两行或两列的曲面不被视为有效曲面,因此不会进行渲染。

Note: On some environments, surfaces with a lot of visible vertices may not render, because they exceed the per-draw vertex count supported by the graphics driver. This is mostly an issue on 32-bit and OpenGL ES2 platforms.(注意:在某些环境中,具有大量可见顶点的曲面可能无法渲染,因为它们超出了图形驱动程序支持的每次绘制顶点数。这在32位和opengles2平台上主要是一个问题。

       这里也就能说明问题了!


2:Data Visualization模块概述

      Data Visualization 的三维显示功能主要由3种三维图形类来实现,分别是三维柱状图(Q3DBars),三维空间散点图(Q3DScatter),三维曲面图(Q3DSurface)。这3个类的父类是QAbstract3DGraph,是从QWindow继承而来的,继承关系
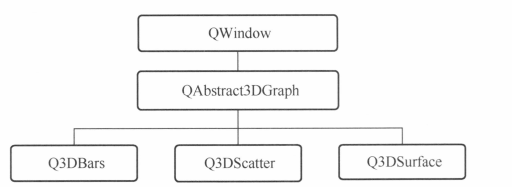
                                                

       Data Visualization Qt Charts 类似,都基于Qt 的图形视图结构,所以一个三维图形也是由图表、序列、坐标轴等元素组成的。Q3DBars、Q3DScatter、Q3DSurface 相当于Qt Charts中的QChart,而每一种三维图形对应一种三维序列,Data Visualization中的3种序列如图


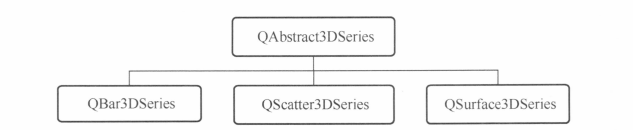
      一种序列类只能用于某种三维图形类,如QScatter3DSeries只能用作三维散点Q3DScatter的序列,而不能用作Q3DBars的序列。再一个图中,可以有多个同类型的序列,如三维柱状图Q3DBars中可以有多个QBar3DSeries序列,用作显示不同的柱状图。

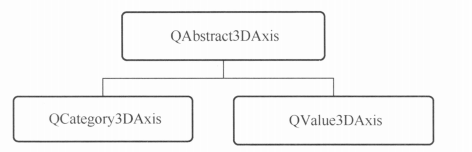
      与QChart有坐标轴类一样,三维图形也有坐标轴类。有两种三维坐标轴类,QValue3DAxis用于数值型坐标轴,QCategory3DAxis用于文字型坐标轴,它们都继承自QAbstract3DAxis


        Data Visualization模块中有数据代理(data proxy)类,数据代理类就是与序列对应,用于存储序列的数据的类。因为三维图形类型不一样,存储数据的结构也不一样,例如三维散点序列QScatter3DSeries存储的是一些三维数据点的坐标,只需要用一维数组或者列表就能存储这些数据,而QSurface3DSeries序列存储的数据点在水平面上是均匀网格分布的,需要二维数组才可以存储相应的数据。为此,对于每一种序列,都有一个数据代理类,他们都继承自QAbstractDataProxy,每一个数据代理类还有一个基于项数据模型的数据代理子类


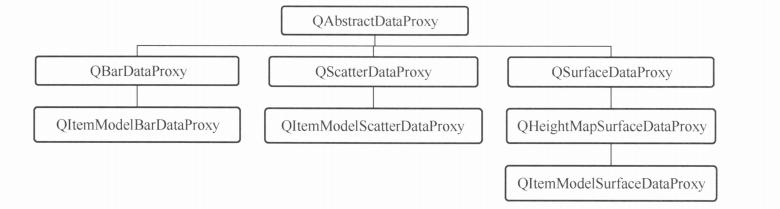
         对于三维曲面序列QSurface3DSeries,还有一个专门用于显示地图高程数据的数据代理类QHeightMapSurfaceDataProxy,可以将一个图片表示的高程数据显示为三维的曲面。用户也可以根据需要从QAbstractDataProxy继承,定义自己的数据代理类。

         要从项目中使用Data Visualization模块,需要再项目配置文件中(.pro文件)添加下面的语句:

             Qt += datavisualization

         在使用Data Visualization模块中的类的头文件或源程序文件中,还需要加下面两种语句:

             #include <QtDataVisualization>

             using namespace QtDataVisualization;

  • 7
    点赞
  • 17
    收藏
    觉得还不错? 一键收藏
  • 打赏
    打赏
  • 8
    评论
--------------------------- Qt Data Visualization 5.7.0 --------------------------- Qt Data Visualization module provides multiple graph types to visualize data in 3D space both with C++ and Qt Quick 2. System Requirements =================== - Qt 5.2.1 or newer - OpenGL 2.1 or newer (recommended) or OpenGL ES2 (reduced feature set) - Manipulating Qt Data Visualization graphs with QML Designer requires Qt Creator 3.3 or newer Building ======== Configure the project with qmake: qmake After running qmake, build the project with make: (Linux) make (Windows with MinGw) mingw32-make (Windows with Visual Studio) nmake (OS X) make The above generates the default makefiles for your configuration, which is typically the release build if you are using precompiled binary Qt distribution. To build both debug and release, or one specifically, use one of the following qmake lines instead. For debug builds: qmake CONFIG+=debug make or qmake CONFIG+=debug_and_release make debug For release builds: qmake CONFIG+=release make or qmake CONFIG+=debug_and_release make release For both builds (Windows/OS X only): qmake CONFIG+="debug_and_release build_all" make After building, install the module to your Qt directory: make install If you want to uninstall the module: make uninstall Building as a statically linked library ======================================= The same as above applies, you will just have to add static to the CONFIG: qmake CONFIG+=static Documentation ============= The documentation can be generated with: make docs The documentation is generated into the doc folder under the build folder. Both Qt Assistant (qtdatavisualization.qch) and in HTML format (qtdatavisualization subfolder) documentation is generated. Please refer to the generated documentation for more information: doc/qtdatavisualization/qtdatavisualization-index.html Known Issues ============ - Some platforms like Android and WinRT cannot handle multiple native windows properly, so only the Qt Quick 2 versions of graphs are available in practice for those platforms. - Shadows are not supported with OpenGL ES2 (including Angle builds in Windows). - Anti-aliasing doesn't work with OpenGL ES2 (including Angle builds in Windows). - QCustom3DVolume items are not supported with OpenGL ES2 (including Angle builds in Windows). - Surfaces with non-straight rows and columns do not always render properly. - Q3DLight class (and Light3D QML item) are currently not usable for anything. - Changing most of Q3DScene properties affecting subviewports currently has no effect. - Widget based examples layout incorrectly in iOS. - Reparenting a graph to an item in another QQuickWindow is not supported. - Android builds of QML applications importing QtDataVisualization also require "QT += datavisualization" in the pro file. This is because Qt Data Visualization QML plugin has a dependency to Qt Data Visualization C++ library, which Qt Creator doesn't automatically add to the deployment package. - Only OpenGL ES2 emulation is available for software renderer (that is, when using QCoreApplication::setAttribute(Qt::AA_UseSoftwareOpenGL))
### 回答1: Qt Data VisualizationQt 数据可视化)是 Qt 框架提供的一个模块,用于可视化和呈现三维数据。该模块包括许多可定制的组件,如散点图、柱状图、表面图、网格图等等。开发人员可以使用 Qt Data Visualization 模块来创建交互式的、动态的和高度可定制化的三维数据可视化应用程序。 Qt Data Visualization 模块使用 QML 语言进行编写,并且具有非常丰富的 API 和文档支持,可帮助开发人员快速上手。此外,该模块还支持 OpenGL 渲染,因此能够在不同的平台上实现高性能的三维数据可视化。 总之,如果您需要为您的数据创建一个现代化的、美观的三维可视化界面,Qt Data Visualization 模块是一个不错的选择。 ### 回答2: QT Data Visualization是一种基于QT框架的数据可视化工具。它可以帮助用户快速创建各种图表和数据可视化界面,方便用户对数据进行分析、呈现和交互。QT Data Visualization包含了多种数据可视化组件,包括图表、3D物体、颜色条等,可以支持用户自定义数据的展示方式。下面我们将从以下几个方面详细介绍QT Data Visualization: 1. QT Data Visualization的架构 QT Data Visualization的架构采用了MVC(Model-View-Controller)模式,即将用户数据模型、数据展示和界面控制分别独立处理,使得这些角色之间的职责清晰,方便扩展和维护。QT Data Visualization的主要组成部分包括:数据模型、数据可视化模型、视图组件、控件、交互组件、颜色条等。 2. QT Data Visualization的主要功能特点 QT Data Visualization支持多种数据可视化方式,包括线状图、柱状图、散点图、雷达图、3D表面图、3D条形图等,并且每种图表都可以支持自定义,满足用户个性化需求。同时,QT Data Visualization还具有多种数据交互方式,如鼠标拖动、鼠标滚轮、键盘、手势等,便于用户控制数据的展示和处理。 3. QT Data Visualization的应用范围 QT Data Visualization广泛应用于数据分析、科学可视化、工程可视化等领域,如数据仪表盘、商业图表展示、天气预报、股市行情分析、金融风险分析、医学图像处理等。 总之,QT Data Visualization是一款功能强大、易用灵活的数据可视化工具,可以大大简化用户的数据处理过程,提高数据分析效率和精度。 ### 回答3: Qt Data Visualization是一个用于创建3D数据可视化图表和图形的工具包。它是Qt的一个QT Charts模块的扩展,其目标是向用户提供一套灵活、强大和易于使用的API,支持数据的直观可视化Qt Data Visualization不仅可以在桌面和移动设备上使用,而且可嵌入Web浏览器中,实现在Web上的数据可视化Qt Data Visualization提供了多种图表类型,包括柱状图、折线图、面图、等高线图、散点图、气泡图以及3D表面图等。用户可以自定义颜色、标签、轴、图例等元素,以及对图表进行交互操作和数据项过滤等操作。Qt Data Visualization使用OpenGL进行渲染,支持高分辨率、平移、旋转和缩放等操作,让用户可以更好的了解数据之间的关系和趋势。 与Qt的其他特性相结合,Qt Data Visualization可以让开发者快速构建出个性化的图表和方便用户操作的工具,这将极大的推动数字化转型和数据科学的发展。通过Qt Data Visualization,开发者可以将复杂数据以图形化的方式进行展示,从而提供更清晰直观的数据分析和决策支持,促进业务优化和增长。

“相关推荐”对你有帮助么?

  • 非常没帮助
  • 没帮助
  • 一般
  • 有帮助
  • 非常有帮助
提交
评论 8
添加红包

请填写红包祝福语或标题

红包个数最小为10个

红包金额最低5元

当前余额3.43前往充值 >
需支付:10.00
成就一亿技术人!
领取后你会自动成为博主和红包主的粉丝 规则
hope_wisdom
发出的红包

打赏作者

搁浅的渔

创作不易,多多支持

¥1 ¥2 ¥4 ¥6 ¥10 ¥20
扫码支付:¥1
获取中
扫码支付

您的余额不足,请更换扫码支付或充值

打赏作者

实付
使用余额支付
点击重新获取
扫码支付
钱包余额 0

抵扣说明:

1.余额是钱包充值的虚拟货币,按照1:1的比例进行支付金额的抵扣。
2.余额无法直接购买下载,可以购买VIP、付费专栏及课程。

余额充值