


先不说多的,上图看效果:
做到这个的 图形我还是用了很很长时间的,说一说。
1.0版本
我们老总说了,他就是看中了这个图,让我们去自己做一下,我看了看文档,最新的echarts的文档,下了一个echarts.min.js。做了一个版本,代码如下:
`
ECharts
<!--
    文档:

    服务器传输数据的格式为 {
                            "nodes":[//节点
                                    {
                                        "name":"节点1",//名称
                                        "attributes": {},
                                        "id": "node1",//id
                                        "size": 40,//圆的大小
                                        "category" :1//类别
                                    }
                                ],
                            "links":[//连接
                                    {
                                        "source": "node1",//源点
                                        "target": "node2"//目标
                                    }
                                ]

                            }

    nodes 属性中的category 是类别,就是类目的意思,将不同的树给分开,表示不同的颜色。
-->


<!-- 为ECharts准备一个具备大小(宽高)的Dom -->
<div id="main" style="width: 600px;height:400px;"></div>

<div id = "div1"></div>
<script type="text/javascript">


var graph = {//数据
        "nodes": [//节点
            {

                "name":"节点1",//名称
                "attributes": {},
                "id": "node1",//id
                "size": 40,//圆的大小
                "url":"www.baidu.com",
                "category" :1//类别
            },
            {

                "name":"节点2",
                "attributes": {},
                "id": "node2",
                "size": 10,
                "category" :1//类别
            },
            {

                "name":"节点3",
                "attributes": {},
                "id": "node3",
                "size": 30,
                "category" :0//类别
            },
            {

                "name":"节点4",
                "attributes": {},
                "id": "node4",
                "size": 20,
                "category" :0//类别
            },
            {

                "name":"节点5",
                "attributes": {},
                "id": "node5",
                "size": 10,
                "category" :0//类别
            },
            {

                "name":"节点6",
                "attributes": {},
                "id": "node6",
                "size": 20,
                "category" :1//类别
            },
            {

                "name":"节点7",
                "attributes": {},
                "id": "node7",
                "size": 20,
                "category" :1//类别
            },
            {

                "name":"节点8",
                "attributes": {},
                "id": "node8",
                "size": 20,
                "category" :1//类别
            },
            {

                "name":"节点9",
                "attributes": {},
                "id": "node9",
                "size": 20,
                "category" :1//类别
            },
            {

                "name":"节点10",
                "attributes": {},
                "id": "node10",
                "size": 20,
                "category" :0//类别
            },
            {

                "name":"节点11",
                "attributes": {},
                "id": "node11",
                "size": 20,
                "category" :2//类别
            },
            {

                "name":"节点12",
                "attributes": {},
                "id": "node12",
                "size": 20,
                "category" :2//类别
            }

        ],
        "links": [//连接
            {
                "source": "node1",//源点
                "target": "node2"//目标
            },
            {
                "source": "node3",
                "target": "node4"
            },
            {
                "source": "node4",
                "target": "node5"
            },
            {
                "source": "node1",
                "target": "node6"
            },
            {
                "source": "node1",
                "target": "node7"
            },
            {
                "source": "node7",
                "target": "node8"
            },
            {
                "source": "node7",
                "target": "node9"
            },
            {
                "source": "node4",
                "target": "node10"
            },
            {
                "source": "node11",
                "target": "node12"
            }

        ]
    };

// 基于准备好的dom,初始化echarts实例
var myChart = echarts.init(document.getElementById('main'));
myChart.hideLoading();
var categories = [];
for (var i = 0; i < 3; i++) {
    categories[i] = {
        name: '类型' + i
    };
}
graph.nodes.forEach(function (node) {
    node.itemStyle = null;//
    node.symbolSize = node.size;//强制指定节点的大小
    // Use random x, y
    node.x = node.y = null;
    node.draggable = true;

});
option = {
    title: {
        text: 'demo',//文本标题
        subtext: 'Default layout',//副标题
        top: 'bottom',//上下位置
        left: 'right'//左右位置
    },
    tooltip: {
        formatter: function (params, ticket, callback) {//回调函数
             var str = appendPath(graph.nodes[params.dataIndex].id);
             document.getElementById("div1").innerHTML = str;
             return str;//
         }
    },
    legend: [{
        // selectedMode: 'single',
        data: categories.map(function (a) {//显示策略
            return a.name;
        })
    }],
    animation: false,//是否开启动画
    series : [
        {
            name: '',
            type: 'graph',
            layout: 'force',
            data: graph.nodes,//节点数据
            links: graph.links,//节点边数据
            categories: categories,//策略
            roam: true,//是否开启滚轮缩放和拖拽漫游,默认为false(关闭),其他有效输入为true(开启),'scale'(仅开启滚轮缩放),'move'(仅开启拖拽漫游)
            label: {
                normal: {
                    show:'false',
                    position: 'right'
                }
            },
            slient:false,//是否响应点击事件,为false的时候就是响应
            force: {
                repulsion: 100
            }
        }
    ]
};


myChart.setOption(option);


/**
    拼接路径
 */
function appendPath(id){
    var str = id;
    var links = graph.links;
    var i = 0;
    var map = {};
    for( i = 0 ; i < links.length; i++){
        map[links[i].target] = links[i].source;
    }
    while(true){
        if(map[id] == undefined){
            break;
        }
        str = map[id]  +"->" + str;
        id = map[id] ;
    }
    return str;
}

</script>
`
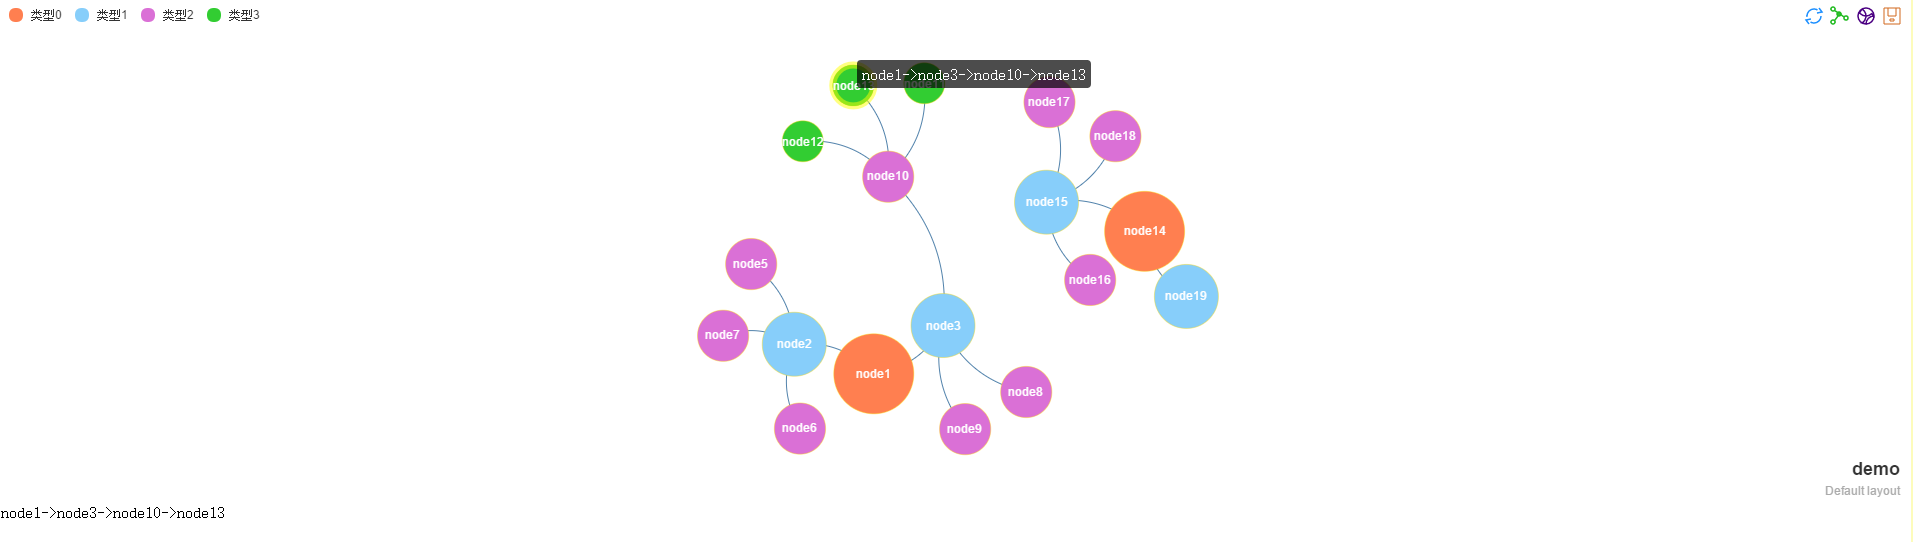
效果图:
就是放上去,有整体的路径进行选择,弄了半天,最后是看文档写完的。
2.0 单击事件的添加
我们老总看了之后,说了一句我要点这个节点进行跳转啊,这个需求要完成。
然后我就开始看代码,发现这个js,实现不了,在github 上git了echarts的文件,研究了一下。成功了。
<!DOCTYPE html>
<html lang="en">
<head>
<meta charset="utf-8">
<title>ECharts</title>
<!-- 文档
传过来的数据:
{
nodes:{
"name":"node1",//名称
"value": 40,//圆的大小
"category" :1//类别
},
links:{
"source": "node1",//源点
"weight" : 1,//权重
"target": "node2"//目标
}
}
点击事件 例子为 node1
-->
</head>
<body>
<!--Step:1 Prepare a dom for ECharts which (must) has size (width & hight)-->
<!--Step:1 为ECharts准备一个具备大小(宽高)的Dom-->
<div id="main" style="height:500px;border:1px "></div>
<div id = "div1"></div>
<!--Step:2 Import echarts.js-->
<!--Step:2 引入echarts.js-->
<script src="js/echarts.js"></script>
<script type="text/javascript">
var tree = {
"name":"node1",//名称
"id": "node1",//id
"url":"http://www.baidu.com",
"children":[
{
"name":"node2",//名称
"id": "node2",//id
"url":"http://www.baidu.com",
"children":[
{
"name":"node5",//名称
"id": "node5",//id
"url":"http://www.baidu.com",
},{
"name":"node6",//名称
"id": "node6",//id
"url":"http://www.baidu.com",
},{
"name":"node7",//名称
"id": "node7",//id
"url":"http://www.baidu.com",
}
]
},{
"name":"node3",//名称
"id": "node3",//id
"url":"http://www.baidu.com",
"children":[
{
"name":"node8",//名称
"id": "node8",//id
"url":"http://www.baidu.com",
},{
"name":"node9",//名称
"id": "node9",//id
"url":"http://www.baidu.com",
},{
"name":"node10",//名称
"id": "node10",//id
"url":"http://www.baidu.com",
"children":[
{
"name":"node11",//名称
"id": "node11",//id
"url":"http://www.baidu.com",
},{
"name":"node12",//名称
"id": "node12",//id
"url":"http://www.baidu.com",
},{
"name":"node13",//名称
"id": "node13",//id
"url":"http://www.baidu.com",
}
]
}
]
},{
"name":"node4",//名称
"id": "node4",//id
"url":"http://www.baidu.com",
}
]
}
//定义结构
var graph ={
nodes:[],
links:[]
} ;
//树的深度
dept = 0;
//转化
function decodeTree(myNode,num){
var node = {
"name":myNode.name,
"id":myNode.id,
"url":myNode.url,
"category":num,
"symbolSize": 40 - num * 8
}
graph.nodes.push(node);
if(myNode.children == undefined){
return;
}
var len = myNode.children.length;
num++;
if(num > dept){
dept = num;
}
for (var i = 0; i < len; i++) {
var link = {
"source": myNode.name,
"weight" : 1,
"target": myNode.children[i].name
}
graph.links.push(link);
decodeTree(myNode.children[i],num);
};
}
decodeTree(tree,0);
//类型的确定
var categories = [];
var categorieNames = [];
for (var i = 0; i < dept+1; i++) {
categories[i] = {
name: '类型' + i
};
categorieNames[i] = '类型' + i;
}
// Step:3 conifg ECharts's path, link to echarts.js from current page.
// Step:3 为模块加载器配置echarts的路径,从当前页面链接到echarts.js,定义所需图表路径
require.config({
paths: {
echarts: './js'
}
});
// Step:4 require echarts and use it in the callback.
// Step:4 动态加载echarts然后在回调函数中开始使用,注意保持按需加载结构定义图表路径
require([
'echarts', 'echarts/chart/force' // 使用柱状图就加载bar模块,按需加载
], function(ec) {
// 基于准备好的dom,初始化echarts图表
var myChart = ec.init(document.getElementById('main'));
// 添加点击事件
var ecConfig = require('echarts/config');
myChart.on(ecConfig.EVENT.CLICK, eConsole);
var option = {
title: {
text: 'demo',//文本标题
subtext: 'Default layout',//副标题
x:'right',
y:'bottom'
},
tooltip : {
formatter: function (params, ticket, callback) {//回调函数
var str = appendPath(graph.nodes[params.dataIndex].id);
document.getElementById("div1").innerHTML = str;
return str;//
}
},
toolbox : {
show : true, //是否显示策略
feature : {
restore : {show: true},
magicType: {show: true, type: ['force', 'chord']},
saveAsImage : {show: true}
}
},
legend: {
x: 'left',
data:categorieNames
},
series : [ {
type : 'force',
name : "关系",
ribbonType : false,
clickable : true,
draggable : true,
categories :categories,
itemStyle : {
normal : {
label : {
show:true
},
nodeStyle : {
brushType : 'both',
borderColor : 'rgba(255,215,0,0.4)',
borderWidth : 1
},
linkStyle : {
type : 'curve'
}
},
},
useWorker : false,
minRadius : 15,
maxRadius : 25,
gravity : 1.1,
scaling : 1.1,
roam : false,
nodes:graph.nodes,
links:graph.links
} ]
};
// 为echarts对象加载数据
myChart.setOption(option);
});
/**
点击事件处理
*/
function eConsole(param) {
if (typeof param.seriesIndex == 'undefined') {
return;
}
if (param.type == 'click') {
//param.dataIndex 得到节点的index
window.location.href = graph.nodes[param.dataIndex].url;
}
}
/**
拼接路径
*/
function appendPath(id){
var str = id;
var links = graph.links;
var i = 0;
var map = {};
for( i = 0 ; i < links.length; i++){
map[links[i].target] = links[i].source;
}
while(true){
if(map[id] == undefined){
break;
}
str = map[id] +"->" + str;
id = map[id] ;
}
return str;
}
</script>
</body>
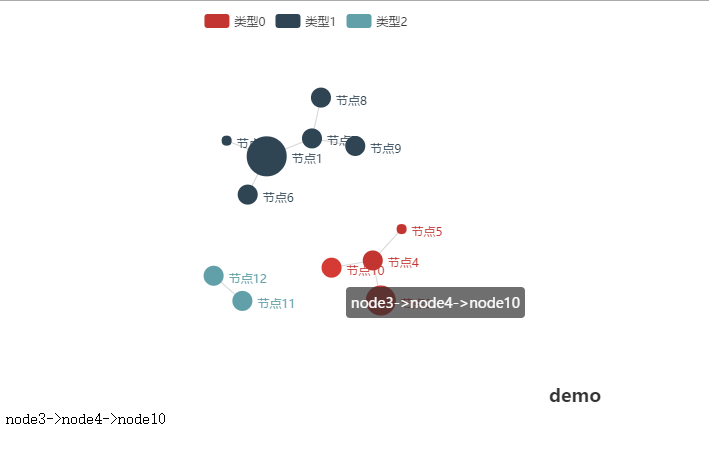
</html>效果图: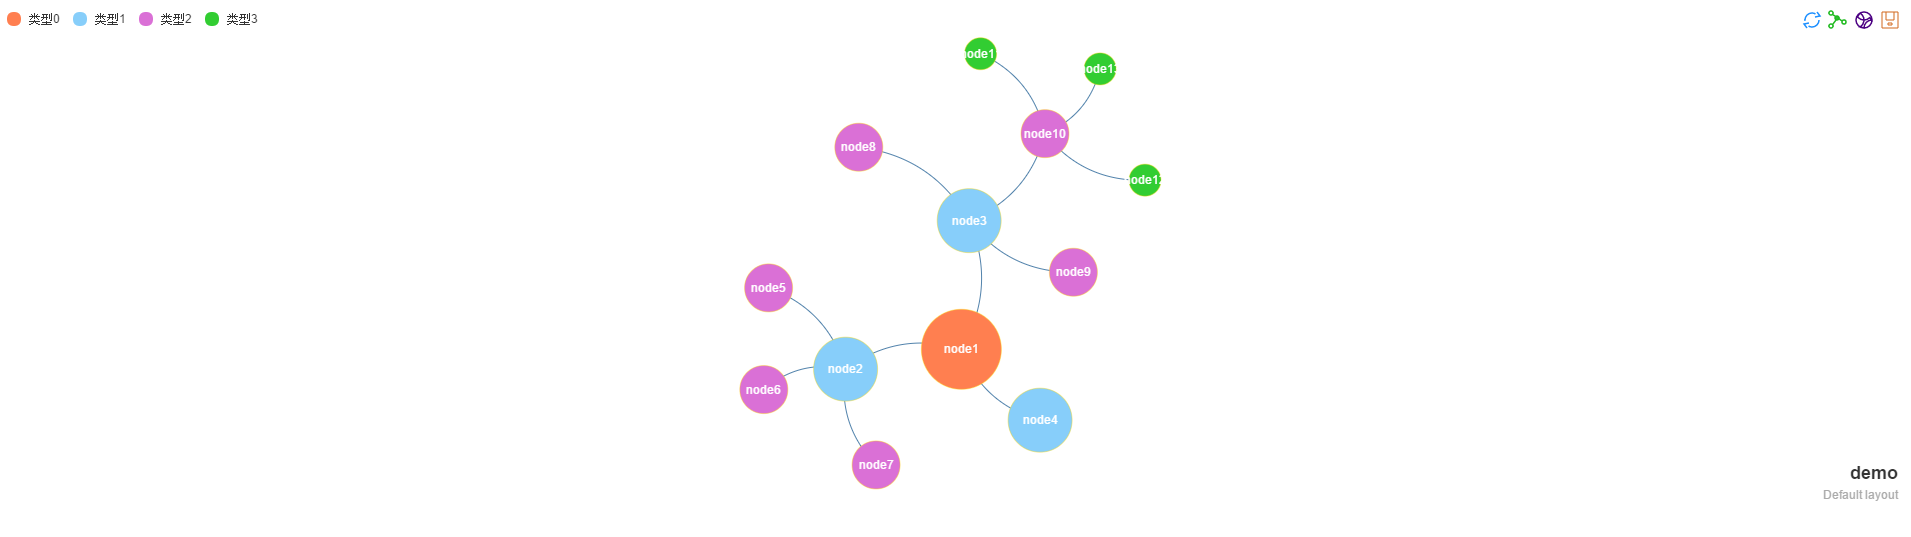
点击之后就跳转到百度网站了。 之后需求又改了一次,不说了,但是总体上没有什么改变,基本重要的配置都写到代码了,不懂的或者有错误,欢迎留言。


 1519
1519

 被折叠的 条评论
为什么被折叠?
被折叠的 条评论
为什么被折叠?
 到【灌水乐园】发言


