


通常一个由客户端发起的请求会在后端系统中经过多个不同的微服务调用来协同产生最后的请求结果,在复杂的微服务架构系统中,几乎每一个前端请求都会形成一条复杂的分布式服务调用链路,每条链路服务痴线错误或者延迟都有可能引起请求的失败。Spring Cloud Sleuth提供了一套全链路调用跟踪以及监控分析方案。
一、测试链路跟踪
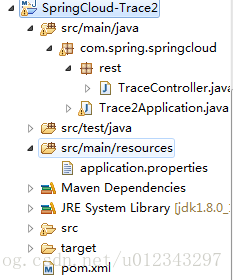
1、创建项目SpringCloud-Sleuth和SpringCloud-Trace2项目,项目Sleuth中调用Trace2项目中提供的服务接口。
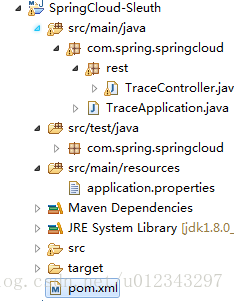
2、pom中的依赖,两个项目相同
<dependencies>
        <dependency>
            <groupId>org.springframework.boot</groupId>
            <artifactId>spring-boot-starter-web</artifactId>
        </dependency>
        <dependency>
            <groupId>org.springframework.boot</groupId>
            <artifactId>spring-boot-starter-test</artifactId>
        <scope>test</scope>
        </dependency>

        <dependency>
            <groupId>org.springframework.cloud</groupId>
            <artifactId>spring-cloud-starter-eureka</artifactId>
        </dependency>
        <!-- add ribbon depend -->
        <dependency>
            <groupId>org.springframework.cloud</groupId>
            <artifactId>spring-cloud-starter-ribbon</artifactId>
        </dependency>
        <!-- add sleuth depend -->
        <dependency>
            <groupId>org.springframework.cloud</groupId>
            <artifactId>spring-cloud-starter-sleuth</artifactId>
        </dependency>
    </dependencies>
3、Trace2项目中提供/trace-2接口
@RestController
public class TraceController {

    @RequestMapping(value="/trace-2",method=RequestMethod.GET)
    public String trace(){
        System.out.println("======================call Trace 2========================");
        return "Trace";
    }
}
Sleuth中使用RestTemplate调用Trace-2服务
@RestController
public class TraceController {


    @Autowired
    RestTemplate restTemplate;

    @RequestMapping(value="/trace-1",method=RequestMethod.GET)
    public String trace(){
        System.out.println("============>Call Trace=============");
        ResponseEntity<String> entity = restTemplate.getForEntity("http://trace-2/trace-2", String.class);

        return entity.getBody();
    }
}
Trace2主类
@EnableDiscoveryClient
@SpringBootApplication
public class Trace2Application {

    @Bean
    public AlwaysSampler defaultSampler(){
        return new AlwaysSampler();
    }
    public static void main(String[] args) {
        SpringApplication.run(Trace2Application.class, args);
    }


}4、访问http://localhost:9003/trace-1
============>Call Trace=============
2017-12-25 14:32:48.808  INFO [sleuth-trace,1ccd077442207e68,191e2353159ad4bb,false] 11140
二、整合Zipkin
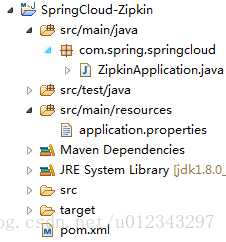
1、创建项目SpringCloud-Zipkin
2、在pom中添加依赖
<dependencies>
        <dependency>
            <groupId>org.springframework.boot</groupId>
            <artifactId>spring-boot-starter</artifactId>
        </dependency>

        <dependency>
            <groupId>org.springframework.boot</groupId>
            <artifactId>spring-boot-starter-web</artifactId>
        </dependency>
        <dependency>
            <groupId>io.zipkin.java</groupId>
            <artifactId>zipkin-server</artifactId>
        </dependency>
        <dependency>
            <groupId>io.zipkin.java</groupId>
            <artifactId>zipkin-autoconfigure-ui</artifactId>
            <!-- <version>2.4.2</version> -->
        </dependency>
        <dependency>
            <groupId>org.springframework.boot</groupId>
            <artifactId>spring-boot-starter-test</artifactId>
        <scope>test</scope>
        </dependency>
    </dependencies>

    <dependencyManagement>
        <dependencies>
            <dependency>
                <groupId>org.springframework.cloud</groupId>
                <artifactId>spring-cloud-dependencies</artifactId>
                <version>Camden.SR6</version>
                <type>pom</type>
                <scope>import</scope>
            </dependency>
        </dependencies>
    </dependencyManagement>
3、在主类中使用注解@EnableZipkinServer 开启Zipkin服务。
4、在application中配置端口和服务名
server.port=9411

spring.application.name=zipkin-server
客户端默认连接Zipkin的url为http://localhost:9411, 故而这里的端口设置为9411,也可以改成其他端口。
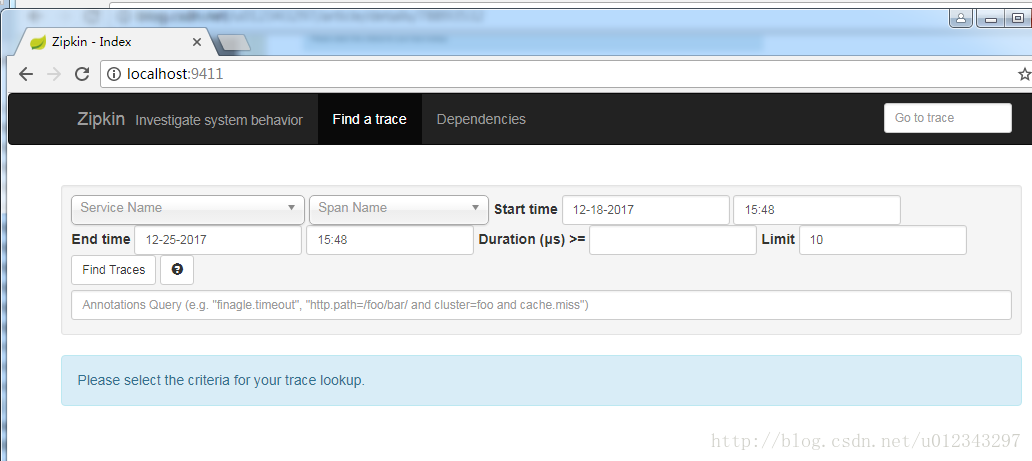
5、启动服务,访问:http://localhost:9411
6、在(一)中的项目Sleuth和Trace中的pom中添加Zipkin依赖
<!-- add zipkin depend -->
        <dependency>
            <groupId>org.springframework.cloud</groupId>
            <artifactId>spring-cloud-sleuth-zipkin</artifactId>
</dependency>7、在application.properties中添加配置,spring.zipkin.base-url默认配置为http://localhost:9411,所以这里不做配置也行。
spring.zipkin.base-url=http://localhost:94118、依次启动EurekaServer、Trace2、Sleuth项目,访问http://localhost:9004/trace-1,在ZipkinServer中心查看
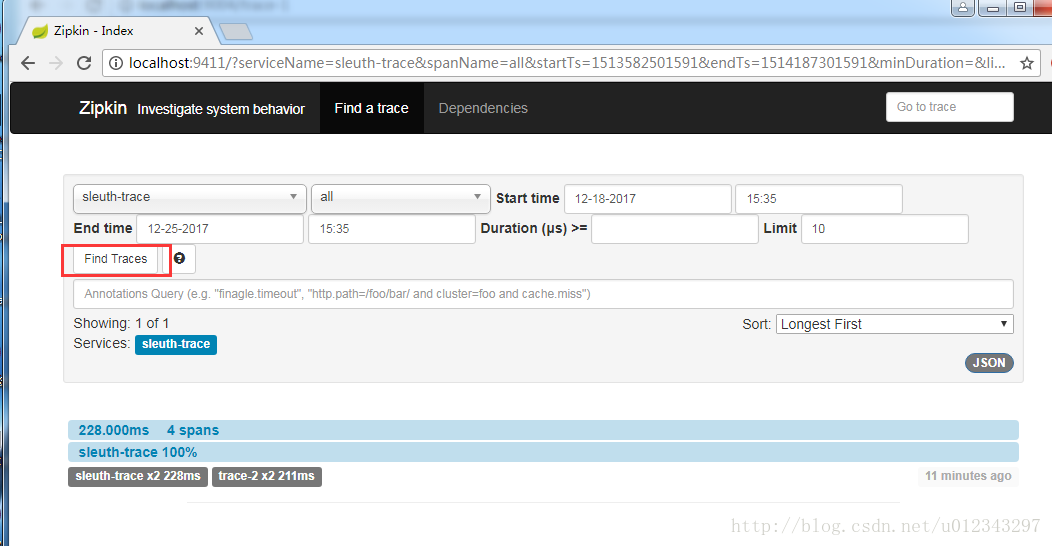
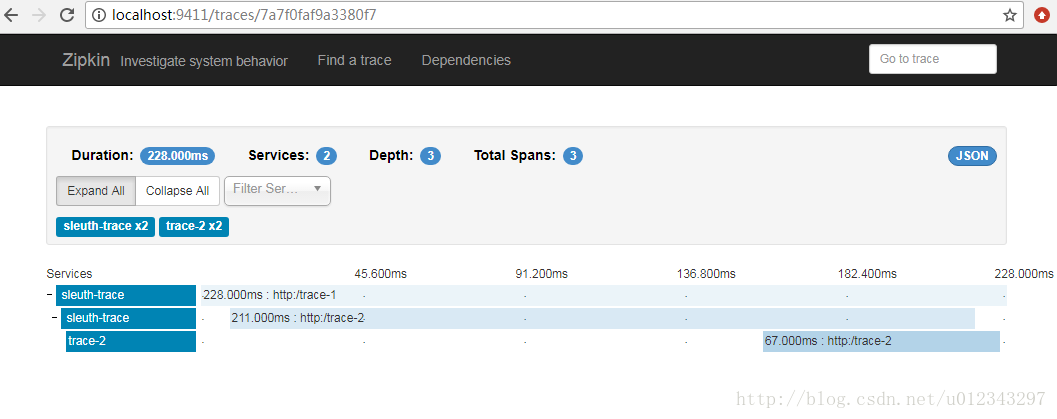
点击Find Traces按钮,查询出结果,可以查看Service详细链路。


 3343
3343


 被折叠的 条评论
为什么被折叠?
被折叠的 条评论
为什么被折叠?
 到【灌水乐园】发言


