


首先粘贴一个网页,这个网页对plt 介绍比较详细 http://blog.sciencenet.cn/blog-251664-800766.html
这里python2 和 python3 有一些不同,那就是ax.xlabel è ax.set_xlabe() 函数名字方面有些不同。
详细介绍一点常识
ax.set_title("Function performance",fontsize=14)
ax.set_xlabel("code executions",fontsize=12)
ax.set_ylabel("time(s)",fontsize=12)
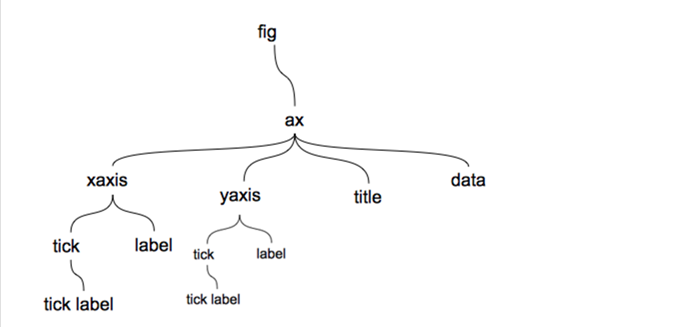
下面这张图是 这些object的关系,
http://www.cnblogs.com/nju2014/p/5620776.html 来自这个网站
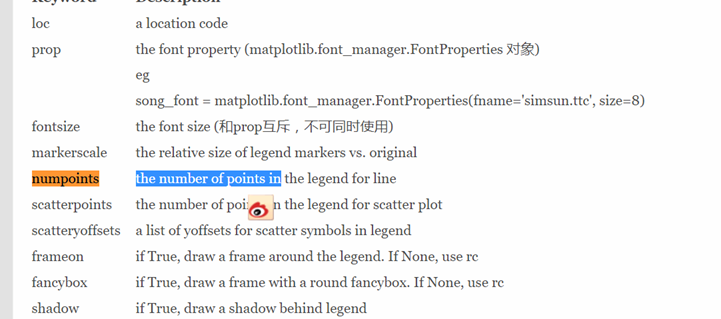
下面再说一点就是 legend就是标签的意思。
ax.legend(numpoints=1, loc='upper left') 比如我在程序中看到这么一句话。Numpoints 就是 标签中对应的点出现几个,loc,就是标签出现在什么位置
http://blog.sina.com.cn/s/blog_4b9acb520101an32.html
这个函数居然在MATLAB里面也有,貌似差别很小。
1. 关闭坐标刻度
plt.xticks([])
plt.yticks([])
关闭坐标轴:
plt.axis('off')
注意,类似的这些操作若想起作用,需要将其置于 plt.show() 之前,plt.imshow() 之后。
-
dpi:Dots Per Inch
3. 坐标轴不可见
frame = plt.gca()
# y 轴不可见
frame.axes.get_yaxis().set_visible(False)
# x 轴不可见
frame.axes.get_xaxis().set_visible(False)
1. 关闭坐标刻度
plt.xticks([])
plt.yticks([])
关闭坐标轴:
plt.axis('off')
注意,类似的这些操作若想起作用,需要将其置于 plt.show() 之前,plt.imshow() 之后。
2. 设置所要保存图像的 dpi
-
dpi:Dots Per Inch
plt.savefig(..., dpi=150)
3. 坐标轴不可见
frame = plt.gca()
# y 轴不可见
frame.axes.get_yaxis().set_visible(False)
# x 轴不可见
frame.axes.get_xaxis().set_visible(False)
两次plot不需要像matlab一样加 hold on 这个语句。
一维的话最好,google 1-d
def gaussian(x, mu, sig):
return np.exp(-np.power(x - mu, 2.) / (2 * np.power(sig, 2.)))/np.sqrt(2*math.pi *sig * sig)
高斯函数也就是正态分布的函数。
plt.subplots() is a function that returns a tuple containing a figure and axes object(s). Thus when using fig, ax = plt.subplots() you unpack this tuple into the variables fig and ax. Having figis useful if you want to change figure-level attributes or save the figure as an image file later (e.g. with fig.savefig('yourfilename.png'). You certainly don't have to use the returned figure object but many people do use it later so it's common to see. Also, all axes objects (the objects that have plotting methods), have a parent figure object anyway, thus:
fig, ax = plt.subplots()
is more concise than this:
fig = plt.figure()
ax = fig.add_subplot(111)
上面是 stackoverflow 上面的一段话,讲的很好搬过来。
http://blog.csdn.net/u013634684/article/details/49646311
上面那个链接是讲解 画散点图 的一个视频。主要讲的是 scatter 函数
设置刻度
plt.xlim(min,max) # 设置x 坐标的 范围
实例1
http://lib.csdn.net/article/python/47453
http://blog.sciencenet.cn/blog-251664-800766.html
http://www.cnblogs.com/qqhfeng/p/5567539.html 调整字体-设置刻度、坐标、colormap和colorbar等
http://blog.csdn.net/you_are_my_dream/article/details/53458443 生成图形(matplotlib.patches)
http://www.cnblogs.com/zhizhan/p/5615947.html Python--matplotlib绘图可视化知识点整理 无论你工作在什么项目上,IPython都是值得推荐的。利用ipython --pylab,可以进入PyLab模式,已经导入了matplotlib库与相关软件包(例如Numpy和Scipy),额可以直接使用相关库的功能。 本文作为学习过程中对matplotlib一些常用知识点的整理,方便查找。
上面的是对 gca 和 gcf 的解释。


 1万+
1万+

 被折叠的 条评论
为什么被折叠?
被折叠的 条评论
为什么被折叠?
 到【灌水乐园】发言


