


目录
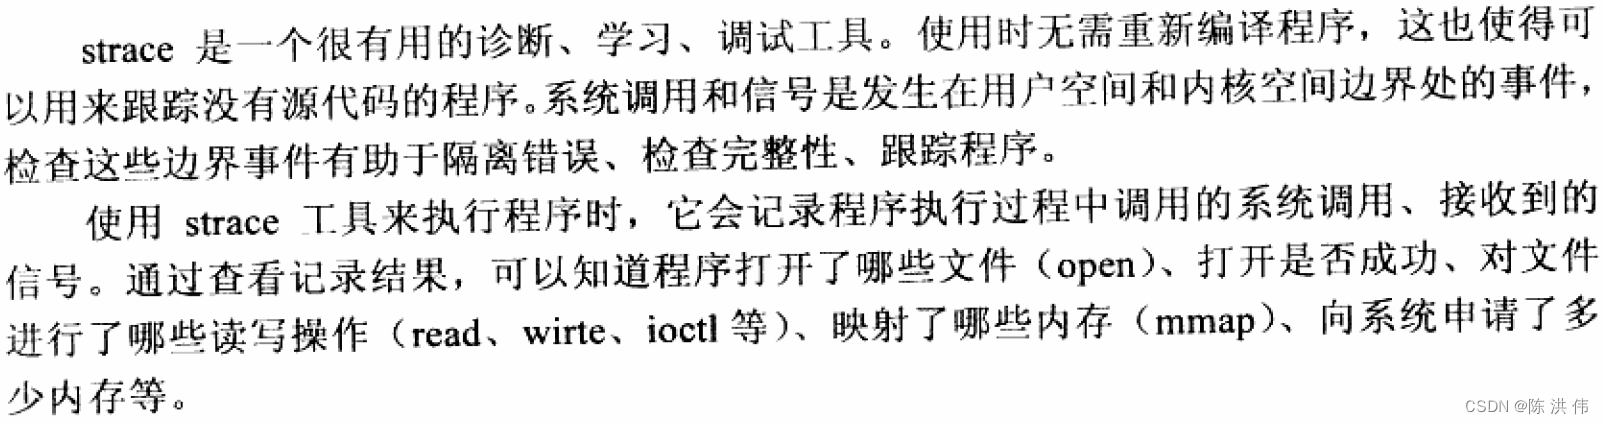
1 strace介绍
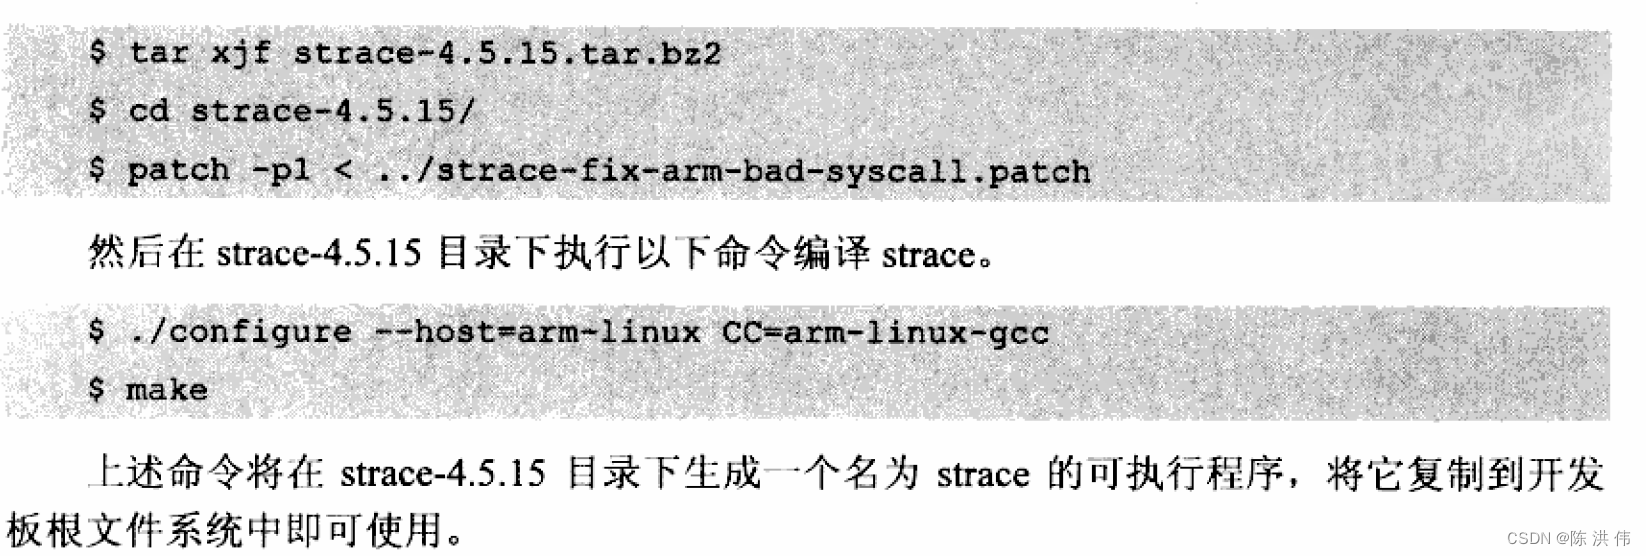
2 strace移植
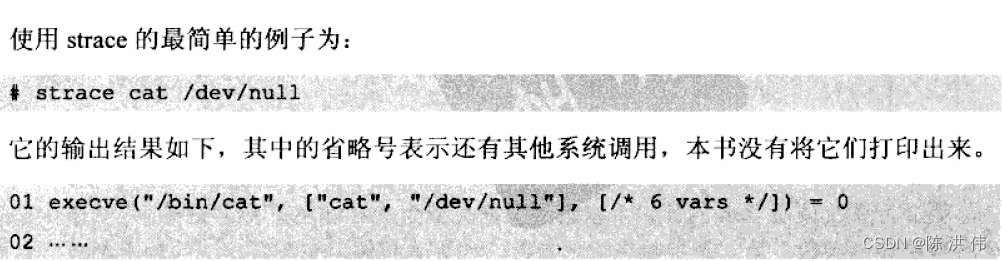
3 使用strace调试程序
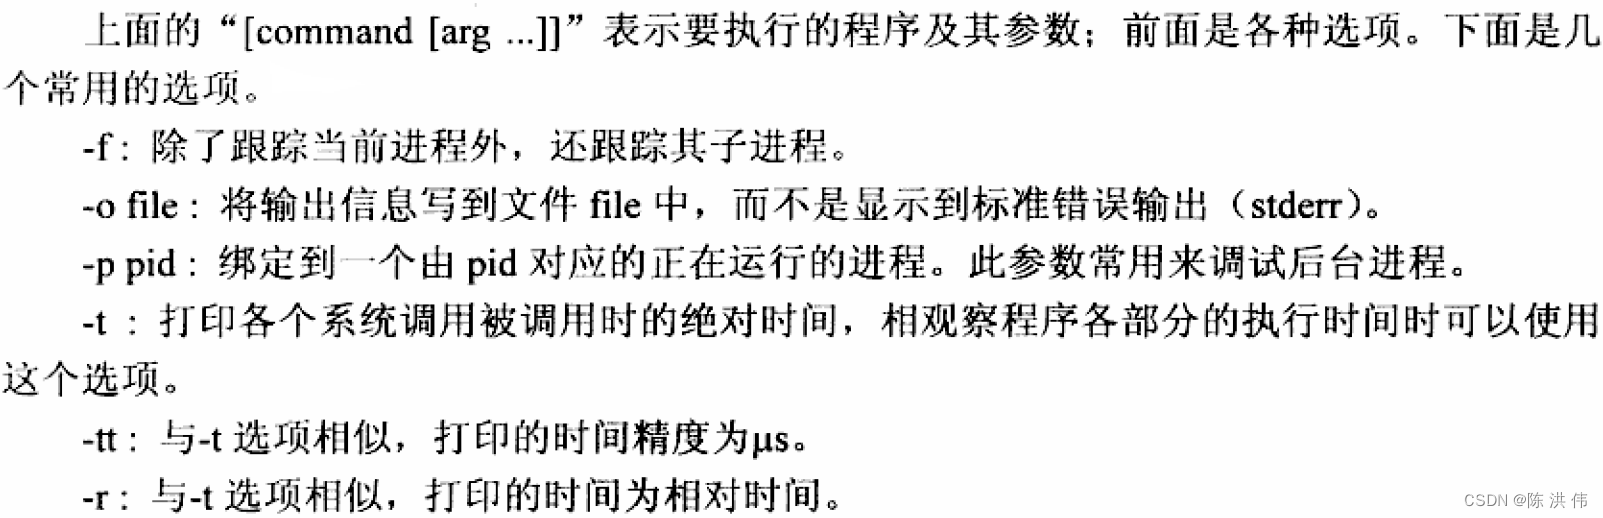
3.1 strace的用法
运行strace -h可以看到strace的用法
root@bm1684:/data/chw/bm_det_track# strace -h
usage: strace [-CdffhiqrtttTvVwxxy] [-I n] [-e expr]...
              [-a column] [-o file] [-s strsize] [-P path]...
              -p pid... / [-D] [-E var=val]... [-u username] PROG [ARGS]
   or: strace -c[dfw] [-I n] [-e expr]... [-O overhead] [-S sortby]
              -p pid... / [-D] [-E var=val]... [-u username] PROG [ARGS]

Output format:
  -a column      alignment COLUMN for printing syscall results (default 40)
  -i             print instruction pointer at time of syscall
  -o file        send trace output to FILE instead of stderr
  -q             suppress messages about attaching, detaching, etc.
  -r             print relative timestamp
  -s strsize     limit length of print strings to STRSIZE chars (default 32)
  -t             print absolute timestamp
  -tt            print absolute timestamp with usecs
  -T             print time spent in each syscall
  -x             print non-ascii strings in hex
  -xx            print all strings in hex
  -y             print paths associated with file descriptor arguments
  -yy            print protocol specific information associated with socket file descriptors

Statistics:
  -c             count time, calls, and errors for each syscall and report summary
  -C             like -c but also print regular output
  -O overhead    set overhead for tracing syscalls to OVERHEAD usecs
  -S sortby      sort syscall counts by: time, calls, name, nothing (default time)
  -w             summarise syscall latency (default is system time)

Filtering:
  -e expr        a qualifying expression: option=[!]all or option=[!]val1[,val2]...
     options:    trace, abbrev, verbose, raw, signal, read, write, fault
  -P path        trace accesses to path

Tracing:
  -b execve      detach on execve syscall
  -D             run tracer process as a detached grandchild, not as parent
  -f             follow forks
  -ff            follow forks with output into separate files
  -I interruptible
     1:          no signals are blocked
     2:          fatal signals are blocked while decoding syscall (default)
     3:          fatal signals are always blocked (default if '-o FILE PROG')
     4:          fatal signals and SIGTSTP (^Z) are always blocked
                 (useful to make 'strace -o FILE PROG' not stop on ^Z)

Startup:
  -E var         remove var from the environment for command
  -E var=val     put var=val in the environment for command
  -p pid         trace process with process id PID, may be repeated
  -u username    run command as username handling setuid and/or setgid

Miscellaneous:
  -d             enable debug output to stderr
  -v             verbose mode: print unabbreviated argv, stat, termios, etc. args
  -h             print help message
  -V             print version
3.2 strace输出结果分析
3.3 strace使用体验
我们使用strace跟踪我们前面的驱动测试程序
strace -o log.txt ./firstdrvtest on得到
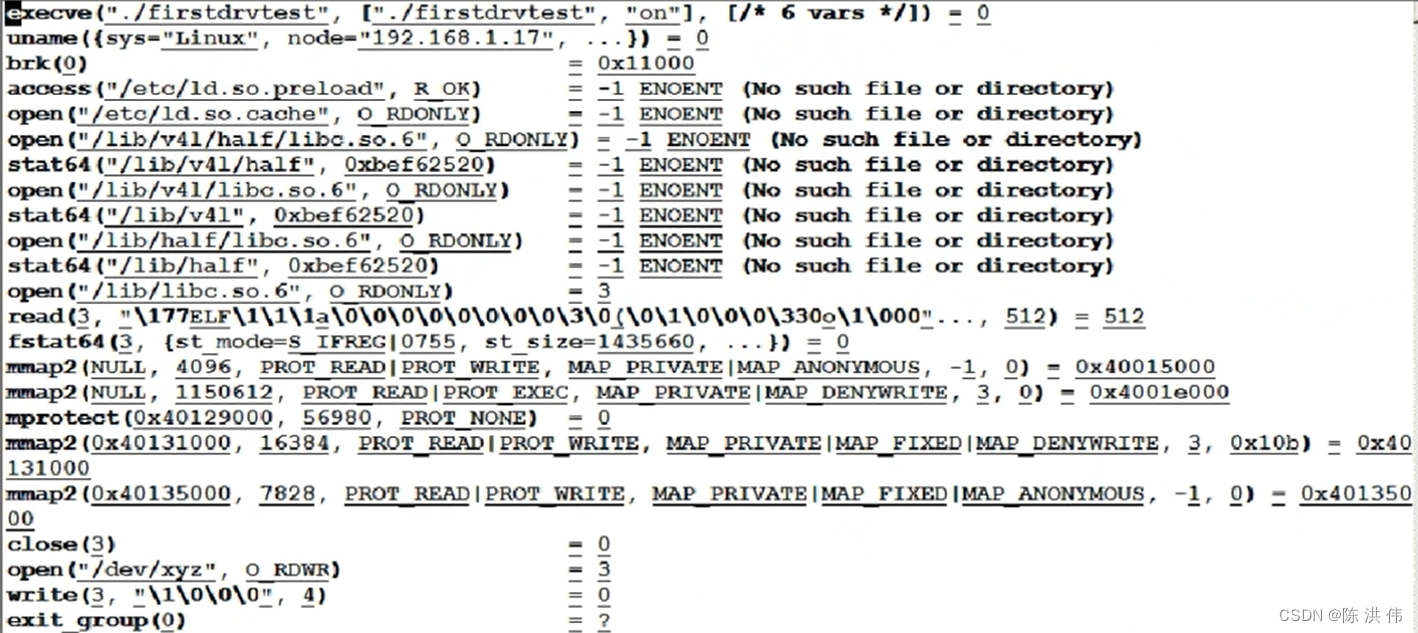
前面首先是打开一大堆库,倒数第三行的open是打开这个文件,返回文件描述符3,倒数第二行是把中间的数写到文件fd为3的文件中,写的长度是4个字节。
我们可以看到,strace可以打印出来我们的应用程序调用了哪些系统调用。
3.4 使用strace调试程序
如果我们用busybox-1.20,那么我们卸载驱动程序的时候可能会报错,我们用strace来看一下。

然后编译选项里面加上交叉编译前缀,然后使用默认的配置,直接make
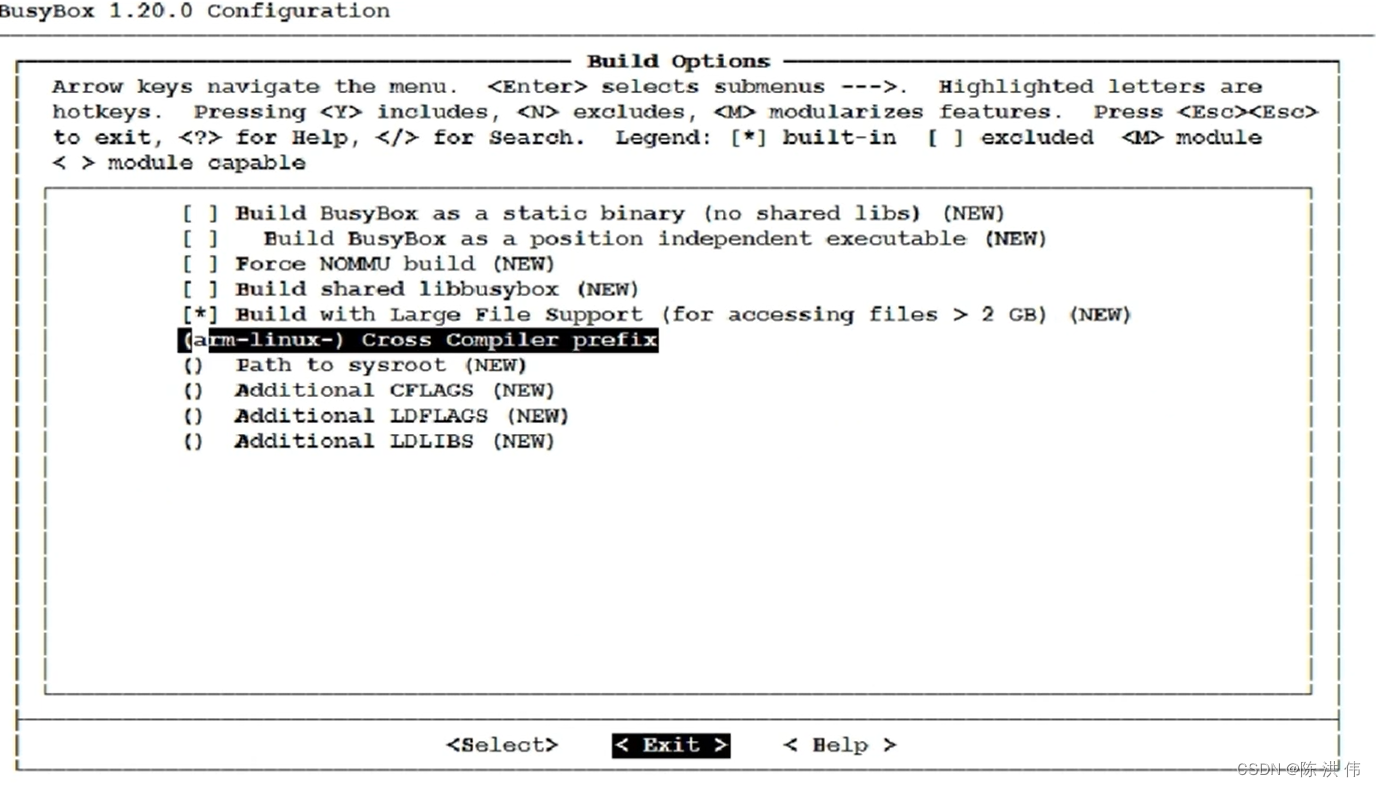
编译过程中遇到了一些错误,为了省事直接把报错的命令不编译了,配置项里面把报错的项去掉,编译完之后替换掉之前的busybox.

然后重启开发板,然后装卸、卸载驱动,报错了

我们用strace命令看一下
strace -o log.txt rmmod first_drv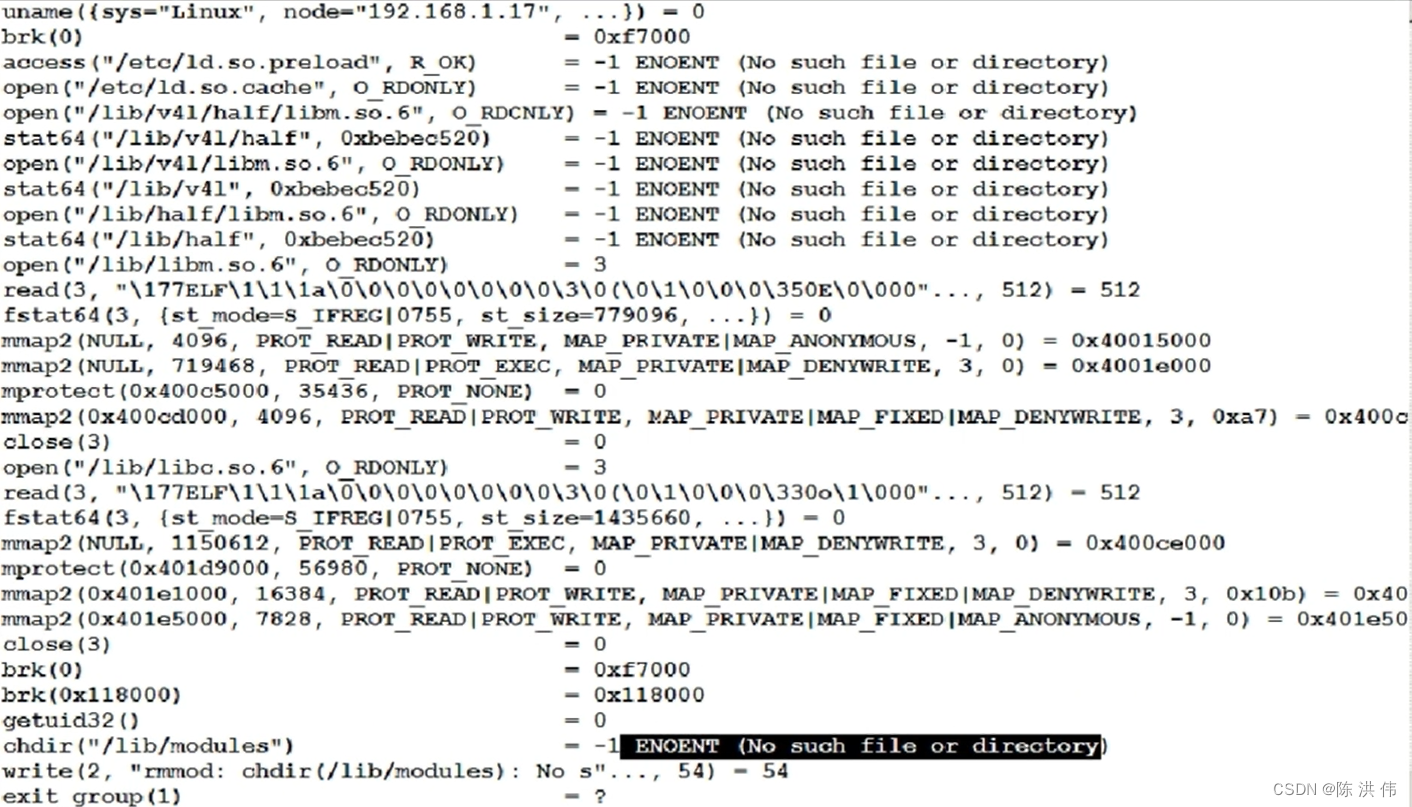
报错没有这么目录,那我们就创建这个目录,

还是报错,那继续strace
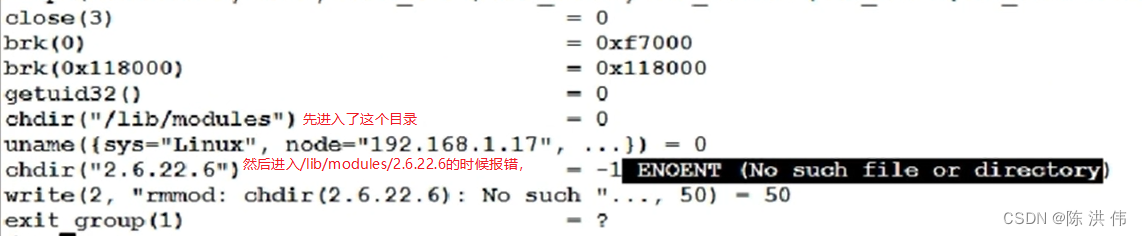
那么继续创建目录,错误消失

3.5 strace命令的原理
strace是一个父进程,它会创建一个子进程,子进程就就是对应的应用程序,
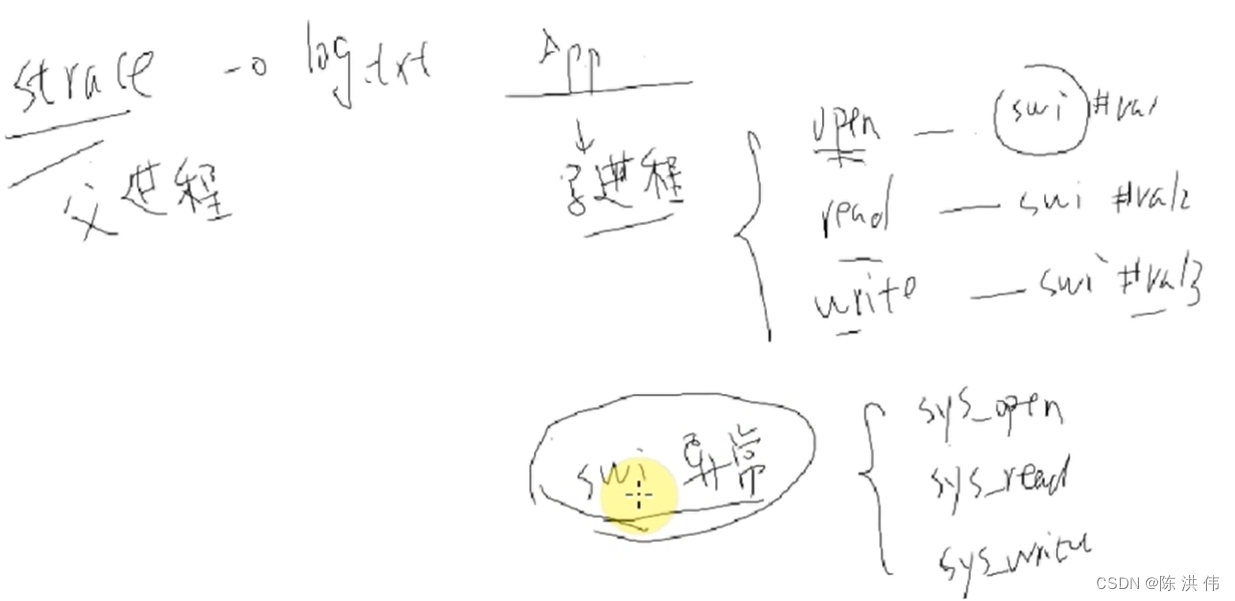
我们应用层的open函数本质上就是执行了一个swi指令,然后发生异常进入内核态,
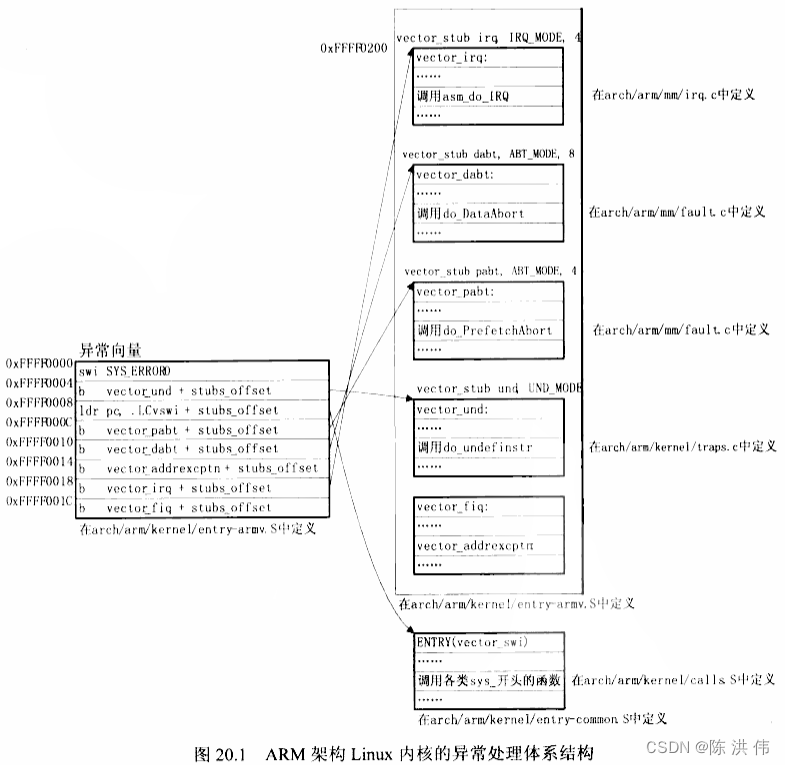
我们到entry-common.S中看一下,然后在entry-common.S中搜索vector_swi
ENTRY(vector_swi)
	sub	sp, sp, #S_FRAME_SIZE
	stmia	sp, {r0 - r12}			@ Calling r0 - r12
	add	r8, sp, #S_PC
	stmdb	r8, {sp, lr}^			@ Calling sp, lr
	mrs	r8, spsr			@ called from non-FIQ mode, so ok.
	str	lr, [sp, #S_PC]			@ Save calling PC
	str	r8, [sp, #S_PSR]		@ Save CPSR
	str	r0, [sp, #S_OLD_R0]		@ Save OLD_R0
	zero_fp
先是保存现场,然后往下看有这个
stmdb	sp!, {r4, r5}			@ push fifth and sixth args
tst	ip, #_TIF_SYSCALL_TRACE		@ are we tracing syscalls?
bne	__sys_trace

cmp	scno, #NR_syscalls		@ check upper syscall limit
adr	lr, ret_fast_syscall		@ return address
ldrcc	pc, [tbl, scno, lsl #2]		@ call sys_* routine
里面有个tst ip,测试应用程序是否被跟踪,如果被跟踪就bne __sys_trace
	/*
	 * This is the really slow path.  We're going to be doing
	 * context switches, and waiting for our parent to respond.
	 */
__sys_trace:
	mov	r2, scno
	add	r1, sp, #S_OFF
	mov	r0, #0				@ trace entry [IP = 0]
	bl	syscall_trace
然后子进程给父进程发一个信号,然后等待父进程,父进程记录了一些东西之后,然后子进程再继续跑。


 567
567

 被折叠的 条评论
为什么被折叠?
被折叠的 条评论
为什么被折叠?
 到【灌水乐园】发言


