


主要内容:
- 准确度评判标准的缺陷
- The Confusion Matrix
- 非均衡类别的问题
- Data-Analytic Thinking
- 分析框架:期望值
- 模型评判的基准(Baseline)
———————————————————————————————————————————————
(一)准确度评判标准的缺陷
-
- 需要肯定的是准确度(plain accuracy)评判标准比较流行且计算方便
- 在一些实际的案例中,准确度评判的效果强差人意(过于简单)

- 容易受到非均衡类别的影响
- 均衡地对待 false Positives 和 false Negatives 【定义见(二)】 —> 涉及到Cost的问题
(二)The Confusion Matrix
- 定义:Confusion Matrix 是一个NxN的矩阵,矩阵的列标题是实际的类别,矩阵的行标题是预测的类别
|
|
|
|
|
|
|
|
|
|
在Confusion Matrix 中,对角线为正确预测的案例,非对角线则为预测错误
其中False positives 为 将 negative 的案例错误地归结为positives
其中False negatives 为 将 positives 的案例错误地归结为negatives
(三)非均衡类别问题
假设有模型A、B,作用于同一均衡类别的数据后得到如下结果
|
| ||||||||||||||||||
|
|
两个模型均正确分类了80%的数据,但是他们的表现却截然不同,A模型偏向于将 False churn 、B模型偏向于False not churn
假如这两个模型应用于非均衡类别样本那么他们的模型之间的准确率变化将非常大,如下图所示

(四)Data-Analytic Thinking
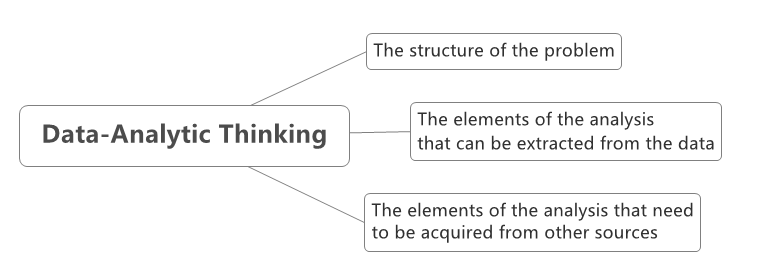
例如下面的对话:
Analyst : Our model is good based on the mean-squared error
Boss : mean-squared error of what?
Analyst: the value of the target variable, which is the number of stars that a user would give as a rating for the movie
Boss : Why is the mean-squared-error on the predicted number of stars an appropriate metric for our recommendation problem?
Boss : Is it meaningful ?
Boss : Is there a better metric ?
在实际工作中,很多分析人士只会使用那些在学校课堂中学习到的度量方式,而没有自己的思考,这点相当可悲。
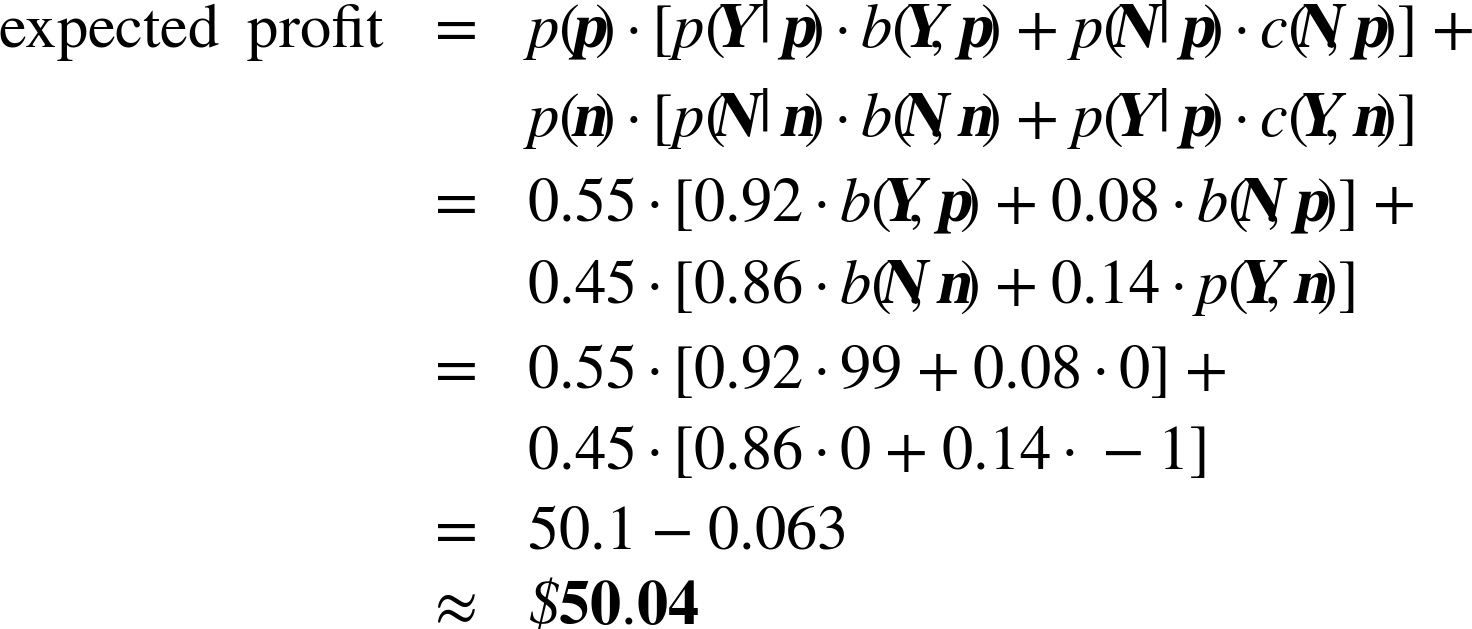
(五)分析框架:期望值
对每个客户个体而言,他们对于刺激的反馈概率往往很低,一般1%或2%左右,如果我们选取50%为决策阈值,那么我们将会得到结论“没有人会对刺激有反应”

据此我们能做出较好的决策
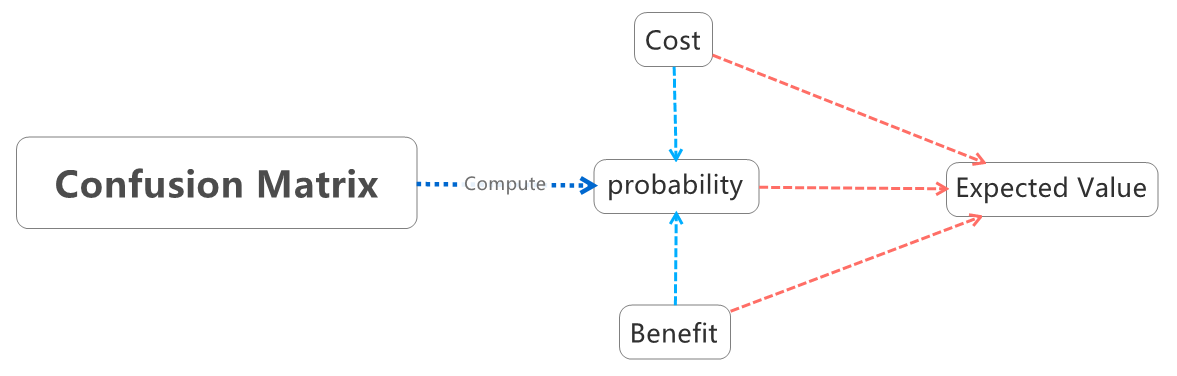
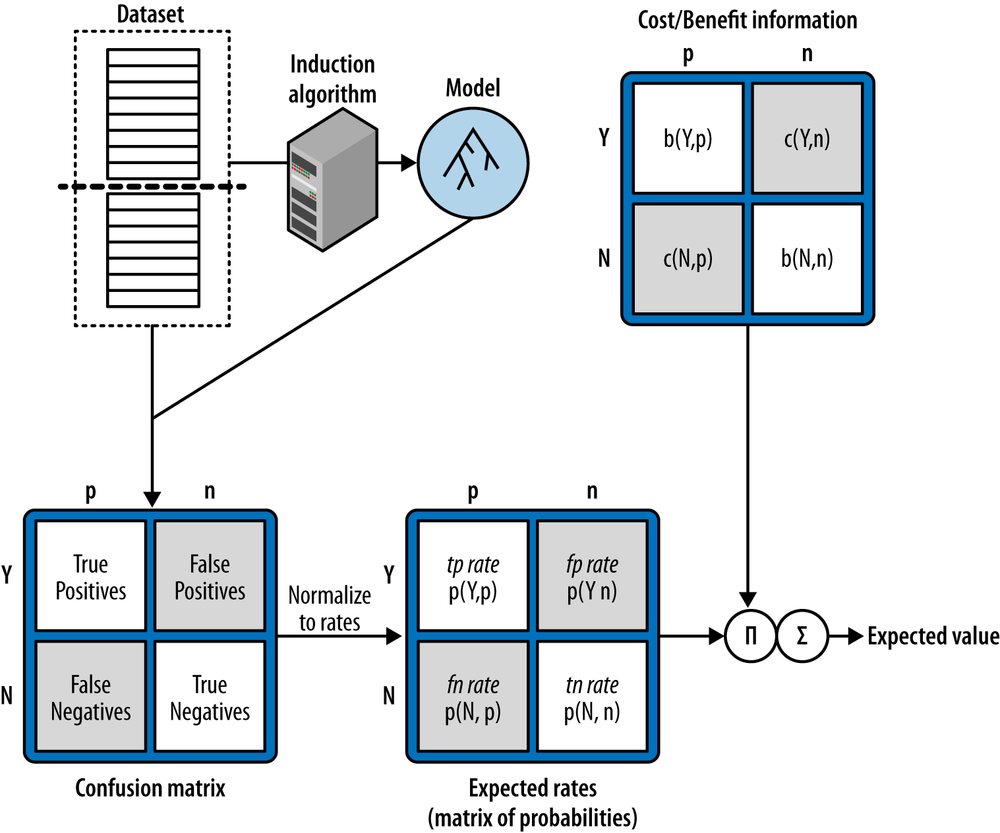
二维情况下
利用条件概率
得到计算公式
注:

例子:
Confusion Matrix、
|
|
|
|
|
|
|
|
|
|
Cost-Benefit Matrix
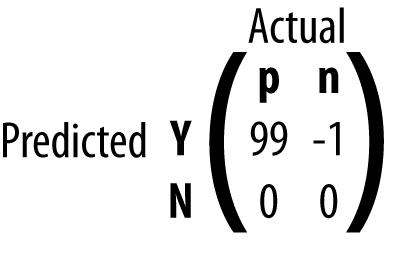
计算过程:
|
|
|
|
|
|
|
|
|
|
、
PS: 其他一些度量标准
- The metrics Precision and Recall are often used, especially in text classification and information retrieval. Recall is the same as true positive rate, while precision is TP/(TP + FP), which is the accuracy over the cases predicted to be positive.
(六)模型评判的基准(Baseline)
- 最大化预测准确率往往不是一个合适的目标
- Classification 的 baseline 可以是 Majority Classifier
- 在较多的机器学习研究中决策树桩(Decision Stump)往往是较好的基准
- 有的时候我们能利用领域知识在预测作为基准
注:Decision Stump: a decision tree with only one internal node, the root node(mostinformativefeature)
In real-world domains simplistic measures rarely capture what is actually important for the problem at hand, and often mislead. Instead, the data scientist should give careful thought to how the model will be used in practice and devise an appropriate metric.


 1072
1072

 被折叠的 条评论
为什么被折叠?
被折叠的 条评论
为什么被折叠?
 到【灌水乐园】发言


