


前言
MATLAB具有强大的绘图功能,利用MATLAB可以很方便地实现大量数据计算结果的可视化,而且可以很方便的修改和编辑图形界面。
绘图分为二维绘图和三维绘图。
一、基本绘图函数
plot,plot3:建立向量或矩阵的图形
Loglog:x、y轴都取对数标度建立图形
Semilogx:x轴用于对数标度,y轴线性标度绘制图形
Semilogy:y轴用于对数标度,x轴线性标度绘制图形
Title:给图形加标题
Xlabel,Ylabel: 给x,y轴加标记
Text:在图形指定的位置上加文本字符串
gtext: 在鼠标的位置上加文本字符串
grid: 打开网格线
二、使用步骤
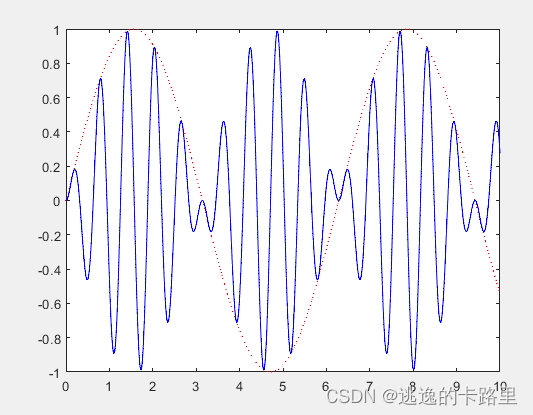
1.plot的基本调用格式
代码如下(示例):
clear
clc
t=0:0.001:10;
y=sin(t);
% plot(t,y);
Y=sin(10*t);
c=y.*Y;
plot(t,y,'r:',t,c,'b')
2.对于变化剧烈的函数,可用fplot来进行较精确的绘图
代码如下(示例):
clear
clc
subplot(2,2,1), fplot('humps',[0 1])
subplot(2,2,2), fplot(@(x)abs(exp(-j*x*(0:9))*ones(10,1)),[0 2*pi])
subplot(2,2,3), fplot(@(x)[tanh(x),sin(x),cos(x)],2*pi*[-1,1])
subplot(2,2,4), fplot(@(x)sin(1 ./ x), [0.01 0.1],1e-3)

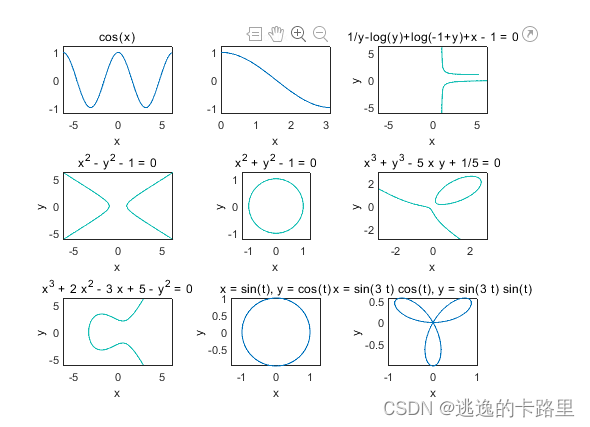
3.对符号函数作图可用ezplot
clear
clc
subplot(3,3,1)
ezplot('cos(x)')
subplot(3,3,2)
ezplot('cos(x)', [0, pi])
subplot(3,3,3)
ezplot('1/y-log(y)+log(-1+y)+x - 1')
subplot(3,3,4)
ezplot('x^2 - y^2 - 1')
subplot(3,3,5)
ezplot('x^2 + y^2 - 1',[-1.25,1.25]);
axis equal
subplot(3,3,6)
ezplot('x^3 + y^3 - 5*x*y + 1/5',[-3,3])
subplot(3,3,7)
ezplot('x^3 + 2*x^2 - 3*x + 5 - y^2')
subplot(3,3,8)
ezplot('sin(t)','cos(t)')
subplot(3,3,9)
ezplot('sin(3*t)*cos(t)','sin(3*t)*sin(t)',[0,pi])
4.二维三维绘制函数
bar(x,y) (barh(x,y),bar3,bar3h):直方(水平)图
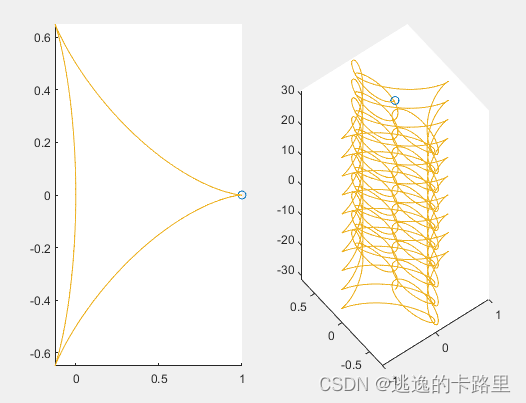
comet (x,y) (comet3): 建立彗星流动图
clear
clc
subplot(1,2,1);
t = 0:0.01:2*pi;
x = cos(2*t).*(cos(t).^2);
y = sin(2*t).*(sin(t).^2);
comet(x,y)
subplot(1,2,2);
t = -10*pi:pi/250:10*pi;
comet3((cos(2*t).^2).*sin(t),(sin(2*t).^2).*cos(t),t)
errorbar(x,y,l,u) : 图形加上误差范围
polar (theta,rho) : 极坐标图
hist (y,x) : 向量统计的直方图,其中y为要统计的。当x为标 量时,x指定了统计的区间数;当x为向量时,以该向量中各元素为中心进行统计,区间数等于x向量的长度
rose(theta) : 极坐标频数累计柱状图
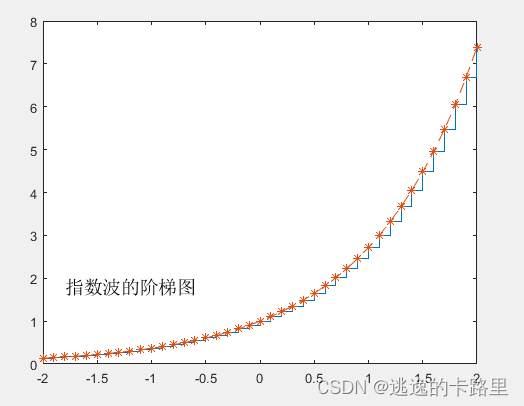
stairs (x,y) : 阶梯图
close all
x = -2:0.1:2;
y = exp(x);
%bar(x,y)      %柱状图
stairs(x,y)          %绘制指数函数的阶梯图
hold on
plot(x,y,'--*')      %使用带星号的虚线标记绘制的指数函数二维曲线
hold off
text(-1.8,1.8,'指数波的阶梯图','FontSize',14)  %在指定坐标添加标注文本,字号为14
stem(x,y,’fill’) : 针状图
fill : 实心图
feather : 羽毛图
compass : 罗盘图
quiver,quiver3 : 向量场图,通常与contour(),gradient() 配合使用
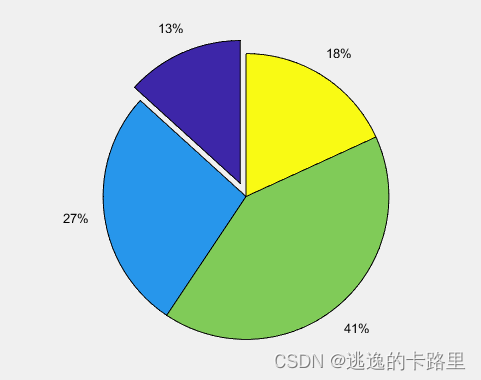
pie,pie3 : 饼图
clear
clc
x=[11.4 23.5 35.4 15.6];
explode=zeros(size(x));
[c,offset]=min(x);
explode(offset)=c;
pie(x,explode)
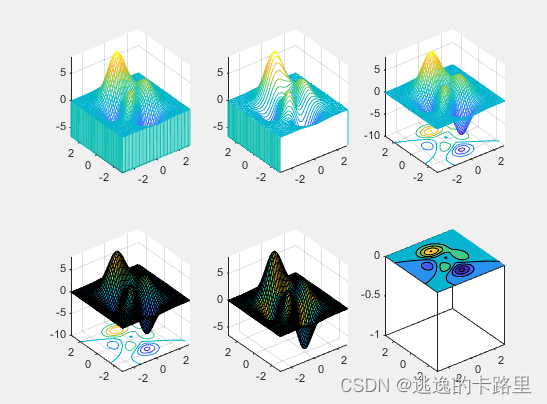
5.绘制三维曲面图
mesh(z)语句给出矩阵Z元素的三消隐图,surf和mesh的用法相似。为了方便测试立体绘图,MATLAB提供了一个peaks函数,可产生一个凹凸有致的曲面,包 含了三个局部极大点及三个局部极小点, 要画出此函数的最快方法即是直接键入peaks. 三维函数还有meshc(), meshz(), surfc(), surfl(), contourf(), waterfall()等.
clear
clc
[x,y,z] =peaks;
subplot(2,3,1);
meshz(x,y,z); %曲面加上围裙,即给出曲面和零平面
axis([-inf inf -inf inf -inf inf]);
subplot(2,3,2);
waterfall(x,y,z); %在x方向产生水流效果
axis([-inf inf -inf inf -inf inf]);
subplot(2,3,3);
meshc(x,y,z); %同时画出网状图与等高线
axis([-inf inf -inf inf -inf inf]);
subplot(2,3,4);
surfc(x,y,z); %同时画出曲面图与等高线
axis([-inf inf -inf inf -inf inf]);
subplot(2,3,5)
surfl(x,y,z); %给出带光照效果的彩色表面图
axis([-inf inf -inf inf -inf inf]);
subplot(2,3,6)
contourf(x,y,z);
axis([-inf inf -inf inf -inf inf]);
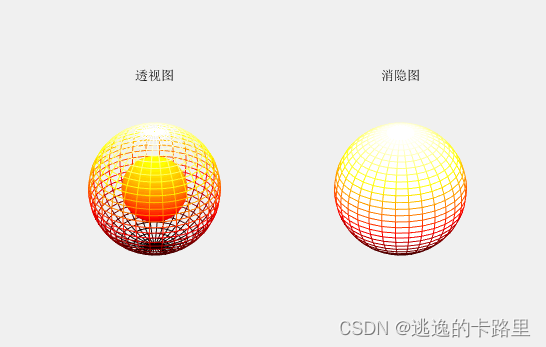
clear
clc
[X0,Y0,Z0]=sphere(30);       %产生单位球面的三维坐标
X=2*X0;Y=2*Y0;Z=2*Z0;        %产生半径为2的球面的三维坐标
clf
subplot(1,2,1);
surf(X0,Y0,Z0);          %画单位球面
shading interp               %采用插补明暗处理
hold on,mesh(X,Y,Z),colormap(hot),hold off       %采用hot色图
hidden off                    %产生透视效果
axis equal,axis off          %不显示坐标轴
title('透视图')
subplot(1,2,2);
surf(X0,Y0,Z0);          %画单位球面
shading interp               %采用插补明暗处理
hold on,mesh(X,Y,Z),colormap(hot),hold off       %采用hot色图
hidden on                    %产生消隐效果
axis equal,axis off          %不显示坐标轴
title('消隐图')
总结
以上就是绘图函数的部分代码示例和功能,还有更多有趣的函数,欢迎交流~


 1万+
1万+


 被折叠的 条评论
为什么被折叠?
被折叠的 条评论
为什么被折叠?
 到【灌水乐园】发言


