echart中的:graphic;直接加进去就可以
graphic: {
type: 'text',
left: 'center',
top: 'center',
zlevel: 100,
style: {
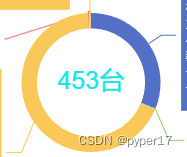
text: '{b|'+allTotal+'台}',
rich: {
b: {
fontSize: 25, // 不同样式的字号
}
},
fill: '#15E5E5', // 文本颜色
textAlign: 'center',
letterSpacing: 3 // 设置字间距
}
},
graphic里面还可以添加很多层
graphic: [
{
type: 'group', // 图形类型为group,可以包含多个子图形元素
left: 'center',
top: 'center',
children: [
/* {
type: 'circle', // 子图形元素类型为circle,圆形
z: 80, // 设置z轴高度,确保在饼状图上层显示
left: 'center',
top: 'center',
shape: {
r: 47, // 半径,控制圆形大小
},
style: {
stroke: '#05688D', // 边框颜色
lineWidth: 2, // 边框线宽
lineDash: [5, 5], // 虚线
}
},
{
type: 'circle',
z: 80, // 设置z轴高度,确保在饼状图上层显示
left: 'center',
top: 'center',
shape: {
cx: 0,
cy: 0,
r: 45, // 半径,控制圆形大小
},
style: {
fill: new echarts.graphic.RadialGradient(0.5, 0.5, 0.5, [
{
offset: 0,
color: '#006BC9'
},
{
offset: 1,
color: '#002B50'
}
]),
stroke: 'transparent', // 边框颜色设置为透明
lineWidth: 0, // 边框线宽设置为0,确保没有边框
}
}, */
{
type: 'text', // 子图形元素类型为text,文本
z: 80, // 设置z轴高度
left: 'center',
top: 'center',
style: {
text:
`{a|总数}\n{b|${numValue}}{a|${numUnit}}`, // 文本内容
rich: {
a: {
fontSize: 15,
fontFamily: 'PingFang Bold',
color: '#00FFFF',
lineHeight: 25, // 设置行高
},
b: {
fontSize: 25, // 不同样式的字号
color: '#FF0000', // 不同样式的颜色
fontFamily: "DS-DIGI-1",// 其他样式属性
},
},
fill: '#00FFFF', // 文本颜色
textAlign: 'center',
letterSpacing: 3, // 设置字间距
}
}
]
}
]