


博主介绍:✌全网粉丝10W+,前互联网大厂软件研发、集结硕博英豪成立工作室。专注于计算机相关专业项目实战6年之久,选择我们就是选择放心、选择安心毕业✌
> 🍅想要获取完整文章或者源码,或者代做,拉到文章底部即可与我联系了。🍅🍅感兴趣的可以先收藏起来,点赞、关注不迷路,大家在毕设选题,项目以及论文编写等相关问题都可以给我留言咨询,希望帮助同学们顺利毕业 。🍅
1、毕业设计:2025年计算机专业毕业设计选题汇总(建议收藏)✅
1、项目介绍
技术栈:
基于python 的假期旅游数据分析可视化系统
Flask框架、Echarts可视化、HTML
2、项目界面
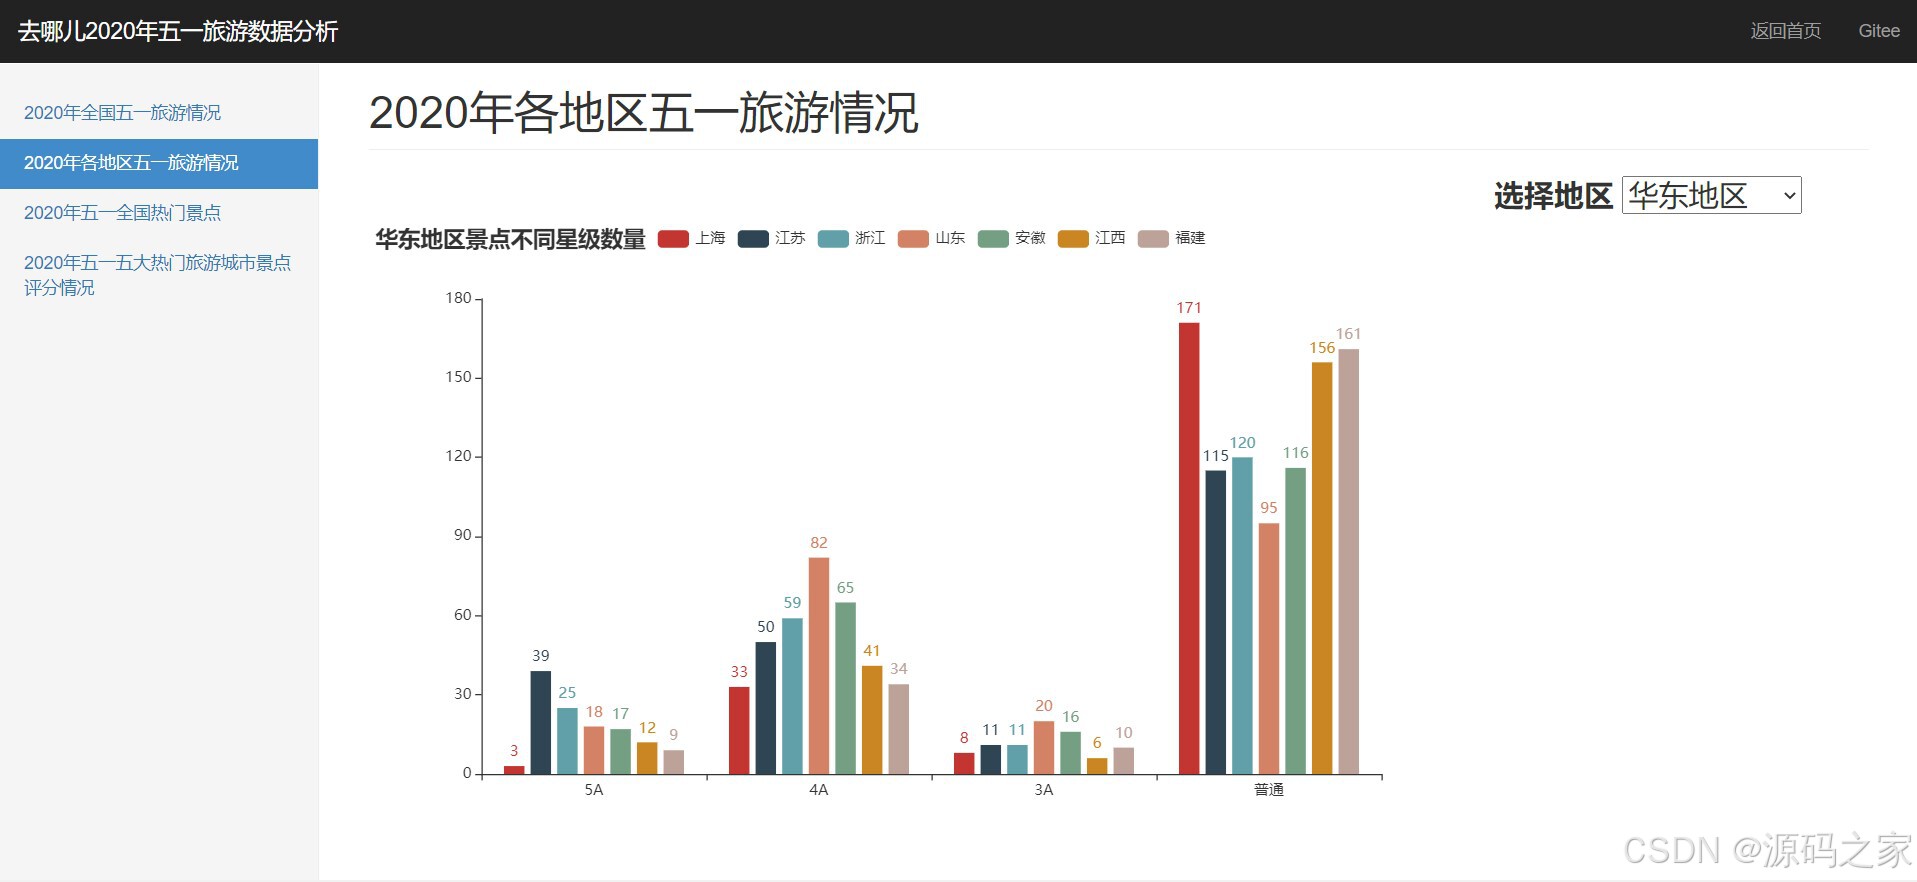
(1)各地五一旅游情况
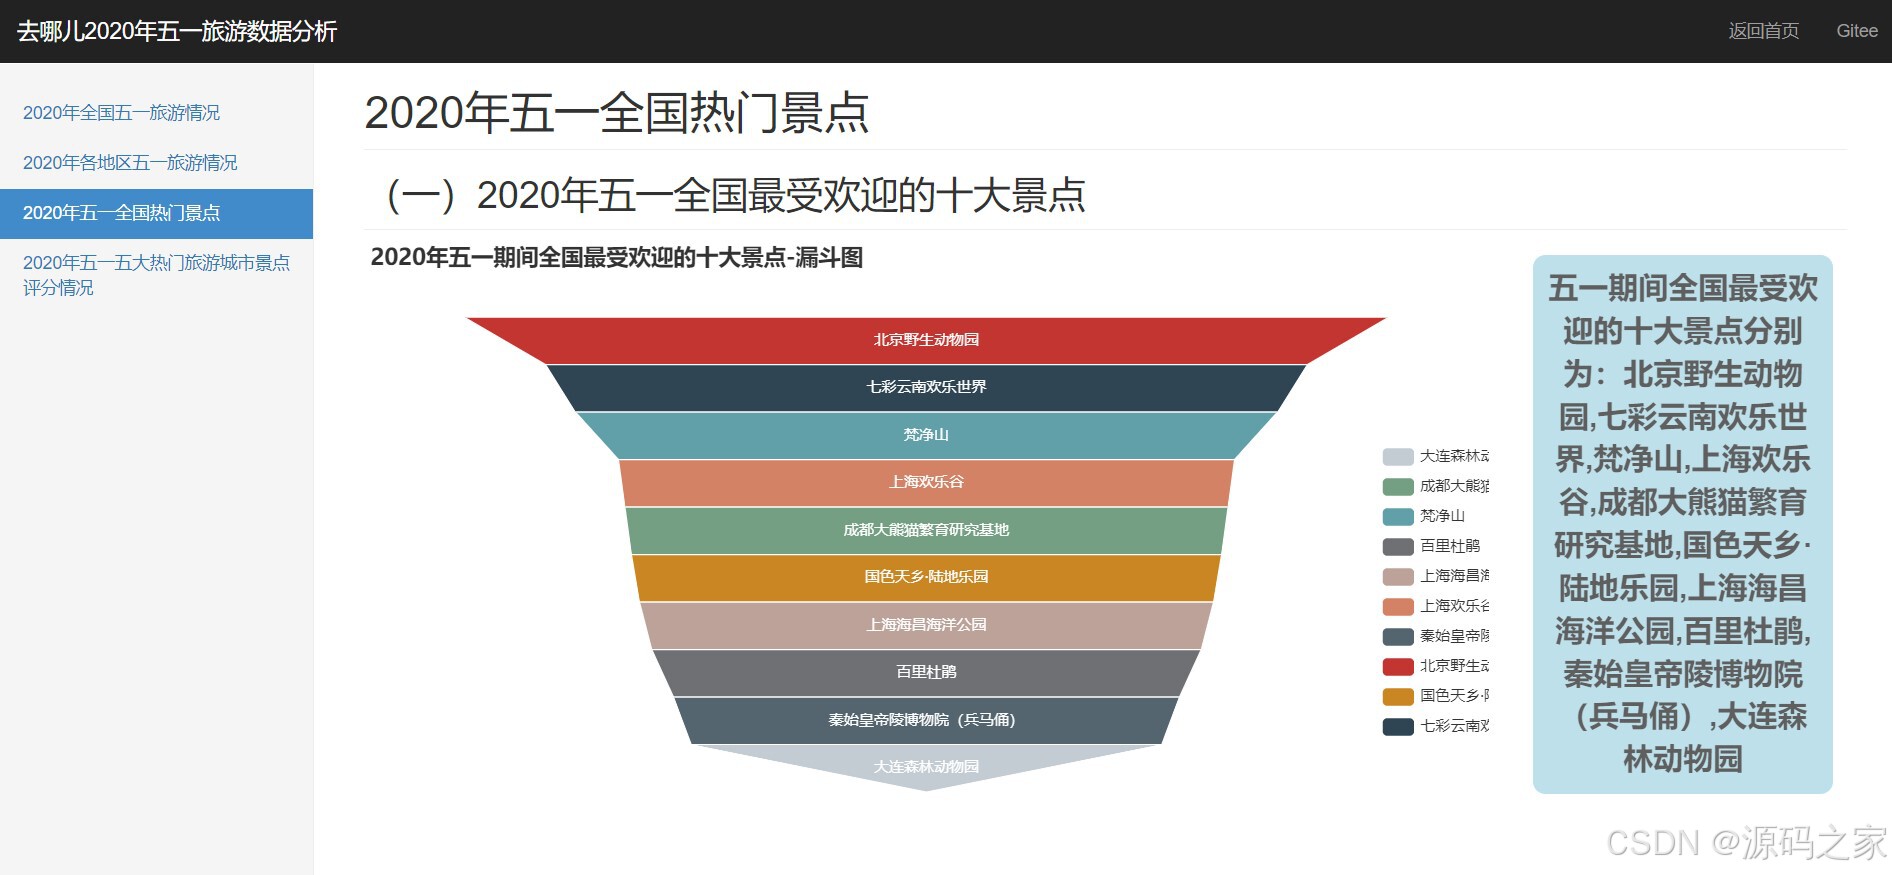
(2)各地五一全国热门景点
(3)各地五一全国热门景点-词云图

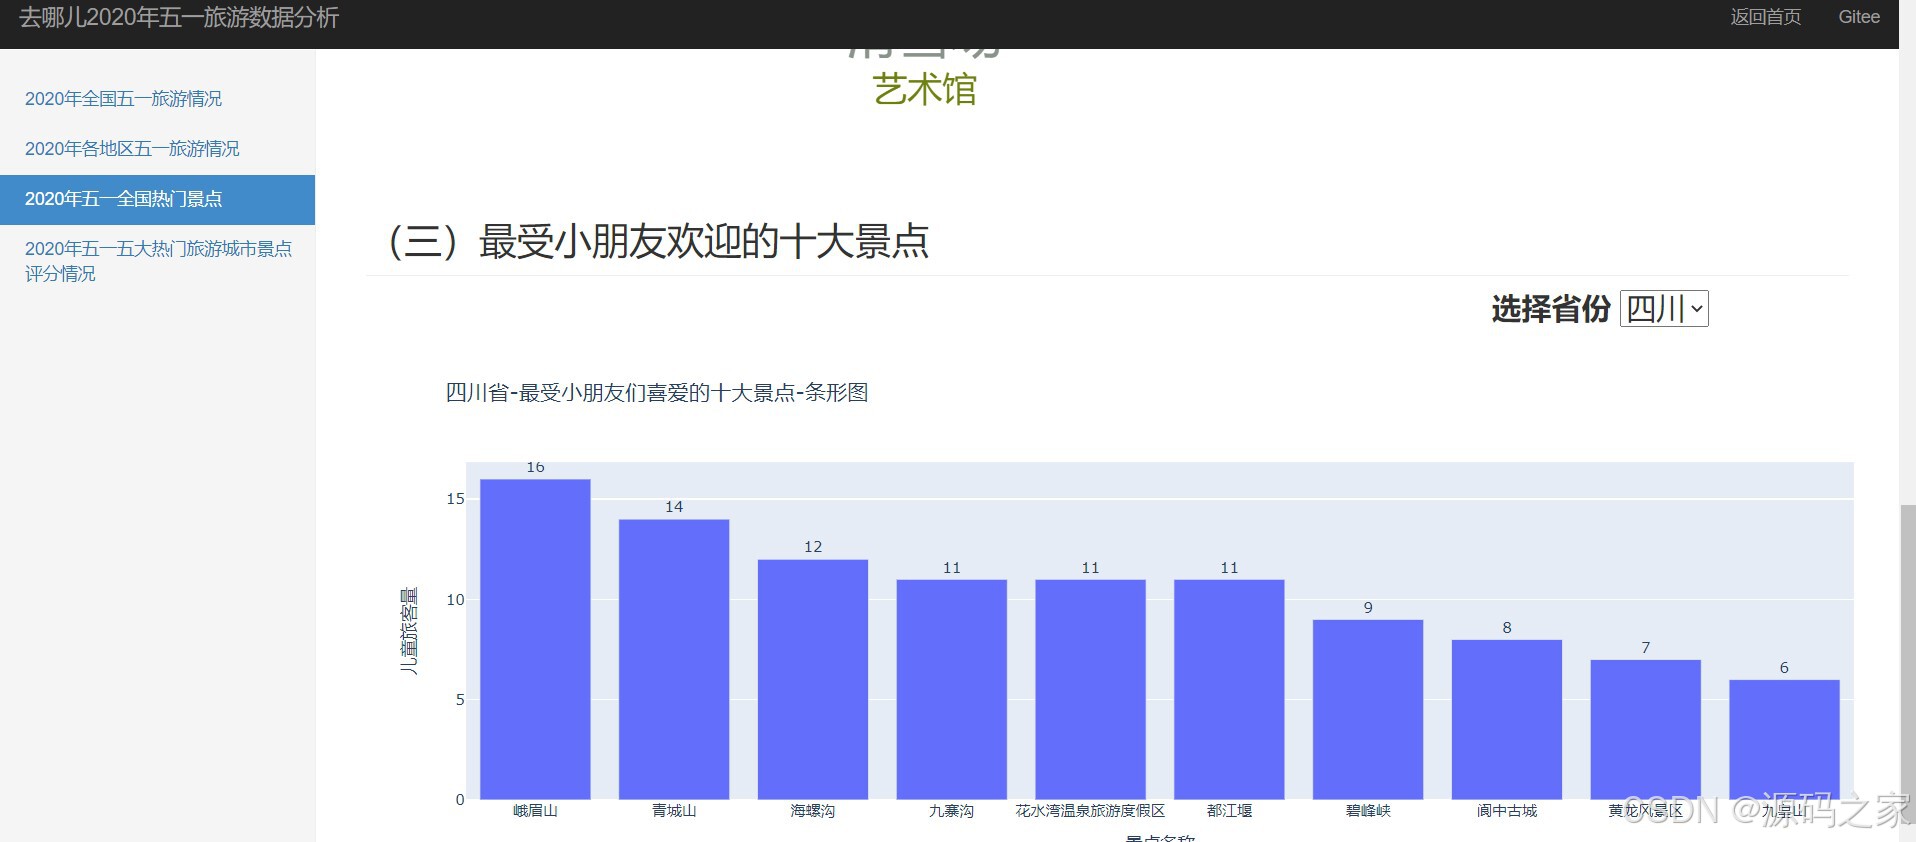
(4)各地五一全国热门景点-条形图
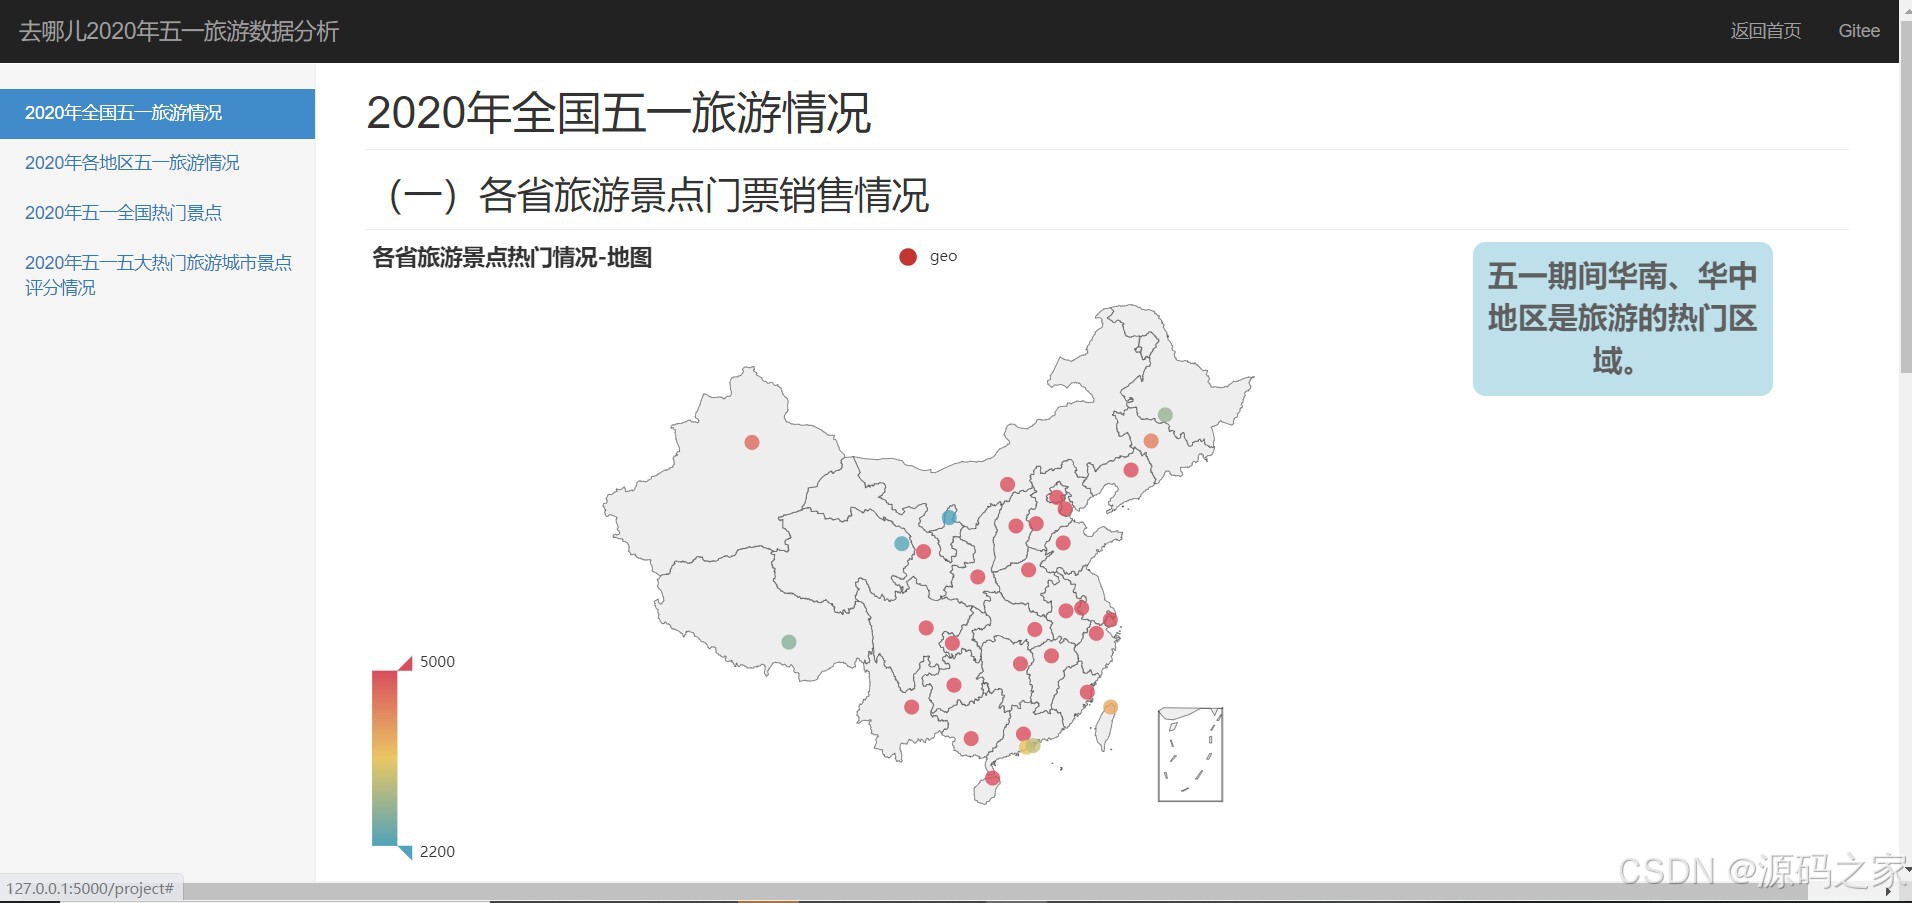
(5)全国五一旅游情况-各省分布地图
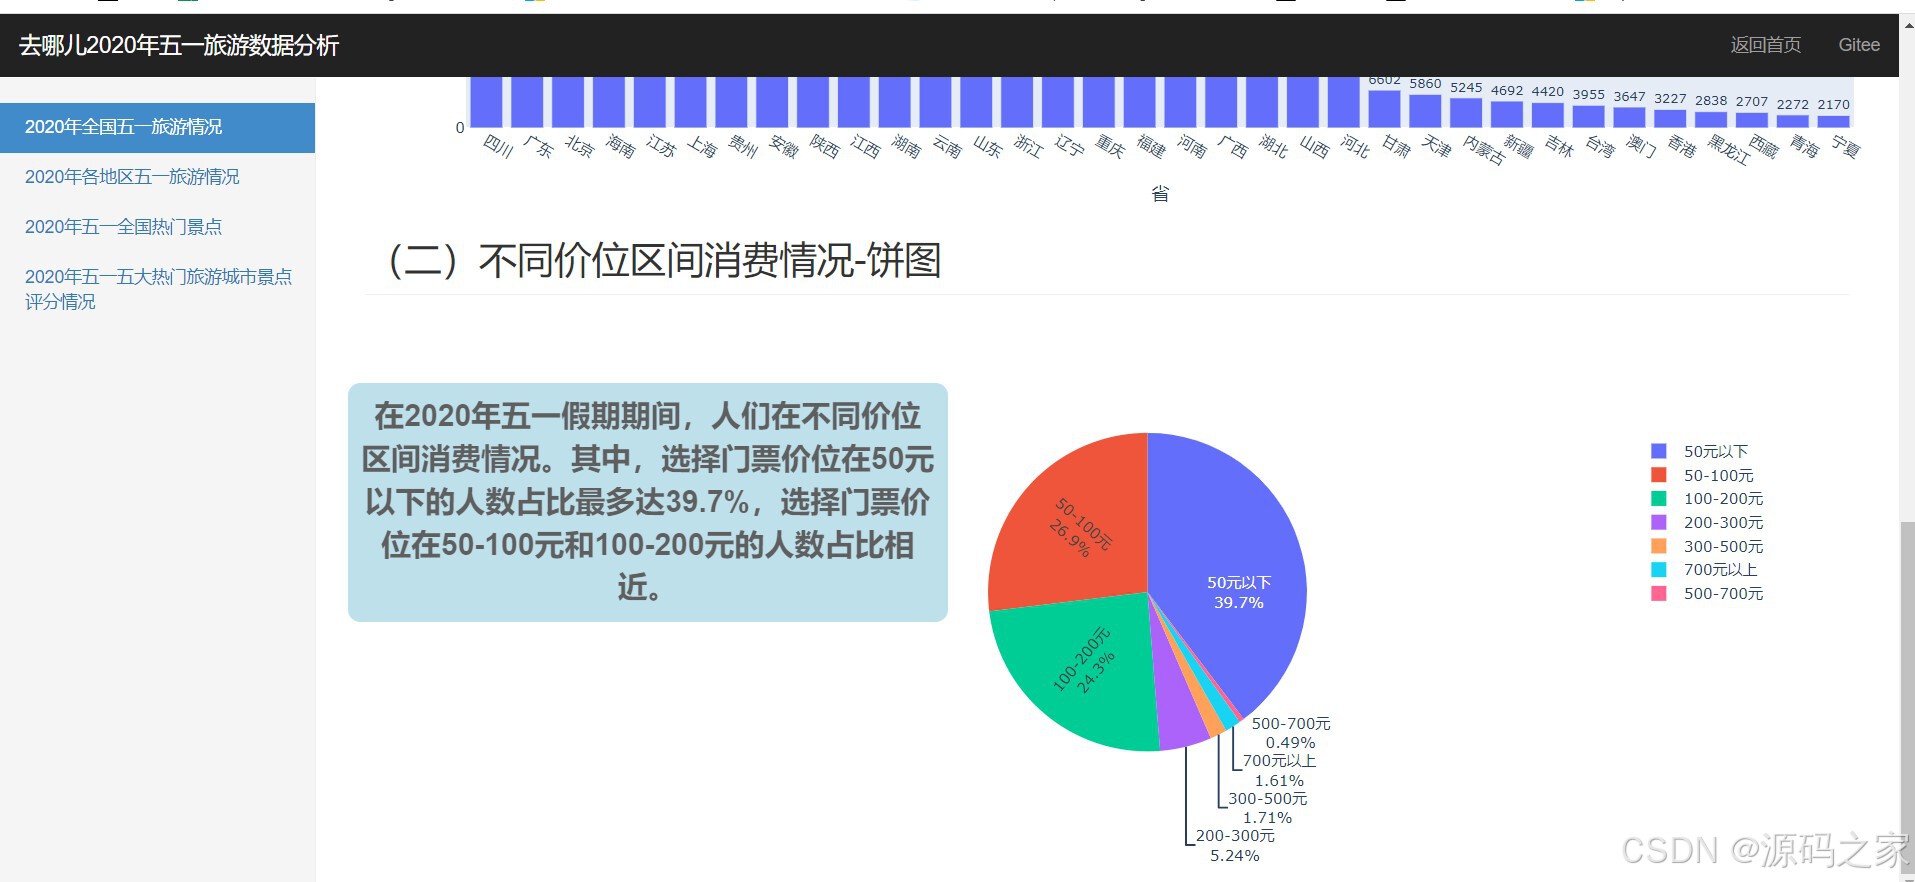
(6)全国五一旅游情况-扇形图分析
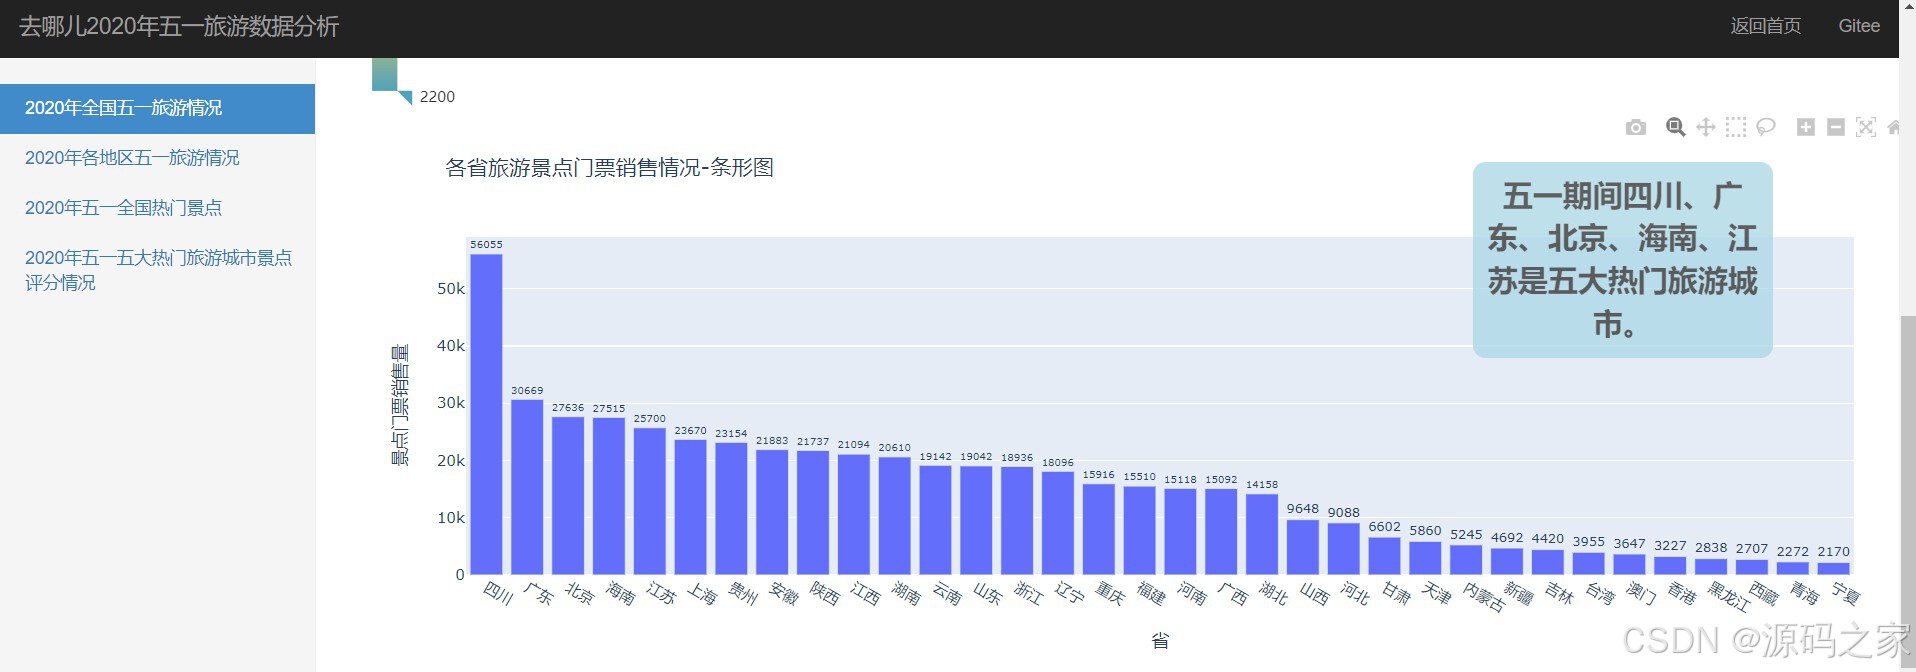
(7)全国五一旅游情况-条形图
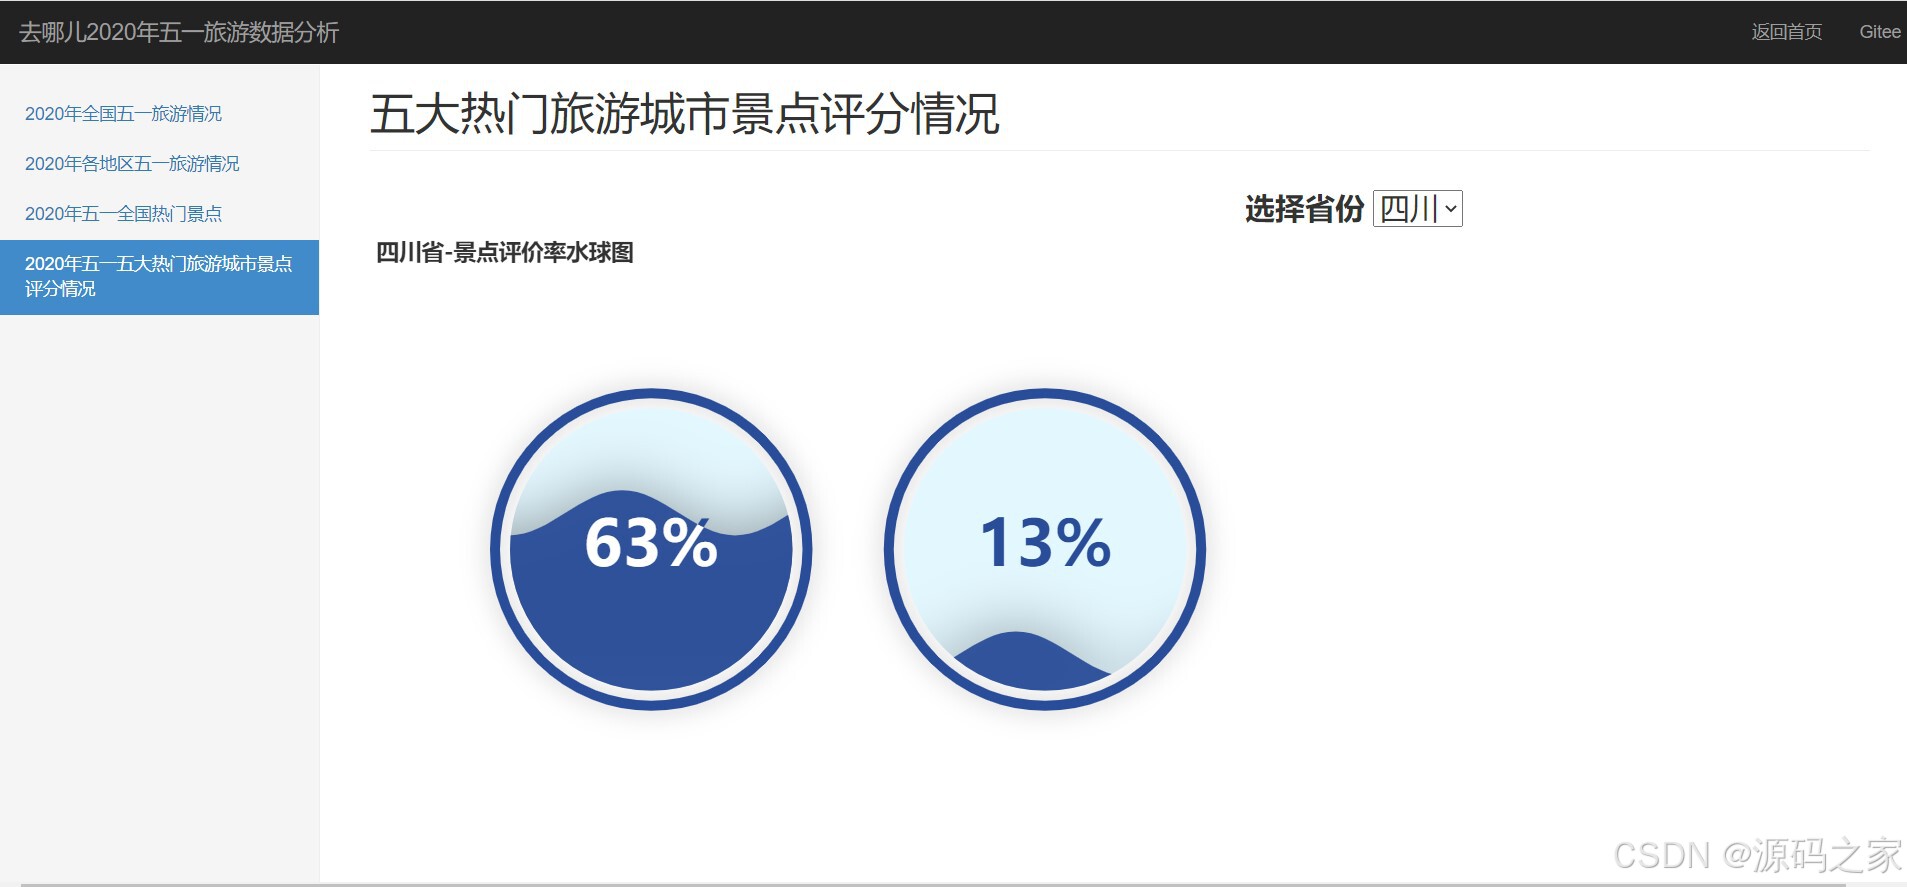
(8)五一五大热门旅游城市景点评分情况
(9)系统首页

3、项目说明
根据提供的内容,这个基于Python的假期旅游数据分析可视化系统的功能模块可以描述如下:
- 数据展示模块
功能描述:该模块负责展示各类旅游数据,包括但不限于各地五一旅游情况、全国热门景点、景点词云图、各省分布地图、扇形图分析、条形图等。这些展示形式直观反映了五一假期的旅游趋势、热门景点、游客分布等信息。
界面元素:包含多个图表和地图,如Echarts生成的词云图、条形图、扇形图,以及HTML页面中的地图元素等。 - 数据查询模块
功能描述(隐含):虽然具体界面未展示,但考虑到系统的实用性,应包含数据查询功能。用户可以通过输入关键词、选择时间范围等方式,查询特定的旅游数据。
技术实现:可能通过Flask框架提供的路由和视图函数实现数据查询接口,用户通过前端页面提交查询请求,后端处理并返回查询结果。 - 用户交互模块
功能描述:该模块负责处理用户与系统之间的交互,如用户点击图表查看详细信息、选择不同的数据展示方式等。
界面元素:包括按钮、下拉菜单、滑动条等HTML元素,以及Echarts提供的交互功能,如点击事件、鼠标悬停提示等。 - 数据可视化配置模块
功能描述(隐含):系统应提供数据可视化的配置功能,允许用户根据需要调整图表的样式、数据范围、颜色等。
技术实现:可能通过Flask后端提供配置接口,前端页面通过JavaScript或Echarts的配置选项实现可视化效果的调整。 - 系统管理模块
功能描述(隐含):考虑到系统的维护和管理需求,应包含系统管理模块,负责用户管理、权限控制、数据备份与恢复等功能。
界面元素:可能包括用户登录/注册页面、权限管理页面、数据备份与恢复页面等。这些页面通常不包含在前述数据展示页面中,但它们是系统正常运行不可或缺的部分。 - 数据处理与分析模块
功能描述(后台):该模块是系统的核心部分,负责数据的收集、清洗、处理和分析。它根据用户需求生成各类统计图表和数据报告。
技术实现:可能使用Python的pandas、numpy等库进行数据处理和分析,使用Echarts等库进行数据可视化。Flask框架作为后端服务器,提供数据接口和页面渲染服务。
4、核心代码
from flask import Flask, render_template,request
from pyecharts.charts import Bar
from pyecharts.charts import Geo
from pyecharts.charts import Map
from pyecharts.globals import ChartType, SymbolType
from pyecharts import options as opts
import pandas as pd
import matplotlib.pyplot as plt
import plotly as py
import plotly.graph_objs as go
import plotly.graph_objects as go
from function import payment
from pyecharts.faker import Faker
from pyecharts.charts import WordCloud
from pyecharts.charts import Grid, Liquid
from pyecharts.commons.utils import JsCode
from pyecharts.charts import Funnel
from pyecharts.faker import Faker
from picture import reli,hd,hn,hb,hz,xn,xb,gat,db,jingdian,gd,js,hain,bj,sc,gdr,bjr,jsr,hnr

app = Flask(__name__)


# 基于python Flask的 假期旅游数据的可视化分析系统

# 首页
@app.route('/')
def shouye():
    return render_template(
        "index.html"
    )

# 项目页
@app.route('/project')
def xiangmu():
	 # 各省旅游景点门票销售情况

    with open("geo_base.html", encoding="utf8", mode="r") as f:
        plot_all3 = "".join(f.readlines())


    with open("各省旅游景点门票销售情况.html", encoding="utf8", mode="r") as f:
        plot_all1 = "".join(f.readlines())

    with open("不同价位区间消费情况.html", encoding="utf8", mode="r") as f:
        plot_all2 = "".join(f.readlines())

    return render_template(
        "project.html",the_plot_all1 = plot_all1,the_plot_all2 = plot_all2,the_plot_all3=plot_all3
    )


# 各地区五一旅游情况
@app.route('/zone')
def zone_travle():
	with open("华东地区景点不同星级数量.html", encoding="utf8", mode="r") as f:
		plot_all4 = "".join(f.readlines())
		return render_template(
			"zone.html",the_plot_all4 = plot_all4
			)

# 各地区五一旅游情况
@app.route('/huanan')
def huanan_travle():
	with open("华南地区景点不同星级数量.html", encoding="utf8", mode="r") as f:
		plot_all4 = "".join(f.readlines())
		return render_template(
			"zone.html",the_plot_all4 = plot_all4
			)

@app.route('/huabei')
def huabei_travle():
	with open("华北地区景点不同星级数量.html", encoding="utf8", mode="r") as f:
		plot_all4 = "".join(f.readlines())
		return render_template(
			"zone.html",the_plot_all4 = plot_all4
			)

@app.route('/huazhong')
def huazhong_travle():
	with open("华中地区景点不同星级数量.html", encoding="utf8", mode="r") as f:
		plot_all4 = "".join(f.readlines())
		return render_template(
			"zone.html",the_plot_all4 = plot_all4
			)

@app.route('/xinan')
def xinan_travle():
	with open("西南地区景点不同星级数量.html", encoding="utf8", mode="r") as f:
		plot_all4 = "".join(f.readlines())
		return render_template(
			"zone.html",the_plot_all4 = plot_all4
			)

@app.route('/xibei')
def xibei_travle():
	with open("西北地区景点不同星级数量.html", encoding="utf8", mode="r") as f:
		plot_all4 = "".join(f.readlines())
		return render_template(
			"zone.html",the_plot_all4 = plot_all4
			)

@app.route('/dongbei')
def dongbei_travle():
	with open("东北地区景点不同星级数量.html", encoding="utf8", mode="r") as f:
		plot_all4 = "".join(f.readlines())
		return render_template(
			"zone.html",the_plot_all4 = plot_all4
			)

@app.route('/gangaotai')
def gangaotai_travle():
	with open("港澳台地区景点不同星级数量.html", encoding="utf8", mode="r") as f:
		plot_all4 = "".join(f.readlines())
		return render_template(
			"zone.html",the_plot_all4 = plot_all4
			)

@app.route('/sightseeing')
def sightseeing():
	with open("五一期间全国最受欢迎的十大景点-漏斗图.html", encoding="utf8", mode="r") as f:
		plot_all8 = "".join(f.readlines())

	with open("五一全国热门景点类型-词云图.html", encoding="utf8", mode="r") as f:
		plot_all5 = "".join(f.readlines())

	with open("四川省-最受小朋友们喜爱的十大景点.html", encoding="utf8", mode="r") as f:
		plot_all6 = "".join(f.readlines())

		return render_template(
			"sightseeing.html",the_plot_all5 = plot_all5,the_plot_all6=plot_all6,the_plot_all8=plot_all8
			)


@app.route('/guangdong')
def guangdong():
	with open("五一期间全国最受欢迎的十大景点-漏斗图.html", encoding="utf8", mode="r") as f:
		plot_all8 = "".join(f.readlines())

	with open("五一全国热门景点类型-词云图.html", encoding="utf8", mode="r") as f:
		plot_all5 = "".join(f.readlines())

	    # 条形图的绘制
	with open("广东省-最受小朋友们喜爱的十大景点.html", encoding="utf8", mode="r") as f:
		plot_all6 = "".join(f.readlines())

		return render_template(
			"sightseeing.html",the_plot_all5 = plot_all5,the_plot_all6 = plot_all6,the_plot_all8 = plot_all8
			)

@app.route('/beijing')
def beijing():
	with open("五一期间全国最受欢迎的十大景点-漏斗图.html", encoding="utf8", mode="r") as f:
		plot_all8 = "".join(f.readlines())

	with open("五一全国热门景点类型-词云图.html", encoding="utf8", mode="r") as f:
		plot_all5 = "".join(f.readlines())

	with open("北京省-最受小朋友们喜爱的十大景点.html", encoding="utf8", mode="r") as f:
		plot_all6 = "".join(f.readlines())

		return render_template(
			"sightseeing.html",the_plot_all5 = plot_all5,the_plot_all6 = plot_all6,the_plot_all8=plot_all8
			)

@app.route('/hainan')
def hainan():
	with open("五一期间全国最受欢迎的十大景点-漏斗图.html", encoding="utf8", mode="r") as f:
		plot_all8 = "".join(f.readlines())

	with open("五一全国热门景点类型-词云图.html", encoding="utf8", mode="r") as f:
		plot_all5 = "".join(f.readlines())

	with open("海南省-最受小朋友们喜爱的十大景点.html", encoding="utf8", mode="r") as f:
		plot_all6 = "".join(f.readlines())

		return render_template(
			"sightseeing.html",the_plot_all5 = plot_all5,the_plot_all6 = plot_all6,the_plot_all8=plot_all8
			)

@app.route('/jiangsu')
def jiangsu():
	with open("五一期间全国最受欢迎的十大景点-漏斗图.html", encoding="utf8", mode="r") as f:
		plot_all8 = "".join(f.readlines())

	with open("五一全国热门景点类型-词云图.html", encoding="utf8", mode="r") as f:
		plot_all5 = "".join(f.readlines())

	with open("江苏省-最受小朋友们喜爱的十大景点.html", encoding="utf8", mode="r") as f:
		plot_all6 = "".join(f.readlines())

		return render_template(
			"sightseeing.html",the_plot_all5 = plot_all5,the_plot_all6 = plot_all6,the_plot_all8=plot_all8
			)


@app.route('/rate')
def rate():
	with open("四川省-景点评价率水球图.html", encoding="utf8", mode="r") as f:
		plot_all7 = "".join(f.readlines())

		return render_template(
			"rate.html",the_plot_all7 = plot_all7
			)

@app.route('/gd_rate')
def gd_rate():
	with open("广东省-景点评价率水球图.html", encoding="utf8", mode="r") as f:
		plot_all7 = "".join(f.readlines())

		return render_template(
			"rate.html",the_plot_all7 = plot_all7
			)

@app.route('/bj_rate')
def bj_rate():
	with open("北京市-景点评价率水球图.html", encoding="utf8", mode="r") as f:
		plot_all7 = "".join(f.readlines())

		return render_template(
			"rate.html",the_plot_all7 = plot_all7
			)

@app.route('/hn_rate')
def hn_rate():
	with open("海南省-景点评价率水球图.html", encoding="utf8", mode="r") as f:
		plot_all7 = "".join(f.readlines())

		return render_template(
			"rate.html",the_plot_all7 = plot_all7
			)

@app.route('/js_rate')
def js_rate():
	with open("江苏省-景点评价率水球图.html", encoding="utf8", mode="r") as f:
		plot_all7 = "".join(f.readlines())

		return render_template(
			"rate.html",the_plot_all7 = plot_all7
			)

if __name__ == '__main__':
    app.run(
        debug=True
    )
5、项目获取
biyesheji0005 或 bysjbysj (绿色聊天软件)
🍅由于篇幅限制,获取完整文章或源码、代做项目的,查看我的【用户名】、【专栏名称】、【顶部选题链接】就可以找到我啦🍅
感兴趣的可以先收藏起来,点赞、关注不迷路,下方查看👇🏻获取联系方式👇🏻


 被折叠的 条评论
为什么被折叠?
被折叠的 条评论
为什么被折叠?
 到【灌水乐园】发言


