


GDB的用法
在linux系统中,很多时候程序出了bug比如段错误Segmentation fault,程序代码量太大,我们不得不使用调试工具,常见的linux调试工具就是gdb.为何使用gdb调试我们的程序,我们需要将调试信息生成到可执行文件中,在编译的时候加入-g选项,如果不加入-g选项,比如 我们在进行gdb中使用list命令查看源代码时,可能会出现以下错误:
(gdb) list
没有符号表被读取。请使用 "file" 命令
因此加入-g选项能够方便我们使用gdb进行调试
gcc -g test.c -o test
GDB的基本命令:
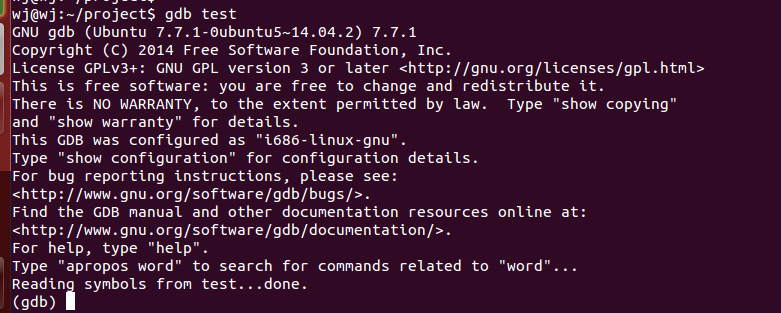
- gdb 可执行文件名:开使GDB调试,例如,可执行文件test,那么命令就是gdb test。
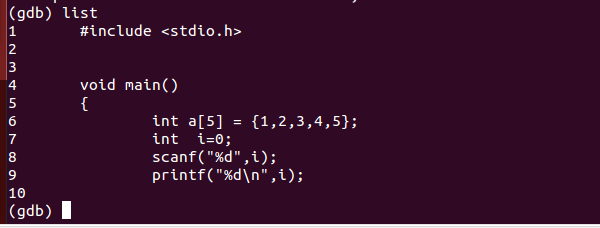
list:打印出源代码
- break 行号:在指定行设置行号

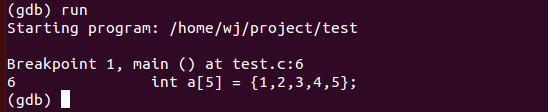
- run:运行可执行程序,会在断点处停止
- next:执行下一步,使用该条命令会单步执行
- continue:继续执行可执行程序,如果有断点会执行到下一个断点处,否则会执行到程序结束
通常来讲我们会首先判断程序可能在哪出错,然后在那个位置前面加入断点,然后单步调试就ok了,当然很多人可能觉得这样很不方便,因为需要我们去设置断点,那么还有一种就简单的方式来调试程序,那就是分析coredump。
CoreDump
coredump会在我们的程序出现错误的时候生成。
ulimit -c
在linux下输入这个指令,如返回0,coredump是不会生成的,如果需要生成我们可以执行
ulimit -c unlimited
生成的coredump文件会存放在跟可执行文件同一级目录中,下面是一个会产生段错误的代码以此来演示如果生成和使用coredump:
#include <stdio.h>


void main()
{
    int a[5] = {1,2,3,4,5};
    int  i=0;
    scanf("%d",i);
    printf("%d\n",i);


}
大家可以看到scanf处是有问题的,那么我们首先编译 然后执行
wj@wj:~/project$ gcc -g test.c -o test
test.c: In function ‘main’:
test.c:8:2: warning: format ‘%d’ expects argument of type ‘int *’, but argument 2 has type ‘int’ [-Wformat=]
  scanf("%d",i);
  ^
wj@wj:~/project$ ./test
111
段错误 (核心已转储)
在我们输入111后产生段错误 ,程序中断,这时在test的同级目录我们发现多了一个core文件,这就是我们要找的coredump文件,然后我们利用gdb对core文件进行分析
gdb 可执行文件名 core文件名例如:
wj@wj:~/project$ gdb test core
GNU gdb (Ubuntu 7.7.1-0ubuntu5~14.04.2) 7.7.1
Copyright (C) 2014 Free Software Foundation, Inc.
License GPLv3+: GNU GPL version 3 or later <http://gnu.org/licenses/gpl.html>
This is free software: you are free to change and redistribute it.
There is NO WARRANTY, to the extent permitted by law.  Type "show copying"
and "show warranty" for details.
This GDB was configured as "i686-linux-gnu".
Type "show configuration" for configuration details.
For bug reporting instructions, please see:
<http://www.gnu.org/software/gdb/bugs/>.
Find the GDB manual and other documentation resources online at:
<http://www.gnu.org/software/gdb/documentation/>.
For help, type "help".
Type "apropos word" to search for commands related to "word"...
Reading symbols from test...done.

warning: exec file is newer than core file.
[New LWP 23280]
Core was generated by `./test'.
Program terminated with signal SIGSEGV, Segmentation fault.
#0  0xb7623e90 in _IO_vfscanf_internal (s=0xb777fc20 <_IO_2_1_stdin_>, format=format@entry=0x8048560 "%d", argptr=argptr@entry=0xbff29c34 "", errp=errp@entry=0x0) at vfscanf.c:1857
1857    vfscanf.c: 没有那个文件或目录.
(gdb)
然后我们再执行where命令
(gdb) where
#0  0xb7623e90 in _IO_vfscanf_internal (s=0xb777fc20 <_IO_2_1_stdin_>, format=format@entry=0x8048560 "%d", argptr=argptr@entry=0xbff29c34 "", errp=errp@entry=0x0) at vfscanf.c:1857
#1  0xb762afc6 in __isoc99_scanf (format=0x8048560 "%d") at isoc99_scanf.c:37
#2  0x080484ba in main () at test.c:8
(gdb)
可以看到gdb提示我们在test.c的第8行出现了问题,当我们的代码量很大时,让linux生成coredump文件,再通过gdb分析


 1万+
1万+


 被折叠的 条评论
为什么被折叠?
被折叠的 条评论
为什么被折叠?
 到【灌水乐园】发言


