


视图
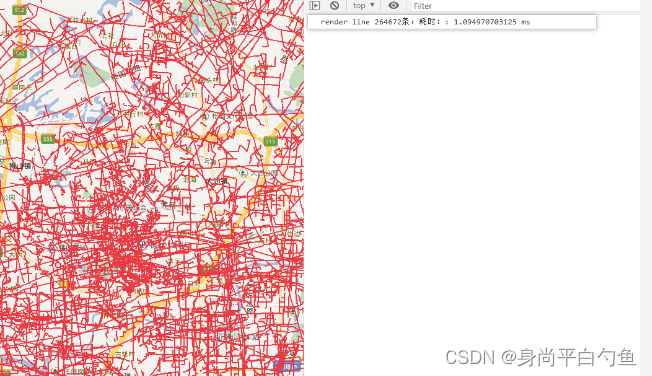
渲染20万条线耗时1s,程序运行1.1ms。
注: 使用百度地图画线api(Polyline),多次调用页面卡顿。使用canvas绘制对应的点,核心使用pointToPixel api把地图坐标点转换成页面像素点。
使用
// 直接new LineLayer(), 参数类型为LineOpts
type DATA = {
  lat_start: number,
  lon_end: number,
  lon_start: number,
  lat_end: number,
}

interface LineOpts {
  data: Array<DATA>,
  lineColor?: string,
  lineWidth?: number,
}
  init () {
    this.map = new BMap.Map(this.id, {minZoom: 11, maxZoom: 18} as any);
    this.map.addControl(new BMap.ScaleControl());
    this.map.enableScrollWheelZoom(true);
    this.map.centerAndZoom(new BMap.Point(this.center[0], this.center[1]), 11);
    let lineData = LINEDATA.concat(LINEDATA).concat(LINEDATA).concat(LINEDATA)
    console.time('render line ' + lineData.length + '条,耗时:');
    new LineLayer(this.map, {
      data: lineData,
      lineWidth: 1,
      lineColor: '#eb3941',
    });
    console.timeEnd('render line ' + lineData.length + '条,耗时:');
  }
实现类
- canvas类,准备自适应画布,实现鼠标事件。
export default class CavasLayer { opts; canvas: HTMLCanvasElement; paneName: string; zIndex: number; map; dragIng: boolean; cls: string; timeoutID: number; currentMapZoom: number; constructor (opts) { this.opts = opts || {}; this.map = opts.map; this.paneName = this.opts.paneName || 'markerPane'; this.zIndex = this.opts.zIndex || 0; this.cls = opts.cls; this.dragIng = false; this.canvas = document.createElement('canvas'); this.initialize(); this.draw(); this.timeoutID = -1; this.currentMapZoom = 15; } initialize () { let ctx = this.canvas.getContext('2d'); this.canvas.className = this.cls || "line-canvas" this.canvas.style.cssText = 'position:absolute;' + 'left:0;' + 'top:0;' + 'z-index:' + this.zIndex + ';'; this.adjustSize(); this.adjustRatio(ctx); this.map.getPanes()[this.paneName].appendChild(this.canvas); this.map.addEventListener('resize', () => { this.adjustSize(); this._draw(); }); this.map.addEventListener('zoomend', () => { this.opts.clearLine && this.opts.clearLine(this.canvas); this.dragIng = false; this.draw(); }); this.map.addEventListener('zoomstart', () => { this.dragIng = true; }); } adjustSize () { let size = this.map.getSize(); let canvas = this.canvas; canvas.width = size.width; canvas.height = size.height; canvas.style.width = canvas.width + 'px'; canvas.style.height = canvas.height + 'px'; } adjustRatio (ctx) { let backingStore = ctx.backingStorePixelRatio || ctx.webkitBackingStorePixelRatio || ctx.mozBackingStorePixelRatio || ctx.msBackingStorePixelRatio || ctx.oBackingStorePixelRatio || ctx.backingStorePixelRatio || 1; let pixelRatio = (window.devicePixelRatio || 1) / backingStore; let canvasWidth = ctx.canvas.width; let canvasHeight = ctx.canvas.height; ctx.canvas.width = canvasWidth * pixelRatio; ctx.canvas.height = canvasHeight * pixelRatio; ctx.canvas.style.width = canvasWidth + 'px'; ctx.canvas.style.height = canvasHeight + 'px'; ctx.scale(pixelRatio, pixelRatio); } draw () { if (this.dragIng && this.opts.saveLine) return; let self = this; clearTimeout(self.timeoutID); self.timeoutID = setTimeout(function () { self._draw(); }, 15); } _draw () { let map = this.map; this.currentMapZoom = Math.ceil(map.getZoom()); let size = map.getSize(); let center = map.getCenter(); if (center) { let pixel = map.pointToOverlayPixel(center); this.canvas.style.left = pixel.x - size.width / 2 + 'px'; this.canvas.style.top = pixel.y - size.height / 2 + 'px'; this.update.call(this); } } update () {} }- LineLayer 图层 - 线
	import CanvasLayer from "./CavasLayer";
	import Line from "./Line";
	export default class LineLayer extends CanvasLayer {
	  map;
	  options;
	  lines;
	  constructor (map, opts: LineOpts) {
	    super({
	      map: map,
	    });
	    this.map = map;
	    this.lines = [];
	    this.options = opts;
	  }
	  update () {
	    let baseCtx = this.canvas.getContext('2d') as CanvasRenderingContext2D ;
	    baseCtx.clearRect(0, 0, this.options.width, this.options.height);
	    this.lines.forEach((item, ) => {
	        item.draw(baseCtx, true);
	    });
	    this.options.data.forEach((l, i) => {
	        let L: Line = new Line(
	          {
	            path: [
	              new BMap.Point(l.lon_start, l.lat_start),
	              new BMap.Point(l.lon_end, l.lat_end)
	            ],
	            lineColor: this.options.lineColor,
	            lineWidth: this.options.lineWidth,
	          },
	          this.map
	        )
	        L.draw(baseCtx)
	    });
	  }
	}
3 Line- 线type xy = { x: number; y: number } interface OfflineMapConstructor { pointToPixel (p): never; } export default class Line { path; map: OfflineMapConstructor; lineColor: string; lineWidth: number; constructor (opts, map) { this.path = opts.path; this.lineColor = opts.lineColor || "#409fee"; this.lineWidth = opts.lineWidth || 2; this.map = map } getPointList (): xy[] { var points = [], path = this.path; if (path && path.length > 0) { points = [ this.map.pointToPixel(path[0]), this.map.pointToPixel(path[1]) ] } return points; } draw (ctx) { var pointList = this.getPointList(); ctx.save(); ctx.beginPath(); ctx.lineWidth = this.lineWidth; ctx.strokeStyle = this.lineColor; ctx.moveTo(pointList[0].x, pointList[0].y); ctx.lineTo(pointList[1].x, pointList[1].y) ctx.closePath(); ctx.stroke(); ctx.restore(); } }
优化(百万数据)
1. 根据数据的条数,分多个画布绘制线;目前10万条以内的线放到一个画布里面无卡顿;
2. 添加可视范围,只渲染范围内的数据线;随视图缩放,平移添加渲染交互。


 2208
2208


 被折叠的 条评论
为什么被折叠?
被折叠的 条评论
为什么被折叠?
 到【灌水乐园】发言


