


python for data analysis 操作usagov_bitly_data示例
import json
path = 'ch02/usagov_bitly_data2012-03-16-1331923249.txt'
records = [json.loads(line) for line in open(path)]
In [18]: records[0]
Out[18]:
{u'a': u'Mozilla/5.0 (Windows NT 6.1; WOW64) AppleWebKit/535.11 (KHTML, like
Gecko) Chrome/17.0.963.78 Safari/535.11',
u'al': u'en-US,en;q=0.8',
u'c': u'US',
u'cy': u'Danvers',
u'g': u'A6qOVH',
u'gr': u'MA',
u'h': u'wfLQtf',
u'hc': 1331822918,
u'hh': u'1.usa.gov',
u'l': u'orofrog',
u'll': [42.576698, -70.954903],
u'nk': 1,
u'r': u'http://www.facebook.com/l/7AQEFzjSi/1.usa.gov/wfLQtf',
u't': 1331923247,
u'tz': u'America/New_York',
u'u': u'http://www.ncbi.nlm.nih.gov/pubmed/22415991'}
In [19]: records[0]['tz']
Out[19]: u'America/New_York'
Counting Time Zones with pandas
In [289]: from pandas import DataFrame, Series
In [290]: import pandas as pd
In [291]: frame = DataFrame(records)
In [292]: frame
Out[292]:
<class 'pandas.core.frame.DataFrame'>
Int64Index: 3560 entries, 0 to 3559
Data columns:
_heartbeat_ 120 non-null values
a 3440 non-null values
al 3094 non-null values
c 2919 non-null values
cy 2919 non-null values
g 3440 non-null values
gr 2919 non-null values
h 3440 non-null values
hc 3440 non-null values
hh 3440 non-null values
kw 93 non-null values
l 3440 non-null values
ll 2919 non-null values
nk 3440 non-null values
r 3440 non-null values
t 3440 non-null values
tz 3440 non-null values
u 3440 non-null values
dtypes: float64(4), object(14)
In [293]: frame['tz'][:10]
Out[293]:
0 America/New_York
1 America/Denver
2 America/New_York
3 America/Sao_Paulo
4 America/New_York
5 America/New_York
6 Europe/Warsaw
7
8
9
Name: tz
The Series object returned by frame[‘tz’] has a method value_counts that gives us what we’re looking for:
In [294]: tz_counts = frame['tz'].value_counts()
In [295]: tz_counts[:10]
Out[295]:
America/New_York 1251
521
America/Chicago 400
America/Los_Angeles 382
America/Denver 191
Europe/London 74
Asia/Tokyo 37
Pacific/Honolulu 36
Europe/Madrid 35
America/Sao_Paulo 33
You can do a bit of munging to fill in a substitute value for unknown and missing time zone data in the records. The fillna function can replace missing (NA) values and unknown (empty strings) values can be replaced by boolean array indexing:
In [296]: clean_tz = frame['tz'].fillna('Missing')
In [297]: clean_tz[clean_tz == ''] = 'Unknown'
In [298]: tz_counts = clean_tz.value_counts()
In [299]: tz_counts[:10]
Out[299]:
America/New_York 1251
Unknown 521
America/Chicago 400
America/Los_Angeles 382
America/Denver 191
Missing 120
Europe/London 74
Asia/Tokyo 37
Pacific/Honolulu 36
Europe/Madrid 35
Making a horizontal bar plot can be accomplished using the plot method on the counts objects:
In [301]: tz_counts[:10].plot(kind='barh', rot=0)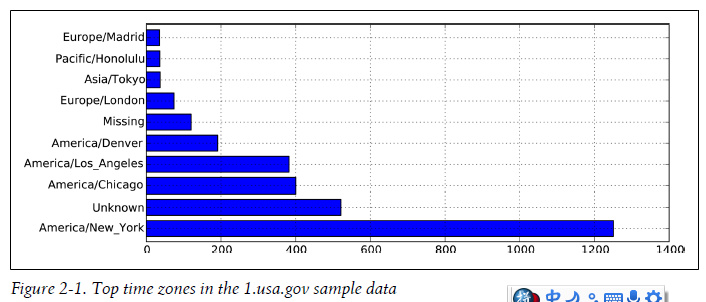
We’ll explore more tools for working with this kind of data. For example, the a field contains information about the browser, device, or application used to perform the URL shortening:
In [302]: frame['a'][1]
Out[302]: u'GoogleMaps/RochesterNY'
In [303]: frame['a'][50]
Out[303]: u'Mozilla/5.0 (Windows NT 5.1; rv:10.0.2) Gecko/20100101 Firefox/10.0.2'
In [304]: frame['a'][51]
Out[304]: u'Mozilla/5.0 (Linux; U; Android 2.2.2; en-us; LG-P925/V10e Build/FRG83G) AppleWebKit/533.1

In [305]: results = Series([x.split()[0] for x in frame.a.dropna()])
In [306]: results[:5]
Out[306]:
0 Mozilla/5.0
1 GoogleMaps/RochesterNY
2 Mozilla/4.0
3 Mozilla/5.0
4 Mozilla/5.0

In [307]: results.value_counts()[:8]
Out[307]:
Mozilla/5.0 2594
Mozilla/4.0 601
GoogleMaps/RochesterNY 121
Opera/9.80 34
TEST_INTERNET_AGENT 24
GoogleProducer 21
Mozilla/6.0 5
BlackBerry8520/5.0.0.681 4
suppose you wanted to decompose the top time zones into Windows and non-Windows users. As a simplification, let’s say that a user is on Windows if the string ‘Windows’ is in the agent string. Since some of the agents are missing, I’ll exclude these from the data:
In [308]: cframe = frame[frame.a.notnull()]
In [309]: operating_system = np.where(cframe['a'].str.contains('Windows'),
.....: 'Windows', 'Not Windows')
In [310]: operating_system[:5]
Out[310]:
0 Windows
1 Not Windows
2 Windows
3 Not Windows
4 Windows
Name: a

In [311]: by_tz_os = cframe.groupby(['tz', operating_system])
The group counts, analogous to the value_counts function above, can be computed using size. This result is then reshaped into a table with unstack:
In [312]: agg_counts = by_tz_os.size().unstack().fillna(0)
In [313]: agg_counts[:10]
Out[313]:
a Not Windows Windows
tz
245 276
Africa/Cairo 0 3
Africa/Casablanca 0 1
Africa/Ceuta 0 2
Africa/Johannesburg 0 1
Africa/Lusaka 0 1
America/Anchorage 4 1
America/Argentina/Buenos_Aires 1 0
America/Argentina/Cordoba 0 1
America/Argentina/Mendoza 0 1
Finally, let’s select the top overall time zones. To do so, I construct an indirect index array from the row counts in agg_counts:
# Use to sort in ascending order
In [314]: indexer = agg_counts.sum(1).argsort()
In [315]: indexer[:10]
Out[315]:
tz
24
Africa/Cairo 20
Africa/Casablanca 21
Africa/Ceuta 92
Africa/Johannesburg 87
Africa/Lusaka 53
America/Anchorage 54
America/Argentina/Buenos_Aires 57
America/Argentina/Cordoba 26
America/Argentina/Mendoza 55
I then use take to select the rows in that order, then slice off the last 10 rows:
In [316]: count_subset = agg_counts.take(indexer)[-10:]
In [317]: count_subset
Out[317]:
a Not Windows Windows
tz
America/Sao_Paulo 13 20
Europe/Madrid 16 19
Pacific/Honolulu 0 36
Asia/Tokyo 2 35
Europe/London 43 31
America/Denver 132 59
America/Los_Angeles 130 252
America/Chicago 115 285
245 276
America/New_York 339 912

In [319]: count_subset.plot(kind='barh', stacked=True)
The plot doesn’t make it easy to see the relative percentage of Windows users in the smaller groups, but the rows can easily be normalized to sum to 1 then plotted again
normed_subset = count_subset.div(count_subset.sum(1), axis=0)
normed_subset.plot(kind='barh', stacked=True)


 3327
3327


 被折叠的 条评论
为什么被折叠?
被折叠的 条评论
为什么被折叠?
 到【灌水乐园】发言


