


 本文介绍了如何在Python中实现多元线性回归,通过实战案例解析了该统计学方法,涉及相关理论与代码实现。
多元线性回归 python
Linear regression is a standard statistical data analysis technique. We use linear regression to determine the direct relationship between a dependent variable and one or more independent variables. The dependent variable must be measured on a continuous measurement scale, and the independent variable(s) can be measured on either a categorical or continuous measurement scale.
线性回归是一种标准的统计数据分析技术。 我们使用线性回归来确定因变量和一个或多个自变量之间的直接关系。 因变量必须在连续测量范围内进行测量,并且自变量可以在分类或连续测量范围内进行测量。
In linear regression, we want to draw a line that comes closest to the data by finding the slope and intercept, which define the line and minimize regression errors. There are two types of linear regression: simple linear regression and multiple linear regression. In this note, we will focus on multiple linear regression.
在线性回归中,我们希望通过找到斜率和截距来画一条最接近数据的线,以定义直线并使回归误差最小。 线性回归有两种类型:简单线性回归和多重线性回归。 在本文中,我们将重点介绍多元线性回归。
The structure of this note:
本注释的结构:
- Multiple linear regression 多元线性回归
- A case study 案例研究
I assume that the readers are already familiar with simple linear regression but will provide a brief overview here. Check out my last note for details.
我假设读者已经熟悉简单的线性回归,但在此将提供简要概述。 查阅我的上一个笔记以了解详细信息。
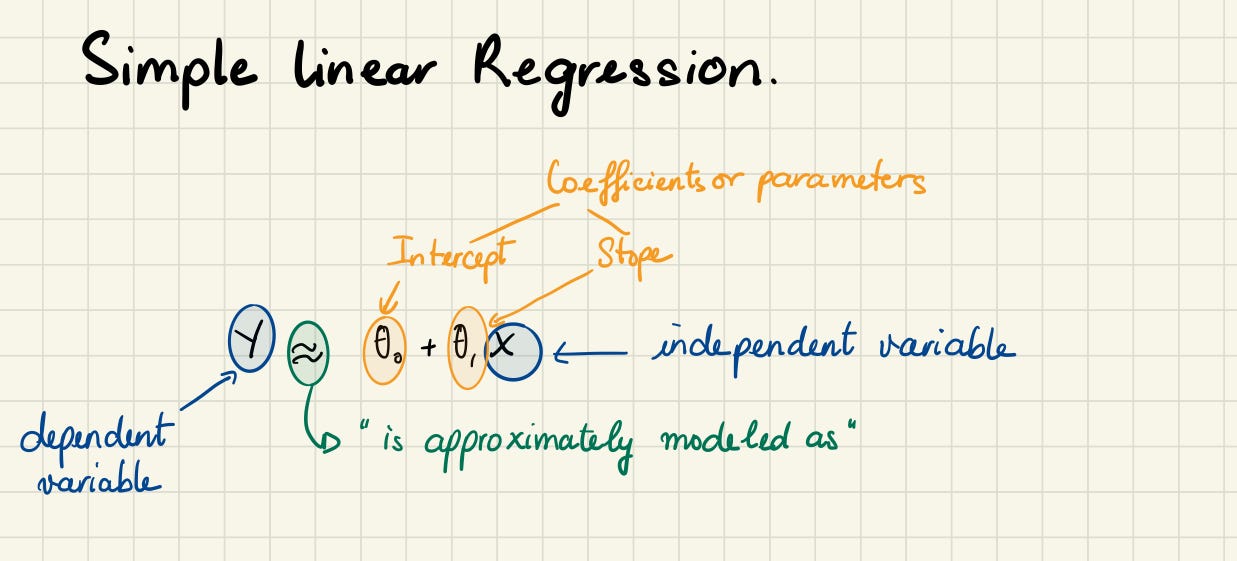
Simple linear regression is a useful approach for predicting the value of a dependent variable based on a single independent variable. It establishes the relationship between two variables using a straight line. However, in practice, we often have more than one independent variable.
简单线性回归是基于单个自变量预测因变量值的有用方法。 它使用直线建立两个变量之间的关系。 但是,实际上,我们经常有多个自变量。
Imagine when you first have a baby who was once the sole contributor to all the noise in the house. The baby’s contribution is the independent variable, and the sound is our dependent variable. Simple linear regression is what we can use when we have one independent variable and one dependent variable. But then you have a couple more, and all three babies are contributing to the noise. We could approach this problem by fitting a separate simple linear regression model for each baby. However, this approach is not entirely satisfactory. First of all, it is unclear how to make a single prediction of noise given levels of babies’ contribution, since each of the inputs is associated with a separate regression equation. Second, each of the three regression equations ignores the other two babies informing estimates for the regression coefficients.
想象一下,当您第一次生一个婴儿时,曾经是房屋中所有噪音的唯一来源。 婴儿的贡献是自变量,声音是我们的因变量。 当我们有一个自变量和一个因变量时,可以使用简单的线性回归 。 但是您又多了几口,所有三个婴儿都在增加噪音。 我们可以通过为每个婴儿拟合一个单独的简单线性回归模型来解决此问题。 但是,这种方法并不完全令人满意。 首先,由于每个输入都与一个单独的回归方程相关联,因此尚不清楚如何在给定婴儿贡献水平的情况下对噪声进行单一预测。 其次,三个回归方程式中的每一个都忽略了其他两个婴儿,他们没有为回归系数做出估计。
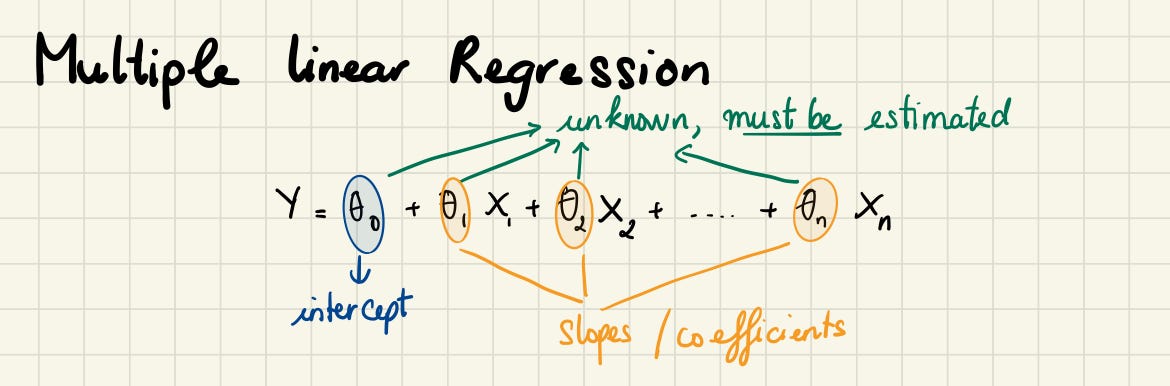
Instead of fitting a separate simple linear regression model for each independent variable, a better approach is to extend the simple linear regression model so that it can directly accommodate multiple independent variables. We can do this by giving each independent variable a separate slope coefficient in a single model. In general, suppose that we have n distinct, independent variable. Then the multiple linear regression model takes the form.
代替为每个自变量拟合单独的简单线性回归模型,更好的方法是扩展简单线性回归模型,以便它可以直接容纳多个自变量。 我们可以通过在单个模型中为每个自变量赋予单独的斜率系数来实现。 通常,假设我们有n个不同的独立变量。 然后,多元线性回归模型采用以下形式。
Multiple linear regression is what we can use when we have different independent variables. Multiple linear regression looks at the relationships within many information. Instead of just looking at how one baby contributes to the noise in the house (simple linear regression). We can look at the strength of the effect of the independent variables on the dependent variable (which baby is louder, who is more silent, etc…) We can also look at the relationship between babies and the thing we want to predict — how much noise we could have. Fun !!!
当我们具有不同的自变量时,可以使用多元线性回归 。 多元线性回归着眼于许多信息中的关系。 而不是仅仅看一个婴儿如何影响屋子里的噪音(简单的线性回归)。 我们可以查看独立变量对因变量的影响强度(哪个婴儿声音更大,谁更沉默,等等……)我们还可以查看婴儿与我们想要预测的事物之间的关系-多少我们可能会有噪音。 好玩!!!
If two or more explanatory variables have a linear relationship with the dependent variable, the regression is called a multiple linear regression. The multiple linear regression explains the relationship between one continuous dependent variable (y) and two or more independent variables (x1, x2, x3… etc).
如果两个或多个解释变量与因变量具有线性关系,则该回归称为多元线性回归 。 多元线性回归解释了 一个连续因变量( y )和两个或多个自变量 ( x 1, x 2&#x
 最低0.47元/天 解锁文章


 4841
4841

 被折叠的 条评论
为什么被折叠?
被折叠的 条评论
为什么被折叠?
 到【灌水乐园】发言


