


moloch流量回溯
数据就是一切 (Data is Everything)
Whether hunting down hackers in your network, optimizing traffic flow, or just trying to build a network baseline, you’ll learn that data is everything. Data is our gateway to gaining deeper insights into the patterns or behaviors for our users and devices. The data we are hoping to gain insights into is network traffic.
无论是寻找网络中的黑客,优化流量或只是尝试建立网络基准,您都将了解数据就是一切。 数据是我们获取有关用户和设备的模式或行为的更深刻见解的门户。 我们希望深入了解的数据是网络流量。
Following the Data, Information, Knowledge, Wisdom (DIWK) model, we’re going to walk through building a pipeline for turning network traffic data into network traffic knowledge. Out two tools of choice will be Moloch and Elastic.
遵循数据,信息,知识,智慧(DIWK)模型,我们将逐步构建用于将网络流量数据转换为网络流量知识的管道。 选择的两个工具将是Moloch和Elastic。
什么是莫洛奇? (What is Moloch?)
In short terms, Moloch is an open-source, scalable packet capture and indexing solution. Initially developed by AOL for handling their large volumes of traffic, the kind folks there released it under the Apache 2.0 license for use by the community. What makes Moloch a fantastic tool for Security Operations is that one of its core components is built on Elasticsearch already, allowing you to leverage your existing Elastic Stack if you choose to.
简而言之,Moloch是一个开源,可扩展的数据包捕获和索引解决方案。 最初由AOL开发,用于处理大量流量,那里的人们根据Apache 2.0许可发布了该版本,供社区使用。 使Moloch成为安全操作的绝佳工具的原因在于,它的核心组件之一已经在Elasticsearch上构建,如果您愿意,则可以利用现有的Elastic Stack。
The main components of Moloch are as follows:
Moloch的主要组件如下:
MolochCapture: PCAP capture and analysis
MolochCapture :PCAP捕获和分析
MolochViewer: Web-based GUI viewing data and transferring PCAPs
MolochViewer :基于Web的GUI查看数据并传输PCAP
Elasticsearch: Search the database
Elasticsearch:搜索数据库
设计注意事项 (Design Considerations)
Ideally, Moloch would be deployed much like an IDS sensor. If your network is small, centrally located, or cloud-based, it may be possible to implement a single instance and capture all your organization’s traffic. However, if you have a network the sprawls out physically, such as a university campus, then it may make sense to deploy multiple “sensors” to capture on your core routing and switching backbone. In the same vein, it would be up to you to decide if you want to host your Elastic Stack on the same machine as Moloch or elsewhere This flexibility is part of what makes Moloch such a unique tool for gaining insight into your network traffic.
理想情况下,Moloch的部署方式将非常类似于IDS传感器。 如果您的网络较小,位于中心或基于云,则可以实现单个实例并捕获组织的所有流量。 但是,如果您有一个物理扩展的网络(例如大学校园),则可能需要部署多个“传感器”以在核心路由和交换主干网上进行捕获。 同样,由您决定是否要将弹性堆栈与Moloch或其他位置托管在同一台计算机上。这种灵活性是使Moloch成为获得洞察网络流量的独特工具的一部分。
部署弹性堆栈 (Deploying Elastic Stack)
Here we’ll be using an Elastic stack container in Photon OS. Photon is a lightweight Operating System built by VMware and designed to run in virtual environments. I’m going to assume you’ve already installed Photon OS on your hypervisor of choice and have installed all updates. If not, there are plenty of tutorials on building and deploying hypervisors, with just as many debates on which vendor or technology is better.
在这里,我们将在Photon OS中使用弹性堆栈容器。 Photon是由VMware构建的轻量级操作系统,旨在在虚拟环境中运行。 我假设您已经在所选的虚拟机管理程序上安装了Photon OS,并已安装了所有更新。 如果没有,那么会有很多关于构建和部署虚拟机管理程序的教程,以及关于哪种厂商或技术更好的争论。
Note: This guide should work regardless of what OS you decide to use. The main requirement is Docker, and you aren’t constrained to running it in a VM. If you deploy Docker on a bare-metal OS, everything should still work correctly.
注意:无论您决定使用哪种操作系统,本指南均应适用。 主要要求是Docker,并且您不必在VM中运行它。 如果您在裸机OS上部署Docker,那么一切仍应正常运行。
Before pulling down our Elastic Stack image, we have to verify the virtual memory mapping (mmap). The Elastic Stack requires a mmap count equal to or more than 262,144.
在拉下我们的Elastic Stack映像之前,我们必须验证虚拟内存映射(mmap)。 弹性堆栈要求的mmap计数等于或大于262,144 。
$ sysctl vm.max_map_count
vm.max_map_count = 262144
If you need to change the vm.max_map_count of your machine, enter the following:
如果需要更改计算机的vm.max_map_count,请输入以下内容:
sysctl -w vm.max_map_count=262144Since we have Docker, already installed, and our mmap set correctly, let us go ahead and pull the sebp/elk image for our Elastic Stack and run it.
由于我们已经安装了Docker,并且我们的mmap设置正确,因此让我们继续为弹性堆栈拉出sebp / elk映像并运行它。
$ docker pull sebp/elk
$ docker run -p 5601:5601 -p 9200:9200 -p 5044:5044 -it \
--name elk sebp/elk
Let’s verify our Elastic Stack is listening.
让我们验证一下我们的弹性堆栈正在监听。
$ netstat -plnt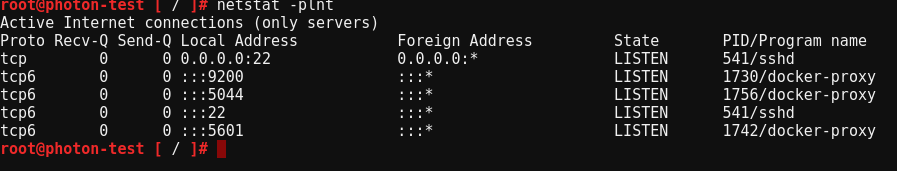
We can see our container is up and listening now. The sebp image uses the following port assignments:
我们可以看到我们的容器已启动并正在监听。 sebp映像使用以下端口分配:
- 5601 (Kibana web interface) 5601(Kibana Web界面)
- 9200 (Elasticsearch JSON interface) 9200(Elasticsearch JSON接口)
- 5044 (Logstash Beats interface) 5044(Logstash Beats界面)
Now that our Elastic Stack is up and running, it’s time to deploy Moloch.
现在我们的弹性堆栈已启动并正在运行,是时候部署Moloch了。
部署莫洛奇 (Deploying Moloch)
For this guide, we’ll only be using one Moloch instance, running on a Centos 7 machine. Like with the Docker section, I’ll assume you’ve installed Centos 7 on your own and upgraded all it’s core packages.
在本指南中,我们将仅使用一个在Centos 7机器上运行的Moloch实例。 像Docker部分一样,我假设您自己安装了Centos 7并升级了其所有核心软件包。
First, we’ll pull down the rpm and install it.
首先,我们将拉下rpm并进行安装。
$ wget https://files.molo.ch/builds/centos-7/moloch-2.2.1-1.x86_64.rpm
$ sudo yum install moloch-2.2.1-1.x86_64.rpm
Once installed, we’ll go ahead and configure Moloch. Be sure to have the IP address for your Photon VM. In this case, our Photon VM is 192.168.1.67.
安装完成后,我们将继续配置Moloch。 确保具有Photon VM的IP地址。 在这种情况下,我们的Photon VM为192.168.1.67。
$ cd /data/moloch/bin/
$ ls -l
total 6636
-rwxr-xr-x. 1 root root    9851 Jan 21 05:19 Configure
-rwxr-xr-x. 1 root root     100 Jan 21 05:19 moloch_add_user.sh
-rwxr-xr-x. 1 root root 6767952 Jan 21 05:16 moloch-capture
-rwxr-xr-x. 1 root root     829 Jan 21 05:19 moloch_update_geo.sh
lrwxrwxrwx. 1 root root      35 Feb  3 17:57 node -> ../node-v10.18.1-linux-x64/bin/node
lrwxrwxrwx. 1 root root      34 Feb  3 17:57 npm -> ../node-v10.18.1-linux-x64/bin/npm
lrwxrwxrwx. 1 root root      34 Feb  3 17:57 npx -> ../node-v10.18.1-linux-x64/bin/npx
-rwxr-xr-x. 1 root root    2007 Jan 21 05:16 taggerUpload.pl
$ sudo ./Configure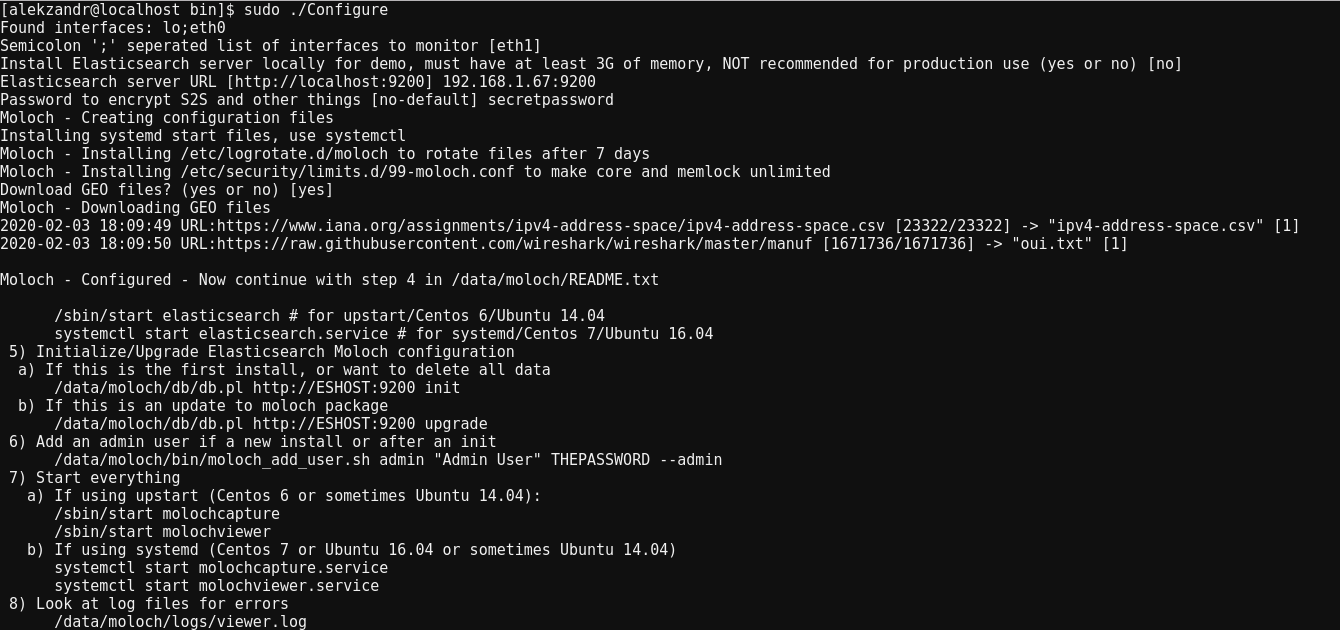
Next, initialize the database.
接下来,初始化数据库。
$ sudo /data/moloch/db/db.pl http://ESHOST:9200 init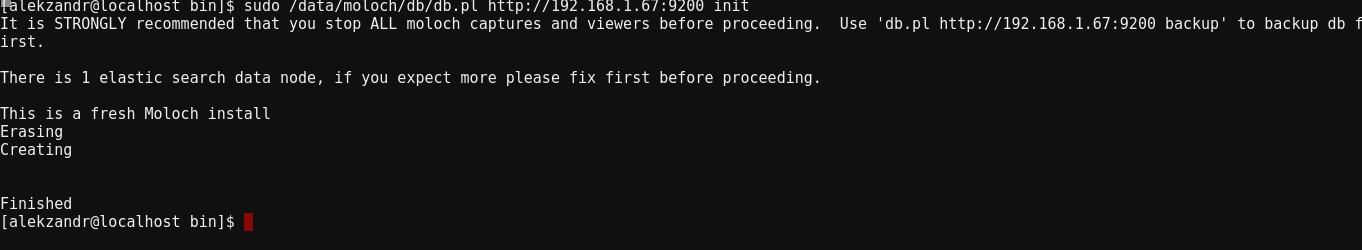
Let’s add a user account to be able to reach the web front end.
让我们添加一个用户帐户,以便能够访问Web前端。
$ /data/moloch/bin/moloch_add_user.sh admin "Admin User" SECRETPASSWORD --adminNow that Moloch is configured and initialized, we’ll go ahead and start the molochcapture and molochviewer services as well as set them to start after reboots.
现在已经配置并初始化了Moloch,我们将继续启动molochcapture和molochviewer服务,并将它们设置为在重启后启动。
$ sudo systemctl enable molochcapture.service
$ sudo systemctl enable molochviewer.service$ sudo systemctl start molocapture.service
$ sudo systemctl start molochviewer.service
View our services to ensure they started.
查看我们的服务以确保它们已启动。
$ systemctl status molochcapture molochviewer
As we saw, our molochcapture failed to start. After viewing the logs at /data/moloch/logs/capture.log, we discovered that molochcapture was trying to capture on eth1, not eth0. We can fix this by opening /data/moloch/etc/config.ini.
正如我们所看到的,我们的molochcapture无法启动。 在查看/data/moloch/logs/capture.log上的日志后,我们发现molochcapture试图在eth1而非eth0上进行捕获。 我们可以通过打开/data/moloch/etc/config.ini来解决此问题。
$ sudo vim /data/moloch/etc/config.ini
Here at line 56, I changed the interface from eth1 to eth0, saved the config, and restarted my services. ALL GREEN! (I learned after I selected the wrong interface when I ran the ./Configure script.)
在第56行,我将接口从eth1更改为eth0,保存了配置,然后重新启动了我的服务。 全绿色! (我在运行./Configure脚本时选择了错误的接口后才知道。)
Time to add the finishing touches for Moloch. Depending on your setup, you may have to adjust your iptables or firewalld setting to be able to reach web GUI from another machine. In our case, firewalld is the Centos 7 firewall, so we’ll add entries to allow access.
是时候为Moloch添加画龙点睛了。 根据您的设置,您可能必须调整iptables或Firewalld设置才能从另一台计算机访问Web GUI。 在我们的例子中,firewalld是Centos 7防火墙,因此我们将添加条目以允许访问。
$ sudo firewall-cmd --add-port=8005/tcp
success$ sudo firewall-cmd --runtime-to-permanent
success
Boom! Our Moloch sensor is deployed and configured.
繁荣! 我们的Moloch传感器已部署并配置。

配置Kibana (Configuring Kibana)
Molochviewer is excellent and everything, but we started this to set up an architecture that can handle multiple Moloch sensors, and we wanted a way to analyze our data in aggregate. To that end, we’ll put the finishing touches on our Elastic Stack to handle the newly indexed Moloch data.
Molochviewer十分出色,应有尽有,但我们首先是建立一个可以处理多个Moloch传感器的体系结构,因此我们希望找到一种汇总分析数据的方法。 为此,我们将对弹性堆栈进行最后润饰,以处理新索引的Moloch数据。
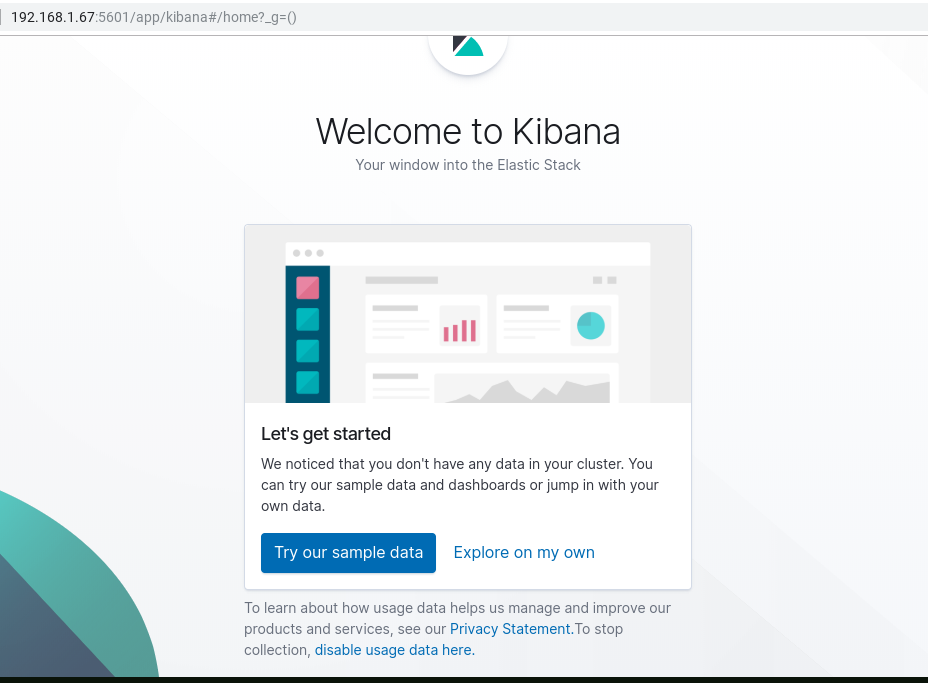
We’ll connect to our Kibana application on port 5601. If this was a fresh install of Elastic Stack, select “Explore on my own.”
我们将在端口5601上连接到我们的Kibana应用程序。如果这是Elastic Stack的全新安装,请选择“自行浏览”。
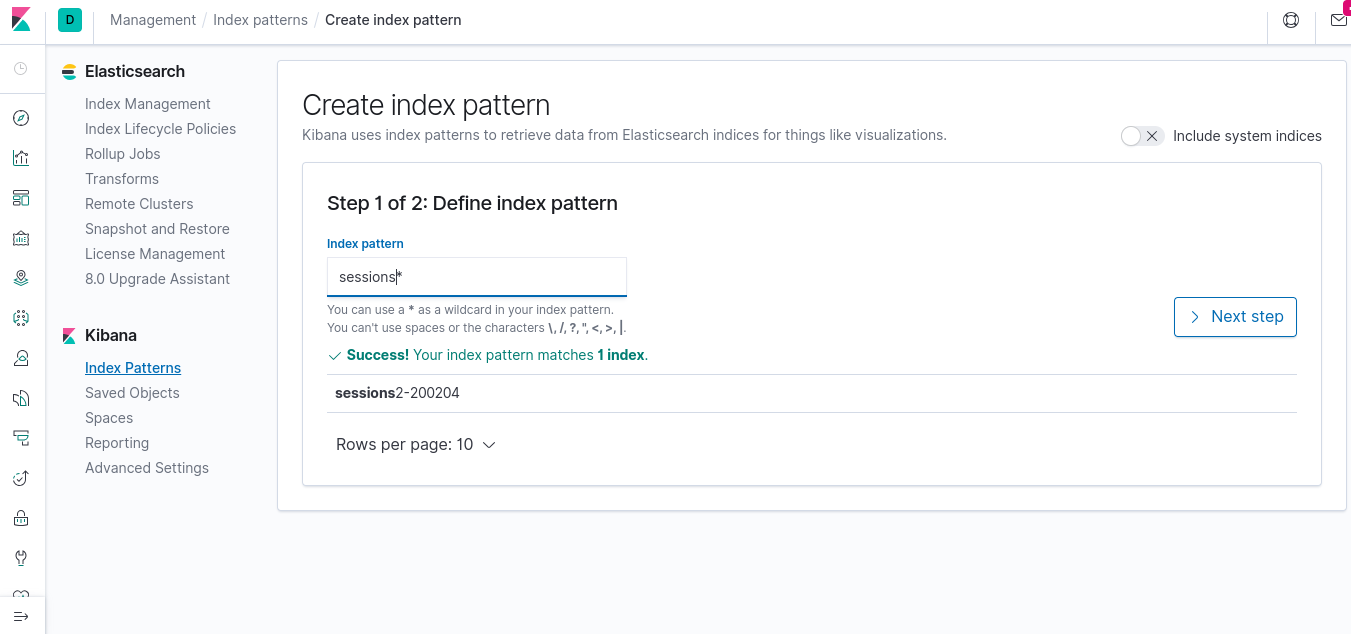
Click the “Discover” tab on the right. From there, we’ll enter “sessions*” as our index pattern and click next.
点击右侧的“发现”标签。 在此处,我们将输入“ sessions *”作为索引模式,然后单击“下一步”。
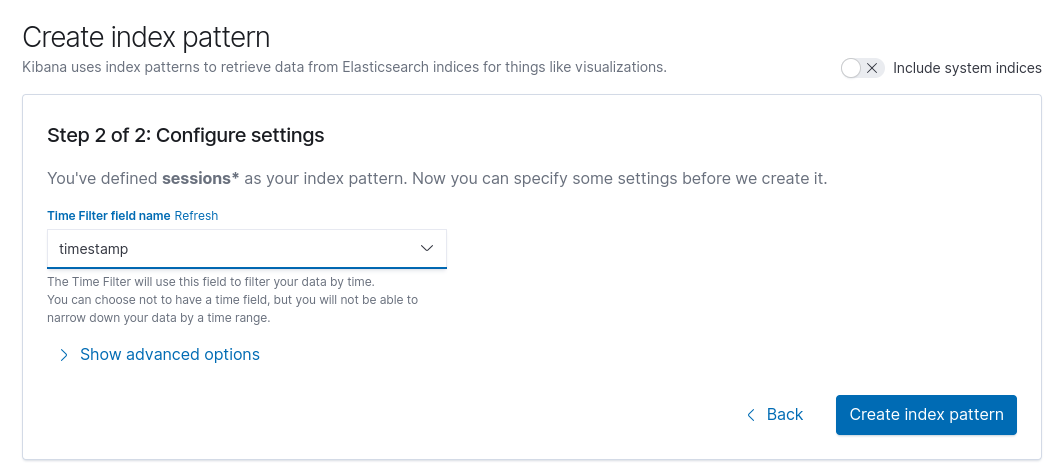
After we select “timestamp” as our Time Filter field name, then click the “Create Index Pattern.”
在我们选择“时间戳记”作为我们的“时间过滤器”字段名称后,然后单击“创建索引模式”。
When we go back to the “Discover” tab, we’ll see that our packet capture information has now populated our Elastic Stack!
当我们回到“发现”选项卡时,我们将看到我们的数据包捕获信息已填充到我们的弹性堆栈中!
结论 (Conclusion)
Here we went over standing up a Moloch sensor and sending the network traffic to an Elastic Stack. Both tools are potent in their own right. Still, when leveraged together, it will allow the security analyst or network engineer to gain far greater insights into the traffic traversing their network without the need for expensive licenses or proprietary software solutions.
在这里,我们结束了站起来的Moloch传感器,并将网络流量发送到Elastic Stack。 两种工具本身都有效。 尽管如此,如果将它们组合在一起使用,则无需昂贵的许可证或专有软件解决方案,安全分析师或网络工程师就可以更深入地了解穿越网络的流量。
The next step would be setting up visualizations and dashboards in Kibana, but the content for those would depend entirely on your organization’s needs.
下一步将是在Kibana中设置可视化和仪表板,但是这些内容和内容将完全取决于组织的需求。
翻译自: https://medium.com/swlh/indexing-network-traffic-with-moloch-and-elastic-931dda8a1685
moloch流量回溯


 927
927


 被折叠的 条评论
为什么被折叠?
被折叠的 条评论
为什么被折叠?
 到【灌水乐园】发言


