


kaggle eda
While working with different datasets available on kaggle and thereafter working with Exploratory Data Analysis, I came across with Seaborn Python Library for data visualizations.
在使用kaggle上可用的不同数据集并随后使用探索性数据分析时,我遇到了Seaborn Python Library以进行数据可视化。
import numpy as np
import pandas as pd
import matplotlib.pyplot as plt
import seaborn as sns
%matplotlib inline
After importing above libraries, now we are going to analyse our data reading the csv file with pandas dataframe and then using function shape to find out the number of rows and columns in the given dataframe.
导入上述库之后,现在我们将分析数据并使用pandas数据框读取csv文件,然后使用函数shape找出给定数据框中的行数和列数。

With above shape of the dataframe, now we are going to analyze the head of the dataframe as follows,
有了数据框的上述形状,现在我们将如下分析数据框的头部,

Also, we can analyse the dataframe columns object type either as follows where every feature has 150 values each with no null or na values,
另外,我们可以按以下方式分析数据框列的对象类型,其中每个功能都有150个值,每个值都没有null或na值,
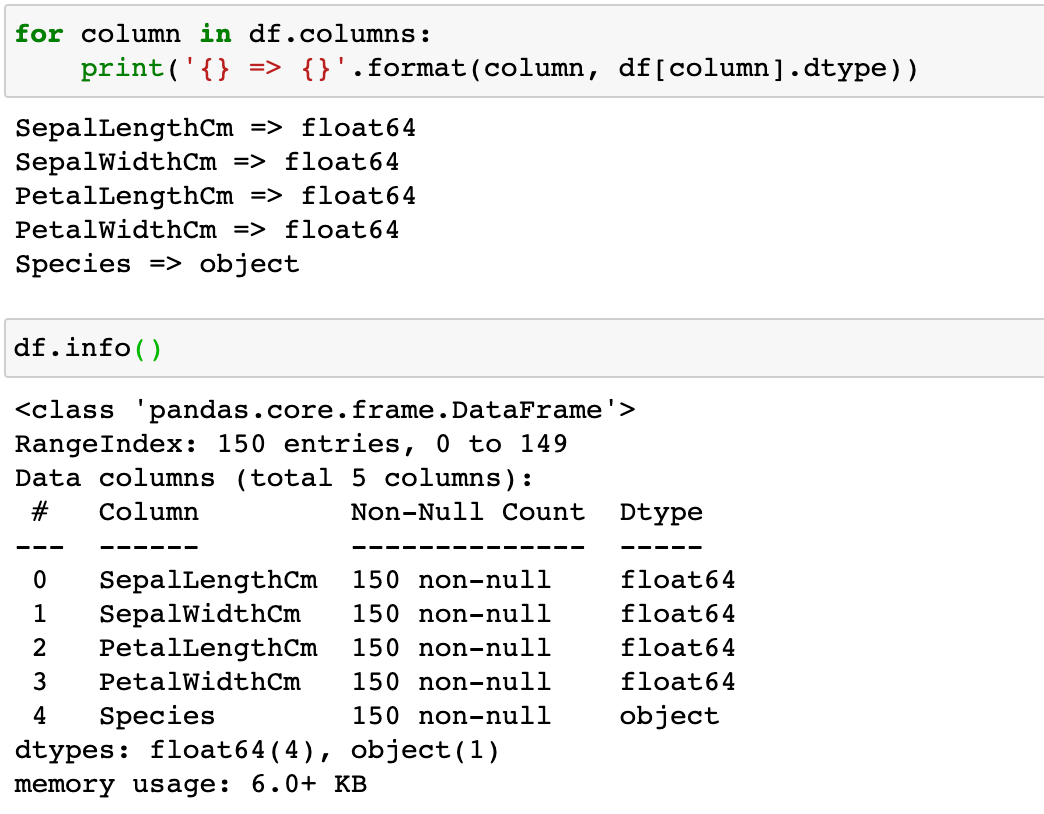
Also, we can analyse the different attribute of given features from Iris datasets which are non object data types as follows,
同样,我们可以从非对象数据类型的虹膜数据集中分析给定特征的不同属性,如下所示:

Now, let’s analyse the data for Species object with count plot feature from sns catplot where it shows that every species has 50 each count of data as follows,
现在,让我们使用sns catplot中的计数图功能分析Species对象的数据,该数据显示每个物种都有50个数据计数,如下所示:

Lets analyse the univariate analysis with histogram and KDE with distribution plot as follows,
让我们用分布图分析直方图和KDE的单变量分析,如下所示:

The above variations as shown with histogram can be also verified with skewness and kurtosis values as,
直方图所示的上述变化也可以通过偏度和峰度值进行验证,例如,

Let’s analyse the dependency of one feature with another using sns pairplot,
让我们使用sns pairplot分析一个功能与另一个功能的依赖性,

From the above figure, we can analyse that the feature PetalLengthCm and PetalWidthCm has approx linear relationship which we can also verify with heatmap with following diagram where correlation value is also 0.96,
从上图可以看出,特征PetalLengthCm和PetalWidthCm具有近似线性关系,我们也可以用热图通过以下关系图(其中相关值也为0.96)进行验证,

Now with boxplot bivariate analysis, let’s analyse the data with Species and SepalLengthCm, SepalWidthCm, PetalLengthCm and PetalWidthCm as,
现在使用箱线图双变量分析,让我们使用Species和SepalLengthCm,SepalWidthCm,PetalLengthCm和PetalWidthCm来分析数据,

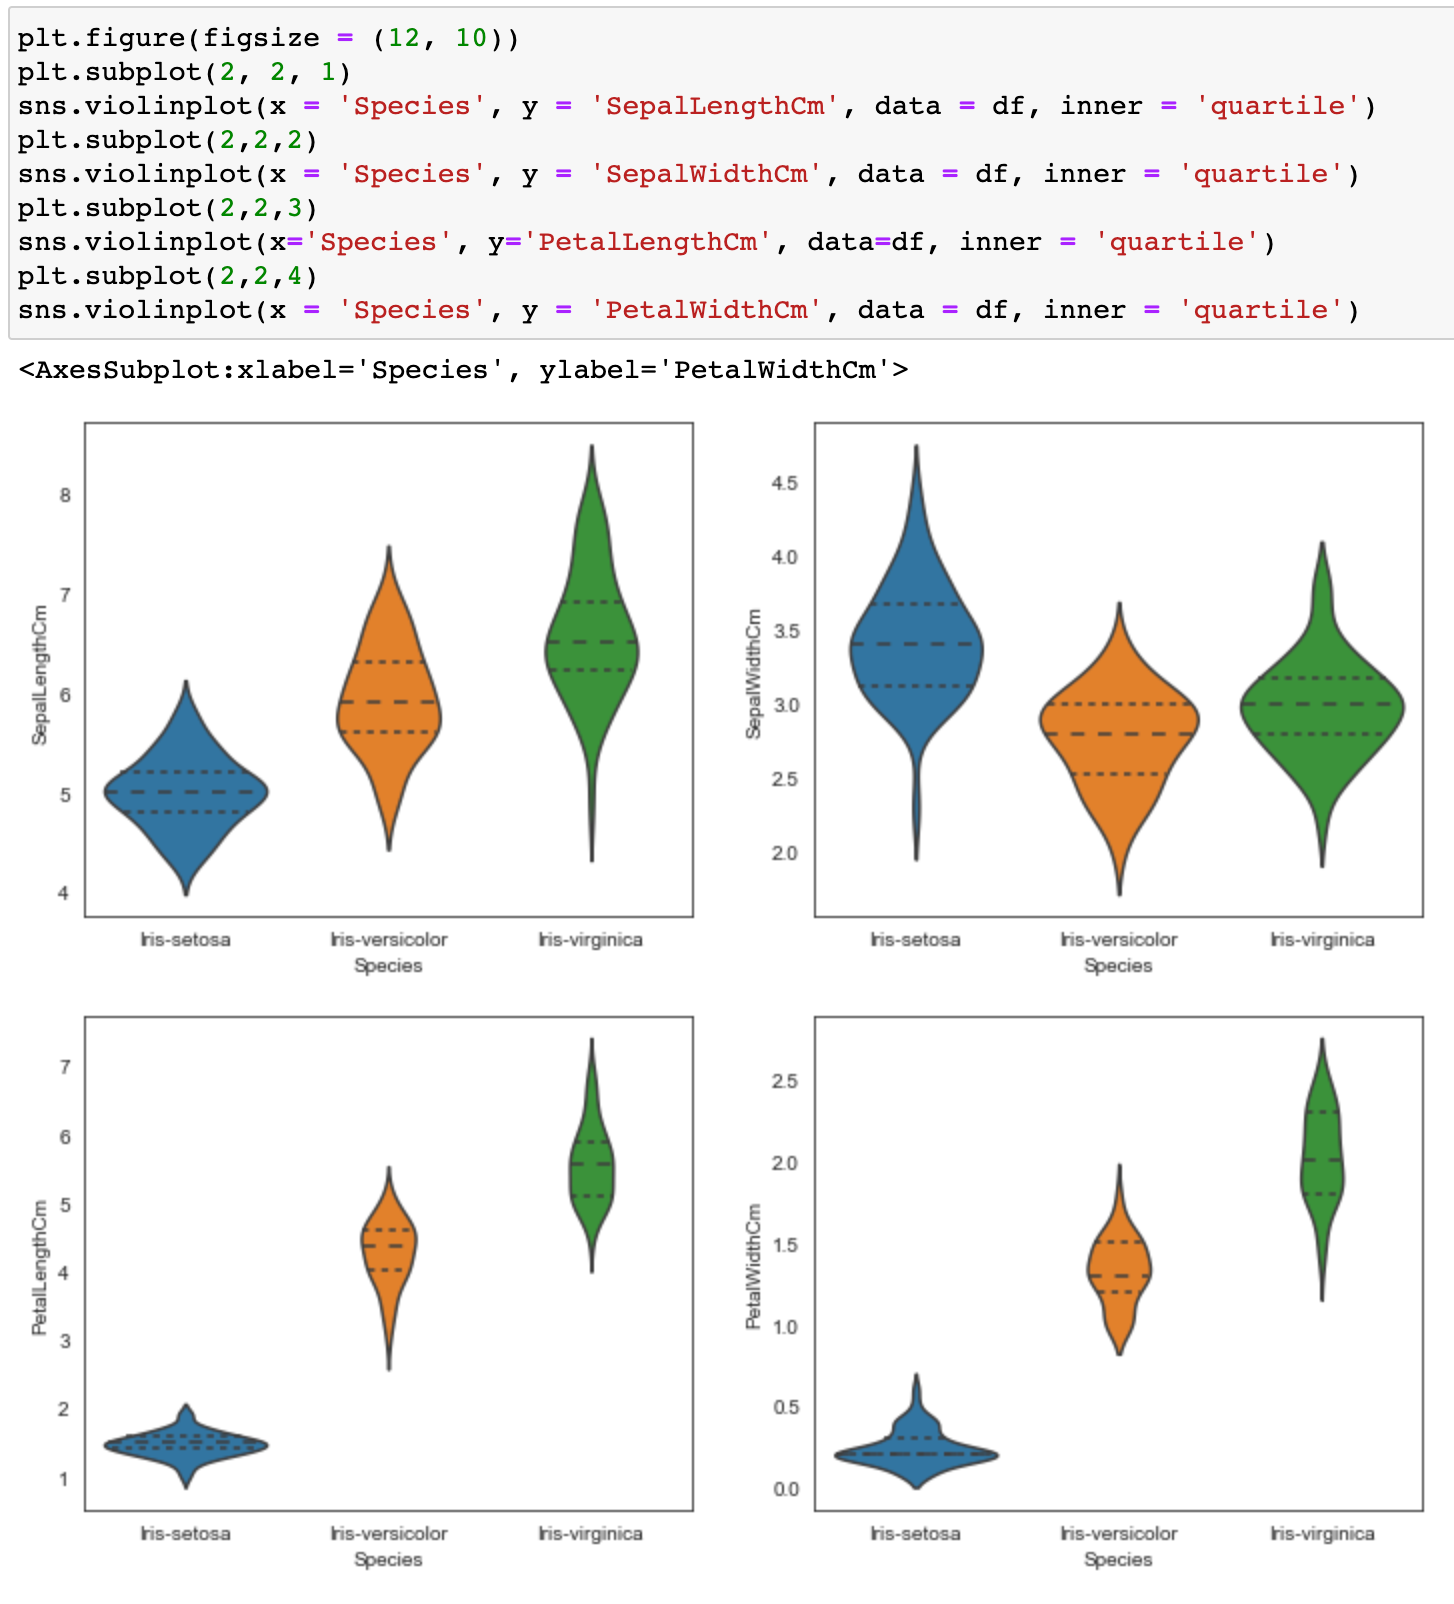
Also, violin plot bivariate analysis, let’s analyse the data with Species and SepalLengthCm, SepalWidthCm, PetalLengthCm and PetalWidthCm as,
此外,小提琴图双变量分析,让我们使用Species和SepalLengthCm,SepalWidthCm,PetalLengthCm和PetalWidthCm分析数据,
Now, Let’s dig deeper with different available machine learning algorithms to find out the accuracy, confusion matrix, etc as follows,
现在,让我们深入研究各种可用的机器学习算法,以找出准确性,混淆矩阵等,如下所示:

Here below, we are splitting the datasets into train and test datasets with 70% into training datasets and 30% into testing datasets, also, we have taken the random_state to be as 42 so that the data split remains constant whenever we are following the same steps again.
在下面,我们将数据集分为训练数据集和测试数据集,其中70%分为训练数据集,而30%分为测试数据集,而且我们将random_state设为42,这样只要我们遵循相同的数据,分割数据就保持不变再走一步。
When the random_state values varies, the distribution of the datasets will vary too and hence, therefore, the final accuracy percentage will differ too.
当random_state值变化时,数据集的分布也将变化,因此,最终精度百分比也将变化。

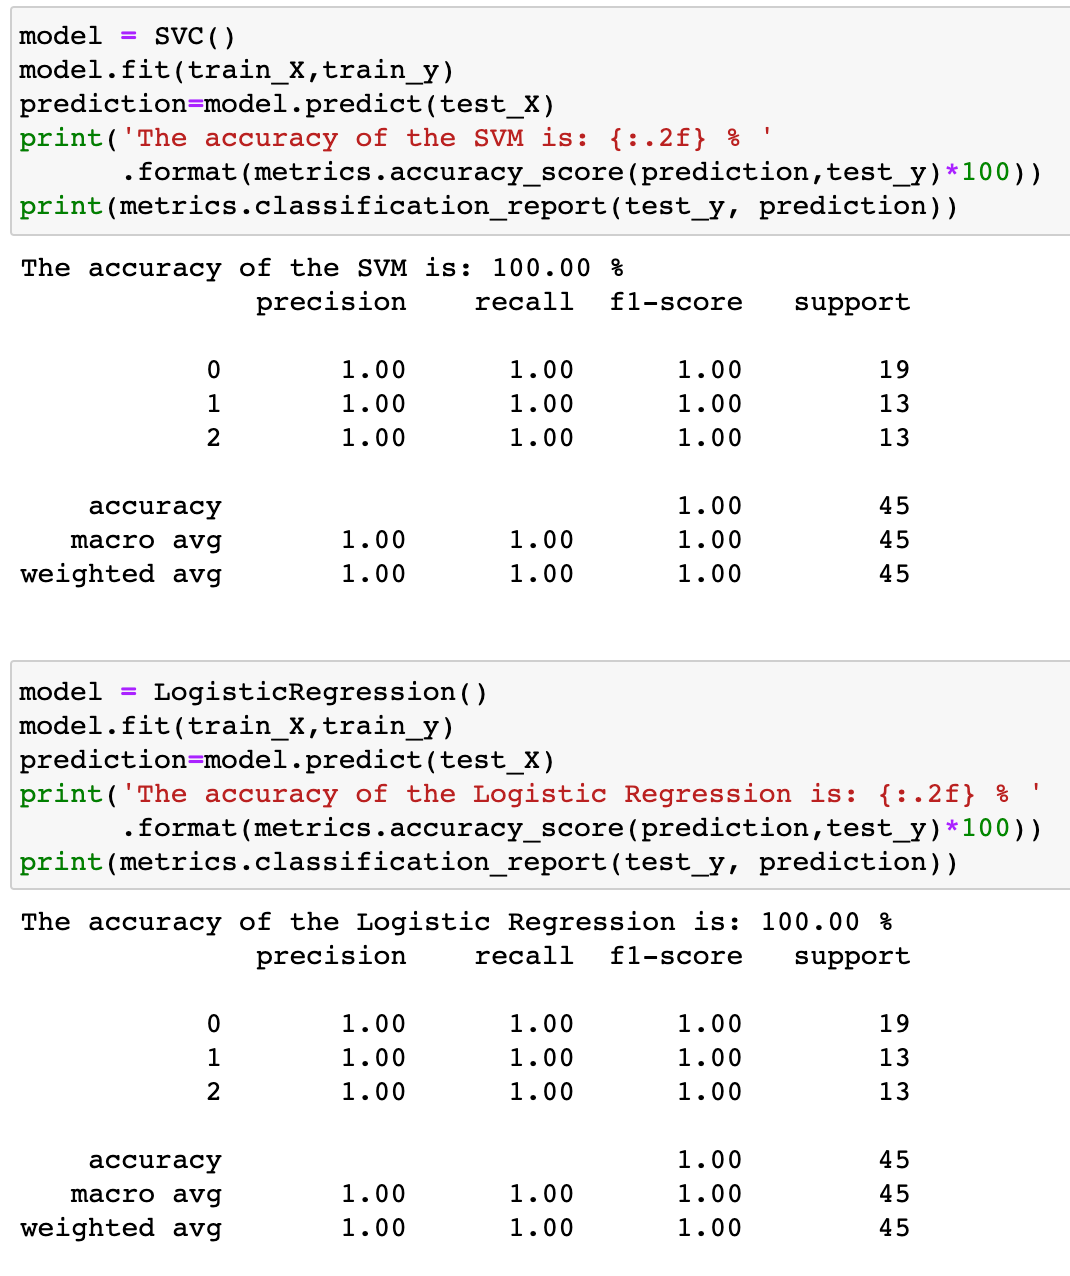
After splitting the data, we can use different available ML algorithms from SK Learn to implement model as follows,
分割数据后,我们可以使用SK Learn提供的其他可用ML算法来实现模型,如下所示:

That’s it! Thank you so much for reading until the end of this blog. I’ll appreciate further if you could please comment down your opinions as well!
而已! 非常感谢您阅读本博客结束之前的内容。 如果您也可以对您的意见发表评论,我们将不胜感激!
翻译自: https://medium.com/@bipin_k/eda-and-ml-analysis-with-kaggle-iris-datasets-74e969952288
kaggle eda


 1万+
1万+


 被折叠的 条评论
为什么被折叠?
被折叠的 条评论
为什么被折叠?
 到【灌水乐园】发言


