


 xgboost kerasThe goal of this challenge is to predict whether a customer will make a transaction (“target” = 1) or not (“target” = 0). For that, we get a data set of 200 incognito variables and our su...
xgboost keras
The goal of this challenge is to predict whether a customer will make a transaction (“target” = 1) or not (“target” = 0). For that, we get a data set of 200 incognito variables and our submission is judged based on the Area Under Receiver Operating Characteristic Curve which we have to maximise.
这项挑战的目的是预测客户是否会进行交易(“目标” = 1)(“目标” = 0)。 为此,我们获得了200个隐身变量的数据集,并根据必须最大化的接收器工作特征曲线下面积来判断提交。
This project is somewhat different from others, you basically get a huge amount of data with no missing values and only numbers. A dream come true for any data scientist. Of course, that sounds too good to be true! Let’s dive in.
这个项目与其他项目有些不同,您基本上可以获得大量的数据,没有缺失值,只有数字。 任何数据科学家都梦想成真。 当然,这听起来好得令人难以置信! 让我们潜入。
一,设置 (I. Set up)
We start by loading the data and get a quick overview of the data we’ll have to handle. We do so by calling the describe() and info() functions.
我们首先加载数据,然后快速概览需要处理的数据。 我们通过调用describe()和info()函数来实现。
# Load the data setstrain_df = pd.read_csv("train.csv")
test_df = pd.read_csv("test.csv")# Create a merged data set and review initial informationcombined_df = pd.concat([train_df, test_df])
print(combined_df.describe())
print(combined_df.info())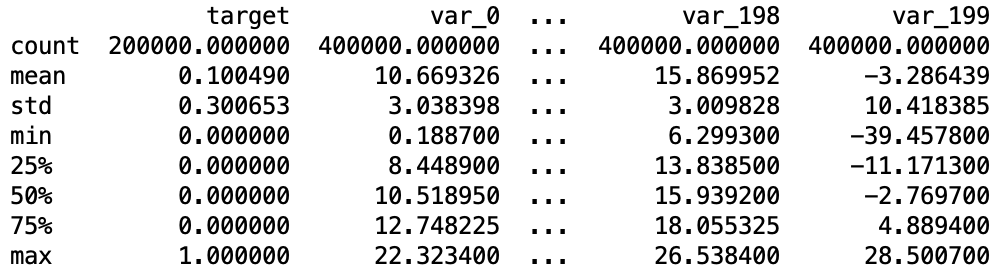
We have a total of 400.000 observations, 200.000 of whom in our training set. We can also see that we will have to deal with the class imbalance issue as we have a mean of 0.1 in the target column.
我们总共有400.000个观测值,其中有200.000个在我们的训练集中。 我们还可以看到,我们必须处理类不平衡问题,因为目标列的平均值为0.1。
二。 缺失值 (II. Missing values)
Let’s check whether we have any missing values. For that, we print the column names that contain missing values.
让我们检查是否缺少任何值。 为此,我们打印包含缺少值的列名称。
# Check missing valuesprint(combined_df.columns[combined_df.isnull().any()])
We have zero missing values. Let’s move forward.
我们的零缺失值。 让我们前进。
三, 资料类型 (III. Data types)
Let’s check the data we have. Are we dealing with categorical variables? Or text? Or just numbers? We print a dictionary containing the different types of data we have and its occurrence.
让我们检查一下我们拥有的数据。 我们在处理分类变量吗? 还是文字? 还是数字? 我们打印一个字典,其中包含我们拥有的不同数据类型及其出现的位置。
# Get the data typesprint(Counter([combined_df[col].dtype for col in combined_df.columns.values.tolist()]).items())Only float data. We don’t have to create dummy variables.
仅浮动数据。 我们不必创建虚拟变量。
IV。 数据清理 (IV. Data cleaning)
We don’t want to use our ID column to make our predictions and therefore store it into the index.
我们不想使用ID列进行预测,因此将其存储到索引中。
# Set the ID col as indexfor element in [train_df, test_df]:
    element.set_index('ID_code', inplace = True)
We now separate the target variable from our training set and create a new dataframe for our target variable.
现在,我们将目标变量从训练集中分离出来,并为目标变量创建一个新的数据框。
# Create X_train_df and y_train_df setX_train_df = train_df.drop("target", axis = 1)
y_train_df = train_df["target"]
V.缩放 (V. Scaling)
We haven’t done anything when it comes to data exploration and outlier analysis. It is always highly recommended to conduct these. However, given the nature of the challenge, we suspect that the variables in themselves might not be too interesting.
在数据探索和离群值分析方面,我们没有做任何事情。 始终强烈建议进行这些操作。 但是,鉴于挑战的性质,我们怀疑变量本身可能不太有趣。
In order to compensate for our lack of outlier detection, we scale the data using RobustScaler().
为了弥补我们对异常值检测的不足,我们使用RobustScaler()缩放数据。
# Scale the data and use RobustScaler to minimise the effect of outliersscaler = RobustScaler()# Scale the X_train setX_train_scaled = scaler.fit_transf 最低0.47元/天 解锁文章


 841
841

 被折叠的 条评论
为什么被折叠?
被折叠的 条评论
为什么被折叠?
 到【灌水乐园】发言


