


pd种知道每个数据的类型
意见 (Opinion)
目录 (Table of Contents)
- Introduction 介绍
- Multicollinearity 多重共线性
- One-Hot Encoding 一站式编码
- Sampling 采样
- Error Metrics 错误指标
- Storytelling 评书
- Summary 摘要
介绍 (Introduction)
I have written about common skills that Data Scientists can expect to use in their professional careers, so now I want to highlight some key concepts of Data Science that can be beneficial to know and later employ. I may be discussing some that you know already, and some that you do not know; my goal is to provide some professional explanation of why these concepts are beneficial regardless of what you do know now. Multicollinearity, one-hot encoding, undersampling and oversampling, error metrics, and lastly, storytelling, are the key concepts I think of first when thinking of a professional Data Scientist in their day-to-day. The last point, perhaps, is a combination of skill and a concept but wanted to highlight, still, its importance on your everyday work life as a Data Scientist. I will expound upon all of these concepts down below.
我已经写了关于数据科学家可以在其职业生涯中期望使用的常见技能的文章,所以现在我想重点介绍一些数据科学的关键概念,这些知识可能有益于知识并在以后使用。 我可能正在讨论您已经知道的一些,以及您不知道的一些。 我的目标是提供一些专业的解释,说明无论您现在知道什么,这些概念为何都是有益的。 多重共线性,单次编码,欠采样和过采样,错误度量,以及讲故事,是我每天在考虑专业数据科学家时首先想到的关键概念。 最后一点也许是技巧和概念的结合,但仍然想强调它对您作为数据科学家的日常工作的重要性。 我将在下面详细说明所有这些概念。
多重共线性 (Multicollinearity)

Although the word is somewhat long and hard to say, when you break it down, multicollinearity is simple. Multi meaning many, and collinearity meaning linearly related. Multicollinearity can be described as the situation when two or more explanatory variables explain similar information or are highly related in a regression model. There are a few reasons this concept can raise a concern.
尽管这个词有点长且很难说,但将其分解时,多重共线性很简单。 多含义很多,共线性含义线性相关。 多重共线性可以描述为当两个或多个解释变量解释相似信息或在回归模型中高度相关时的情况。 此概念引起关注的原因有几个。
For some modeling techniques, it can cause overfitting and ultimately a decline in model performance.
对于某些建模技术,它可能导致过度拟合并最终导致模型性能下降。
The data becomes redundant and not each feature or attribute is needed in your model. Therefore, there are some ways to find out which features you should remove that constitute multicollinearity.
数据变得多余,并且模型中不需要每个功能或属性。 因此,有一些方法可以找出应删除构成多重共线性的特征。
variance inflation factor (VIF)
方差膨胀因子(VIF)
correlation matrices
相关矩阵
These two techniques are commonly used amongst Data Scientists, especially correlation matrices and plots — usually visualized with a heatmap of some sort, while VIF is lesser-known.
数据科学家通常使用这两种技术,尤其是相关矩阵和图-通常以某种形式的热图可视化,而VIF则鲜为人知。
The higher the VIF value, the less usable the feature is for your regression model.
VIF值越高,该功能对您的回归模型的使用就越少。
A great, simple resource for VIF is [3]:
VIF的一个很好的简单资源是[3]:
一站式编码 (One-Hot Encoding)
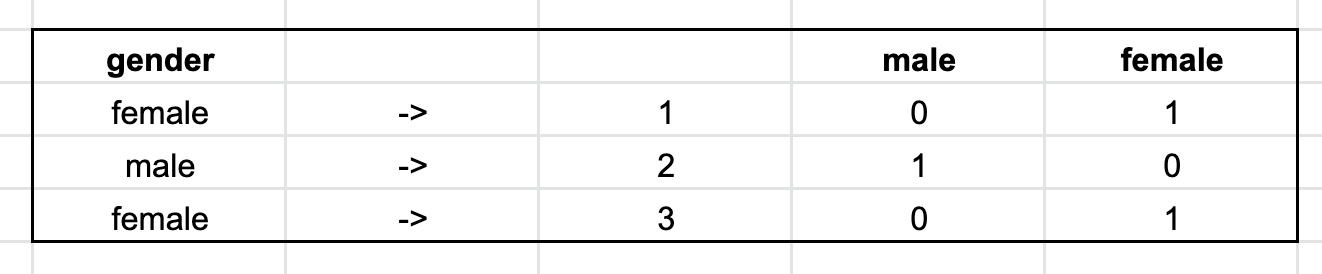
This form of feature transformation in your model is called one-hot encoding. You want to represent your categorical features numerically by encoding them. Whereas the categorical features have text values themselves, one-hot encoding transposes that information so that each value becomes the feature and the observation in the row is either denoted as a 0 or 1. For example, if we have the categorical variable gender, the numerical representation after one-hot encoding would look like (gender before, and male/female after):
模型中这种形式的特征转换称为单次编码。 您想通过编码来以数字方式表示分类特征。 尽管分类要素本身具有文本值,但是一键编码会转置该信息,以便每个值都成为要素,并且该行中的观察值将表示为0或1。例如,如果我们拥有分类变量sex ,则一键编码后的数字表示看起来像( 性别之前和之后的男性/女性 ):
This transformation is useful when you are not just working with numerical features, and need to create that numerical representation with text/categorical features.
当您不仅要使用数字功能并且需要使用文本/分类功能创建该数字表示形式时,此转换非常有用。
采样 (Sampling)
When you do not have enough data, oversampling may be suggested as a form of compensation. Say you are working on a classification problem and you have a minority class like the example down below:
当您没有足够的数据时,建议使用过采样作为补偿。 假设您正在处理分类问题,并且有一个少数类,如下例所示:
class_1 = 100 rowsclass_2 = 1000 rowsclass_3 = 1100 rowsAs you can see, class_1 has a small amount of data for its class, which means your dataset is imbalanced and will be referred to as the minority class. There are several oversampling techniques. One of them is called SMOTE [5], which stands for Synthetic Minority Over-sampling Technique. One of the ways that SMOTE works is by utilizing a K-neighbor method for finding the nearest neighbor to create synthetic samples. There are similar techniques that use the reverse method for undersampling.
如您所见, class_1的类中包含少量数据,这意味着您的数据集不平衡,将被称为少数类。 有几种过采样技术。 其中之一称为SMOTE [5],代表合成少数族裔过采样技术 。 SMOTE工作的方法之一是利用K邻域方法来找到最接近的邻域以创建合成样本。 有类似的技术使用反向方法进行欠采样 。
These techniques are beneficial when you have outliers in your class or regression data even, and you want to ensure your sampling is the best representation of the data that your model will run on in the future.
当您的类或回归数据中甚至有异常值时,并且您要确保采样是模型将在将来运行的数据的最佳表示形式时,这些技术将非常有用。
错误指标 (Error Metrics)
There are plenty of error metrics used for both classification and regression models in Data Science. According to sklearn [6], here are some that you can use specifically for regression models:
在数据科学中,分类和回归模型都有大量错误度量标准。 根据sklearn [6],以下是您可以专门用于回归模型的一些信息:
metrics.explained_variance_score
metrics.explained_variance_score
metrics.mean_squared_log_error
metrics.mean_squared_log_error
The two most popular error metrics for regression from above are MSE and RMSE:
从上方进行回归分析的两个最受欢迎的错误度量标准是MSE和RMSE:
MSE: the concept is → mean absolute error regression loss (sklearn)
MSE:概念是→平均绝对误差回归损失(sklearn)
RMSE: the concept is → mean squared error regression loss (sklearn)
RMSE:概念是→均方误差回归损失(sklearn)
For classification, you can expect to evaluate your model’s performance with accuracy and AUC (Area Under the Curve).
对于分类,您可以期望以准确性和AUC(曲线下面积)评估模型的性能。
评书 (Storytelling)

I wanted to add a unique concept of Data Science that is storytelling. I cannot stress enough how important this concept is. It can be seen as a concept or skill, but the label here is not important, what is, is how well you articulate your problem-solving techniques in a business setting. A lot of Data Scientists will focus solely on model accuracy, but will then fail to understand the entire business process. That process includes:
我想添加一个讲故事的数据科学独特概念。 我不能足够强调这个概念的重要性。 可以将其视为概念或技能,但此处的标签并不重要,即您在业务环境中表达解决问题技术的能力如何。 许多数据科学家将只专注于模型的准确性,但随后将无法理解整个业务流程。 该过程包括:
what is the business?
什么事
what is the problem?
问题是什么?
why do we need Data Science?
为什么我们需要数据科学?
what is the goal of Data Science here?
数据科学的目标是什么?
when will we get usable results?
我们什么时候可以获得可用的结果?
how can we apply our results?
我们如何应用我们的结果?
what is the impact of our results?
我们的结果有什么影响?
how do we share our results and overall process?
我们如何分享我们的结果和整体流程?
As you can see, none of these points are the model itself/improvement in accuracy. The focus here is how you will use data to solve your company's problems. It is beneficial to become acquainted with stakeholders and your non-technical coworkers who you will ultimately be working with. You will also work with Product Managers who will work alongside you in assessing the problem, and Data Engineers to collect the data before even running a base model. At the end of your model process, you will share your results with key individuals who will usually like to see its impact in most likely some type of visual representation (Tableau, Google Slide deck, etc.), so being able to present and communicate is beneficial as well.
如您所见,这些要点都不是模型本身/准确性的提高。 这里的重点是如何使用数据来解决公司的问题。 结识最终将要与之合作的利益相关者和您的非技术合作伙伴是有益的。 您还将与产品经理一起工作,他们将与您一起评估问题,并与数据工程师一起甚至在运行基本模型之前收集数据。 在建模过程的最后,您将与主要人员分享您的结果,这些人员通常希望看到其对某种视觉表示形式( Tableau,Google Slide卡座等 )的影响,从而能够进行演示和交流也是有益的。
摘要 (Summary)
There are plenty of key concepts Data Scientists, as well as Machine Learning Engineers, should know. Five of them discussed in this article were:
数据科学家以及机器学习工程师应该知道很多关键概念。 本文讨论的其中五个是:
MulticollinearityOne-hot encodingSamplingErrorStorytellingPlease feel free to comment down below some concepts of Data Science that you focus on daily, or that you think others should know about. Thank you for reading my article, I hope you enjoyed it!
请随意在以下您每天关注的或您认为其他人应该知道的数据科学概念下进行评论。 感谢您阅读我的文章,希望您喜欢!
Below are some references and links that can provide more information on the topics discussed in this article.
下面是一些参考和链接,它们可以提供有关本文讨论的主题的更多信息。
I also want to highlight two other stories I have written which are related to this article, [8] and [9]:
我还想强调我写的另外两个与本文有关的故事,[8]和[9]:
These two articles highlight key skills and projects you will need to either know or become familiar with and expect to eventually employ as a professional Data Scientist.
这两篇文章重点介绍了您需要了解或熟悉的关键技能和项目,并期望他们最终成为专业的数据科学家。
翻译自: https://towardsdatascience.com/5-concepts-every-data-scientist-should-know-16c74d080a83
pd种知道每个数据的类型


 1633
1633

 被折叠的 条评论
为什么被折叠?
被折叠的 条评论
为什么被折叠?
 到【灌水乐园】发言


