


python中knn
k最近邻居 (k-Nearest Neighbors)
k-Nearest Neighbors (KNN) is a supervised machine learning algorithm that can be used for either regression or classification tasks. KNN is non-parametric, which means that the algorithm does not make assumptions about the underlying distributions of the data. This is in contrast to a technique like linear regression, which is parametric, and requires us to find a function that describes the relationship between dependent and independent variables.
k最近邻(KNN)是一种受监督的机器学习算法,可用于回归或分类任务。 KNN是非参数的,这意味着该算法不对数据的基础分布进行假设。 这与参数化的线性回归等技术形成对比,后者是参数化的,要求我们找到一个描述因变量和自变量之间关系的函数。
KNN has the advantage of being quite intuitive to understand. When used for classification, a query point (or test point) is classified based on the k labeled training points that are closest to that query point.
KNN具有非常直观易懂的优点。 当用于分类时,根据最接近该查询点的k个标记训练点对查询点(或测试点)进行分类。
For a simplified example, see the figure below. The left panel shows a 2-d plot of sixteen data points — eight are labeled as green, and eight are labeled as purple. Now, the right panel shows how we would classify a new point (the black cross), using KNN when k=3. We find the three closest points, and count up how many ‘votes’ each color has within those three points. In this case, two of the three points are purple — so, the black cross will be labeled as purple.
有关简化示例,请参见下图。 左面板显示了16个数据点的二维图-八个标记为绿色,八个标记为紫色。 现在,右面板显示了当k = 3时,如何使用KNN对新点(黑色十字)进行分类。 我们找到三个最接近的点,并计算出每种颜色在这三个点内有多少个“票数”。 在这种情况下,三个点中的两个是紫色的-因此,黑色十字将被标记为紫色。

Calculating Distance
计算距离
The distance between points is determined by using one of several versions of the Minkowski distance equation. The generalized formula for Minkowski distance can be represented as follows:
点之间的距离是通过使用Minkowski距离方程的几个版本之一确定的。 Minkowski距离的广义公式可以表示为:
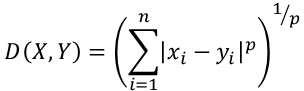
where X and Y are data points, n is the number of dimensions, and p is the Minkowski power parameter. When p =1, the distance is known at the Manhattan (or Taxicab) distance, and when p=2 the distance is known as the Euclidean distance. In two dimensions, the Manhattan and Euclidean distances between two points are easy to visualize (see the graph below), however at higher orders of p, the Minkowski distance becomes more abstract.
其中X和Y是数据点, n是维数, p是Minkowski幂参数。 当p = 1时,该距离已知为曼哈顿(或出租车)距离,而当p = 2时,该距离称为欧几里得距离。 在两个维度上,两点之间的曼哈顿距离和欧几里得距离很容易可视化(请参见下图),但是在p的高阶处,明可夫斯基距离变得更加抽象。

Python中的KNN (KNN in Python)
To implement my own version of the KNN classifier in Python, I’ll first want to import a few common libraries to help out.
为了用Python实现我自己的KNN分类器版本,我首先要导入一些常见的库来提供帮助。
# Initial imports


import pandas as pd
import numpy as np
import matplotlib.pyplot as plt
加载数据中 (Loading Data)
To test the KNN classifier, I’m going to use the iris data set from sklearn.datasets. The data set has measurements (Sepal Length, Sepal Width, Petal Length, Petal Width) for 150 iris plants, split evenly among three species (0 = setosa, 1 = versicolor, and 2 = virginica). Below, I load the data and store it in a dataframe.
为了测试KNN分类器,我将使用sklearn.datasets中的虹膜数据集。 数据集具有150种鸢尾植物的测量值(头长,萼片宽度,花瓣长度,花瓣宽度),均匀地分为三种(0 =刚毛,1 =杂色和2 =弗吉尼亚)。 在下面,我加载数据并将其存储在数据框中。
# Load iris data and store in dataframe


from sklearn import datasets


iris = datasets.load_iris()


df = pd.DataFrame(data=iris.data, columns=iris.feature_names)
df['target'] = iris.target
df.head()
I’ll also separate the data into features (X) and the target variable (y), which is the species label for each plant.
我还将数据分为特征(X)和目标变量(y),目标变量是每种植物的种类标签。
# Separate X and y data


X = df.drop('target', axis=1)
y = df.target
建立KNN框架 (Building out the KNN Framework)
Creating a functioning KNN classifier can be broken down into several steps. While KNN includes a bit more nuance than this, here’s my bare-bones to-do list:
创建功能良好的KNN分类器可以分为几个步骤。 尽管KNN包含的细微之处要多于此,但以下是我的基本工作清单:
- Define a function to calculate the distance between two points 定义一个函数来计算两点之间的距离
- Use the distance function to get the distance between a test point and all known data points 使用距离函数获取测试点与所有已知数据点之间的距离
- Sort distance measurements to find the points closest to the test point (i.e., find the nearest neighbors) 对距离测量值进行排序,以找到最接近测试点的点(即,找到最近的邻居)
- Use majority class labels of those closest points to predict the label of the test point 使用那些最接近的点的多数类标签来预测测试点的标签
- Repeat steps 1 through 4 until all test data points are classified 重复步骤1至4,直到对所有测试数据点进行分类
1.定义一个函数来计算两点之间的距离 (1. Define a function to calculate distance between two points)
First, I define a function called minkowski_distance, that takes an input of two data points (a & b) and a Minkowski power parameter p, and returns the distance between the two points. Note that this function calculates distance exactly like the Minkowski formula I mentioned earlier. By making p an adjustable parameter, I can decide whether I want to calculate Manhattan distance (p=1), Euclidean distance (p=2), or some higher order of the Minkowski distance.
首先,我定义一个名为minkowski_distance的函数,该函数接受两个数据点( a & b )和一个Minkowski幂参数p的输入,并返回两个点之间的距离。 请注意,此函数计算距离的方式与我之前提到的Minkowski公式完全相同。 通过将p设置为可调参数,我可以决定是否要计算曼哈顿距离(p = 1),欧几里得距离(p = 2)或Minkowski距离的更高阶。
# Calculate distance between two points


def minkowski_distance(a, b, p=1):

    # Store the number of dimensions
    dim = len(a)

    # Set initial distance to 0
    distance = 0

    # Calculate minkowski distance using parameter p
    for d in range(dim):
        distance += abs(a[d] - b[d])**p

    distance = distance**(1/p)

    return distance


# Test the function


minkowski_distance(a=X.iloc[0], b=X.iloc[1], p=1)0.69999999999999932.使用距离功能获取测试点与所有已知数据点之间的距离 (2. Use the distance function to get distance between a test point and all known data points)
For step 2, I simply repeat the minkowski_distance calculation for all labeled points in X and store them in a dataframe.
对于第2步,我只需要对X中所有标记的点重复minkowski_distance计算,并将它们存储在数据框中。
# Define an arbitrary test point


test_pt = [4.8, 2.7, 2.5, 0.7]


# Calculate distance between test_pt and all points in X


distances = []


for i in X.index:

    distances.append(minkowski_distance(test_pt, X.iloc[i]))

df_dists = pd.DataFrame(data=distances, index=X.index, columns=['dist'])
df_dists.head()
3.对距离测量值进行排序以找到最接近测试点的点 (3. Sort distance measurements to find the points closest to the test point)
In step 3, I use the pandas .sort_values() method to sort by distance, and return only the top 5 results.
在第3步中,我使用pandas .sort_values()方法按距离排序,并且仅返回前5个结果。
# Find the 5 nearest neighbors


df_nn = df_dists.sort_values(by=['dist'], axis=0)[:5]
df_nn
4.使用那些最近点的多数类标签来预测测试点的标签 (4. Use majority class labels of those closest points to predict the label of the test point)
For this step, I use collections.Counter to keep track of the labels that coincide with the nearest neighbor points. I then use the .most_common() method to return the most commonly occurring label. Note: if there is a tie between two or more labels for the title of “most common” label, the one that was first encountered by the Counter() object will be the one that gets returned.
对于这一步,我使用collections.Counter来跟踪与最近的邻居点重合的标签。 然后,我使用.most_common()方法返回最常见的标签。 注意:如果两个或两个以上标签之间的关系为“最常见”标签的标题,则Counter()对象首先遇到的标签将是返回的标签。
from collections import Counter


# Create counter object to track the labels


counter = Counter(y[df_nn.index])


# Get most common label of all the nearest neighbors


counter.most_common()[0][0]15.重复步骤1至4,直到对所有测试数据点进行分类 (5. Repeat steps 1 through 4 until all test data points are classified)
In this step, I put the code I’ve already written to work and write a function to classify the data using KNN. First, I perform a train_test_split on the data (75% train, 25% test), and then scale the data using StandardScaler(). Since KNN is distance-based, it is important to make sure that the features are scaled properly before feeding them into the algorithm.
在这一步中,我将已经编写的代码投入使用,并编写了一个使用KNN对数据进行分类的函数。 首先,我对数据执行train_test_split (75%的火车,25%的测试),然后使用StandardScaler()缩放数据。 由于KNN是基于距离的,因此在将特征输入算法之前,确保正确缩放特征很重要。
Additionally, to avoid data leakage, it is good practice to scale the features after the train_test_split has been performed. First, scale the data from the training set only (scaler.fit_transform(X_train)), and then use that information to scale the test set (scaler.tranform(X_test)). This way, I can ensure that no information outside of the training data is used to create the model.
此外,为避免数据泄漏,优良作法是在train_test_split执行之后缩放功能。 首先,仅缩放训练集中的数据 ( scaler.fit_transform(X_train) ),然后使用该信息来缩放测试集( scaler.tranform(X_test) )。 这样,我可以确保没有使用训练数据之外的任何信息来创建模型。
from sklearn.model_selection import train_test_split
from sklearn.preprocessing import StandardScaler


# Split the data - 75% train, 25% test


X_train, X_test, y_train, y_test = train_test_split(X, y, test_size=0.25,
                                                   random_state=1)


# Scale the X data


scaler = StandardScaler()
X_train = scaler.fit_transform(X_train)
X_test = scaler.transform(X_test)
Next, I define a function called knn_predict that takes in all of the training and test data, k, and p, and returns the predictions my KNN classifier makes for the test set (y_hat_test). This function doesn’t really include anything new — it is simply applying what I’ve already worked through above. The function should return a list of label predictions containing only 0’s, 1’s and 2’s.
接下来,我定义一个名为knn_predict的函数,该函数接收所有训练和测试数据k和p ,并返回我的KNN分类器对测试集所做的预测( y_hat_test )。 该功能实际上并没有包含任何新功能-只是应用了我上面已经完成的工作。 该函数应返回仅包含0、1和2的标签预测列表。
def knn_predict(X_train, X_test, y_train, y_test, k, p):

    # Counter to help with label voting
    from collections import Counter

    # Make predictions on the test data
    # Need output of 1 prediction per test data point
    y_hat_test = []


    for test_point in X_test:
        distances = []


        for train_point in X_train:
            distance = minkowski_distance(test_point, train_point, p=p)
            distances.append(distance)

        # Store distances in a dataframe
        df_dists = pd.DataFrame(data=distances, columns=['dist'],
                                index=y_train.index)

        # Sort distances, and only consider the k closest points
        df_nn = df_dists.sort_values(by=['dist'], axis=0)[:k]


        # Create counter object to track the labels of k closest neighbors
        counter = Counter(y_train[df_nn.index])


        # Get most common label of all the nearest neighbors
        prediction = counter.most_common()[0][0]

        # Append prediction to output list
        y_hat_test.append(prediction)

    return y_hat_test


# Make predictions on test dataset
y_hat_test = knn_predict(X_train, X_test, y_train, y_test, k=5, p=1)


print(y_hat_test)
[0, 1, 1, 0, 2, 1, 2, 0, 0, 2, 1, 0, 2, 1, 1, 0, 1, 1, 0, 0, 1, 1, 2, 0, 2, 1, 0, 0, 1, 2, 1, 2, 1, 2, 2, 0, 1, 0]And there they are! These are the predictions that this home-brewed KNN classifier has made on the test set. Let’s see how well it worked:
在那里! 这些是这个自制的KNN分类器对测试集所做的预测。 让我们看看它的效果如何:
# Get test accuracy score


from sklearn.metrics import accuracy_score


print(accuracy_score(y_test, y_hat_test))0.9736842105263158Looks like the classifier achieved 97% accuracy on the test set. Not too bad at all! But how do I know if it actually worked correctly? Let’s check the result of sklearn’s KNeighborsClassifier on the same data:
看起来分类器在测试集上达到了97%的准确性。 一点也不差! 但是我怎么知道它是否真的正常工作呢? 让我们在相同数据上检查sklearn的KNeighborsClassifier的结果:
# Testing to see results from sklearn.neighbors.KNeighborsClassifier


from sklearn.neighbors import KNeighborsClassifier


clf = KNeighborsClassifier(n_neighbors=5, p=1)
clf.fit(X_train, y_train)
y_pred_test = clf.predict(X_test)


print(f"Sklearn KNN Accuracy: {accuracy_score(y_test, y_pred_test)}")
Sklearn KNN Accuracy: 0.9736842105263158Nice! sklearn’s implementation of the KNN classifier gives us the exact same accuracy score.
真好! sklearn对KNN分类器的实现为我们提供了完全相同的准确性得分。
探索变化k的影响 (Exploring the effect of varying k)
My KNN classifier performed quite well with the selected value of k = 5. KNN doesn’t have as many tune-able parameters as other algorithms like Decision Trees or Random Forests, but k happens to be one of them. Let’s see how the classification accuracy changes when I vary k:
我的KNN分类器在选定的k = 5时表现很好。KNN没有像决策树或随机森林之类的其他算法那么多的可调参数,但k恰好是其中之一。 让我们看看改变k时分类精度如何变化:
# Obtain accuracy score varying k from 1 to 99


accuracies = []


for k in range(1,100):
    y_hat_test = knn_predict(X_train, X_test, y_train, y_test, k, p=1)
    accuracies.append(accuracy_score(y_test, y_hat_test))


# Plot the results


fig, ax = plt.subplots(figsize=(8,6))
ax.plot(range(1,100), accuracies)
ax.set_xlabel('# of Nearest Neighbors (k)')
ax.set_ylabel('Accuracy (%)');
In this case, using nearly any k value less than 20 results in great (>95%) classification accuracy on the test set. However, when k becomes greater than about 60, accuracy really starts to drop off. This makes sense, because the data set only has 150 observations — when k is that high, the classifier is probably considering labeled training data points that are way too far from the test points.
在这种情况下,几乎使用任何小于20的k值,都可以在测试集上实现较高的分类精度(> 95%)。 但是,当k大于约60时,精度实际上开始下降。 这是有道理的,因为数据集只有150个观察值-当k很高时,分类器可能正在考虑与测试点相距太远的标记训练数据点。
每个邻居都有投票权吗? (Every neighbor gets a vote — or do they?)
In writing my own KNN classifier, I chose to overlook one clear hyperparameter tuning opportunity: the weight that each of the k nearest points has in classifying a point. In sklearn’s KNeighborsClassifier, this is the weights parameter, and it can be set to ‘uniform’, ‘distance’, or another user-defined function.
在编写自己的KNN分类器时,我选择忽略了一个明确的超参数调整机会: k个最近点中的每一个在对点进行分类时所具有的权重。 在sklearn的KNeighborsClassifier中 ,这是weights参数,可以将其设置为'uniform' , 'distance'或其他用户定义的函数。
When set to ‘uniform’, each of the k nearest neighbors gets an equal vote in labeling a new point. When set to ‘distance’, the neighbors in closest to the new point are weighted more heavily than the neighbors farther away. There are certainly cases where weighting by ‘distance’ would produce better results, and the only way to find out is through hyperparameter tuning.
当设置为'uniform'时 ,k个最近的邻居中的每一个在标记新点时都会得到平等的投票。 设置为“距离”时 ,最接近新点的邻居的权重要比更远的邻居的权重大。 当然,在某些情况下,按“距离”进行加权会产生更好的结果,唯一的找出方法是通过超参数调整。
最后的想法 (Final Thoughts)
Now, make no mistake — sklearn’s implementation is undoubtedly more efficient and more user-friendly than what I’ve cobbled together here. However, I found it a valuable exercise to work through KNN from ‘scratch’, and it has only solidified my understanding of the algorithm. I hope it did the same for you!
现在,请不要误解-sklearn的实现无疑比我在这里拼凑的实现更加有效和用户友好。 但是,我发现从“从头开始”通过KNN进行工作是一个有价值的练习,并且它仅巩固了我对算法的理解。 希望对您也一样!
翻译自: https://towardsdatascience.com/how-to-build-knn-from-scratch-in-python-5e22b8920bd2
python中knn


 481
481

 被折叠的 条评论
为什么被折叠?
被折叠的 条评论
为什么被折叠?
 到【灌水乐园】发言


