


对警报线程池的警报线程
TL; DR (TL;DR)
Download tutorial code here
在此处下载教程代码
介绍 (Intro)
So there are number of tutorials available for monitoring and alerting using Prometheus and this is another one. The reason I had to write this was the time it took me to setup and configure it locally. The resources are numerous but I couldn’t find a single step by step code tut that could share a practical code approach.
因此,有许多教程可用于使用Prometheus进行监视和警报,这是另一篇。 我不得不写这篇文章的原因是花了我在本地设置和配置它的时间。 资源很多,但是我找不到可以共享实用代码方法的一步一步的代码。
This tutorial will take you on an experiment using prometheus with Java Spring Boot framework.
本教程将带您进行将Prometheus与Java Spring Boot框架一起使用的实验。
本教程适合具有以下领域中级技能的人员 (This tutorial is suited for people having intermediate skills in below areas)
- Java and Spring framework Java和Spring框架
- Maven Maven
- CLI/YML CLI / YML
THIS IS NOT A INFRA SETUP OR DEEP-DIVE TUT FOR PROMETHEUS. Tutorial is targeted for code integration only
这不是用于PROMETHEUS的INFRA设置或深潜TUT。 教程仅针对代码集成
什么是普罗米修斯? (What is Prometheus?)
An app monitoring and alerting tool.
一个应用程序监视和警报工具。
你为什么需要它? (Why do you need it?)
Building awesome software products is one part and maintaining them is another part. As you grow as a software professional you would realise the most important part of software is gathering metrics and gauging health of your services for an uninterrupted customer experience.
构建出色的软件产品是其中的一部分,而维护它们则是另一部分。 随着您成为软件专业人员的成长,您将意识到软件的最重要部分是收集指标并评估服务的运行状况,以实现不间断的客户体验。
你是怎么做到的? (How you do it?)
第1步: (Step 1:)
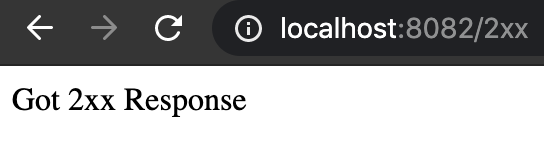
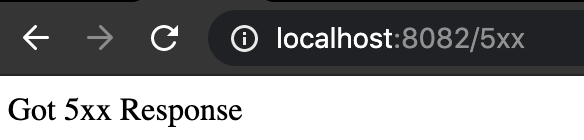
The tutorial assumes you have Java/ Spring framework background. First of all let’s setup a simple Spring Boot Application. Download the complete code here. You will see 3 APIs here simulating a simple 2XX response and another a simple 5XX response and last /alert-hook to receive a callback when an alert comes (more details in Step 4).
本教程假定您具有Java / Spring框架背景。 首先,让我们设置一个简单的Spring Boot Application。 在此处下载完整的代码。 您将在此处看到3个API,它们模拟一个简单的2XX响应,另一个模拟一个简单的5XX响应,最后一个/ alert-hook会在警报到来时接收回调(步骤4中有更多详细信息)。
The metrics settings and server port 8082 can be configured via application.properties file
指标设置和服务器端口8082可以通过application.properties文件进行配置
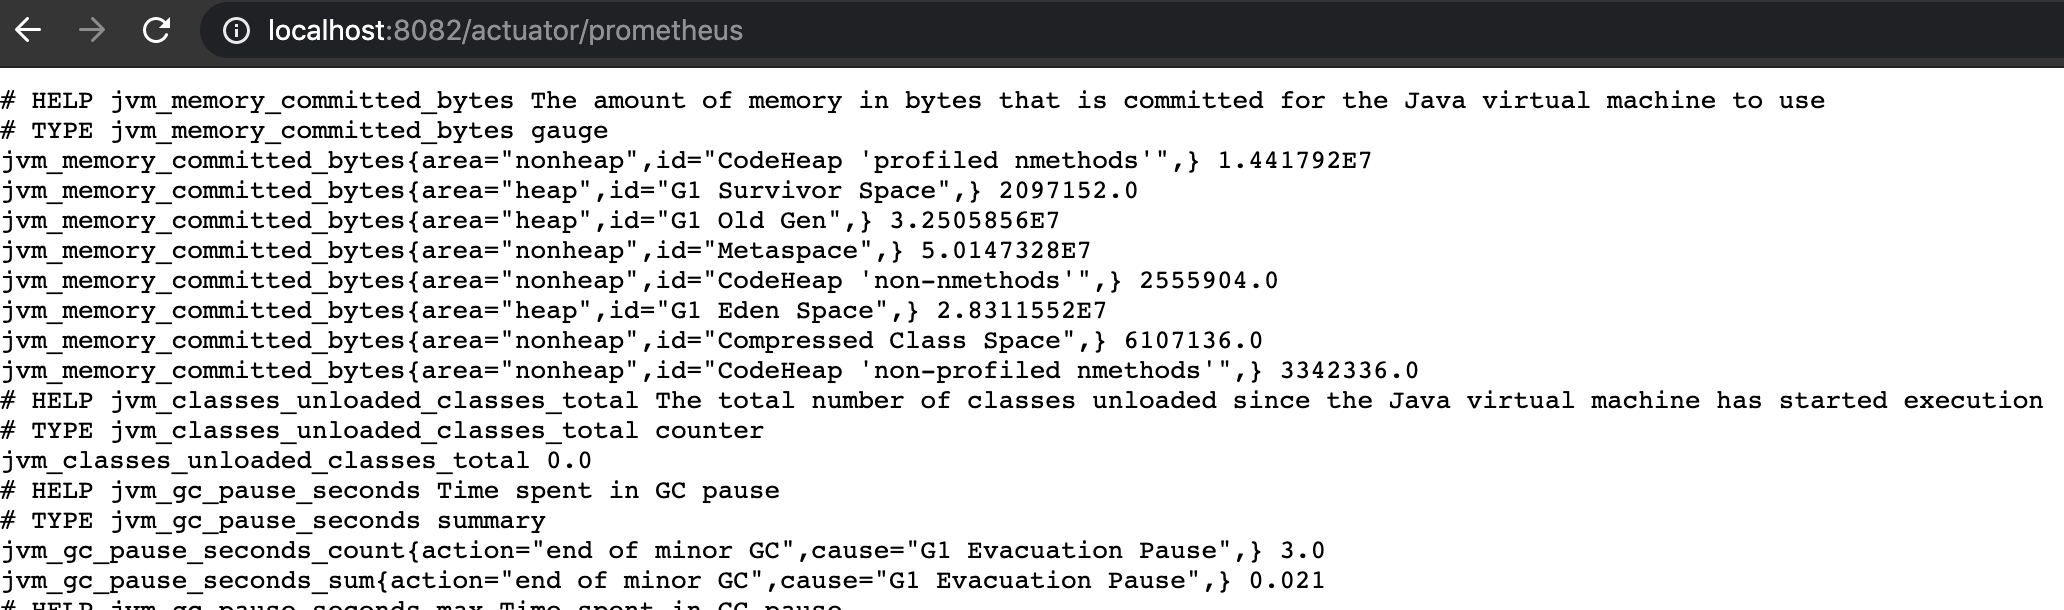
The code uses a library called micrometer to create metrics that Prometheus can understand. These metrics are available over http://localhost:8082/actuator/prometheus
该代码使用称为测微计的库来创建Prometheus可以理解的指标。 这些指标可通过http:// localhost:8082 / actuator / prometheus获得
第2步: (Step 2:)
In a situation when your app starts misbehaving and starts throwing 5xx, you would want to proactively act on this situation w/o your customers letting you know about this situation. Thats where the tool like prometheus comes in.
在您的应用开始行为异常并开始抛出5xx的情况下,您可能希望在没有客户的情况下主动对这种情况采取行动,让您知道这种情况。 那就是像prometheus这样的工具出现的地方。
So lets install Prometheus (on MAC for me)
因此,让我们安装Prometheus(对我来说是在MAC上)
Download Prometheus binary here, unzip and do the following bare minimum configs.
在此处下载Prometheus二进制文件,解压缩并执行以下最低限度的配置。
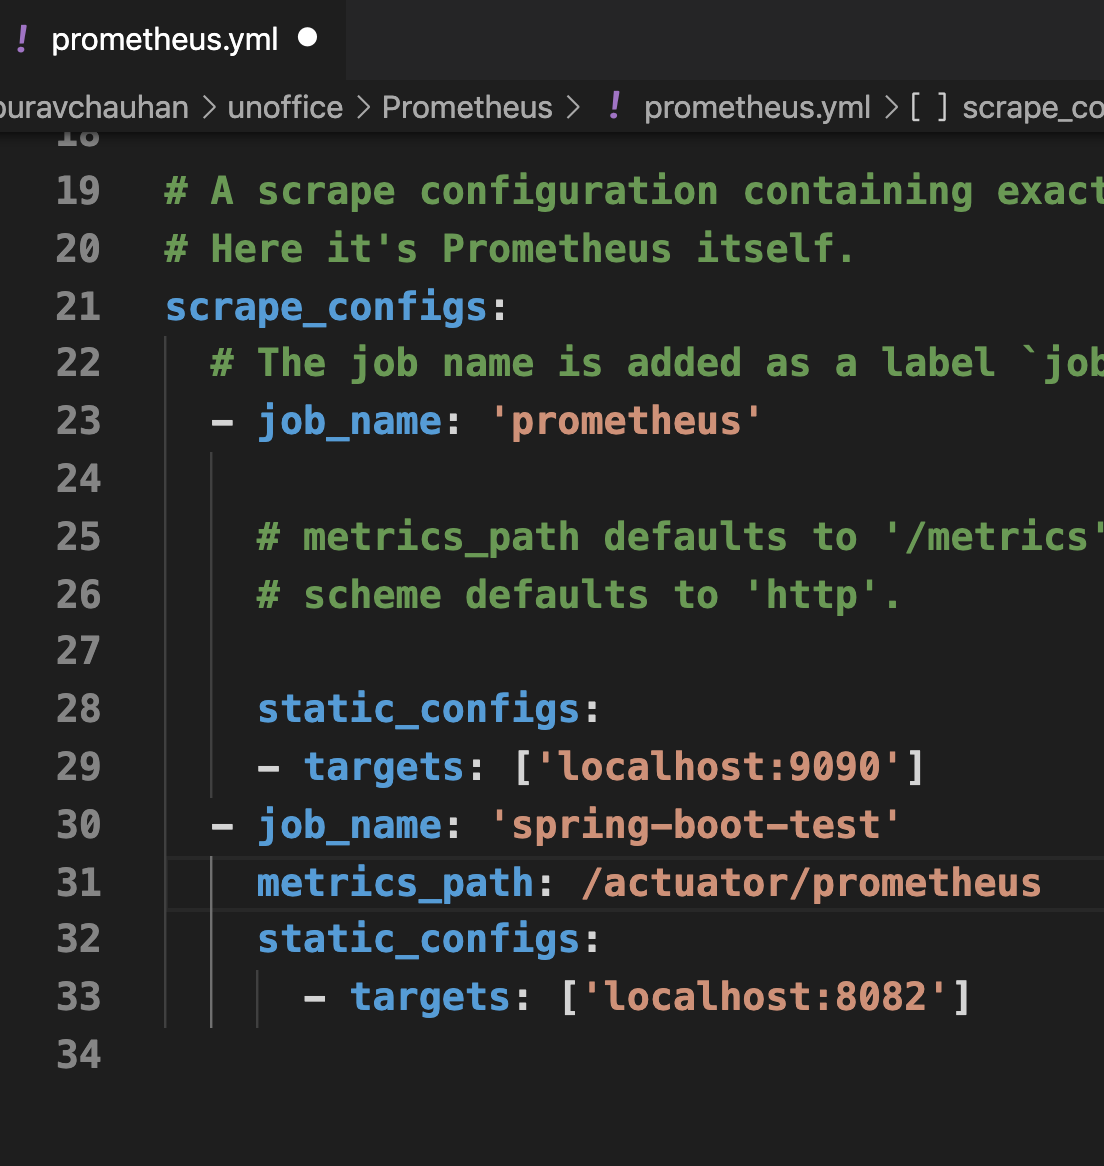
Open prometheus.yml in the downloaded folder and add your Spring boot application info so that Prometheus can pull in the metrics. See line 30 where we have added a new target telling Prometheus where to pull metrics
在下载的文件夹中打开prometheus.yml ,然后添加您的Spring boot应用程序信息,以便Prometheus可以获取指标。 参见第30行,我们在其中添加了一个新的目标,告诉Prometheus在哪里提取指标
From your command prompt, cd into Prometheus dir and start the prometheus process. (It will automatically read above config file if the process is started in prometheus dir)
在命令提示符下,使用cd进入Prometheus目录,然后启动Prometheus进程。 (如果该过程在prometheus dir中启动,它将自动读取上述配置文件)
>>> ./prometheus
>>> ./prometheus
This should start prometheus server with some default setting like time interval after which prometheus will pull in the metrics.
这将使用一些默认设置(例如时间间隔)启动Prometheus服务器,此后Prometheus将提取指标。
After prometheus is started, visit http://localhost:9090/graph to view the Prometheus panel where you can query and view the metrics pushed by our Boot app.
启动Prometheus之后,请访问http:// localhost:9090 / graph以查看Prometheus面板,您可以在其中查询和查看由Boot应用程序推送的指标。
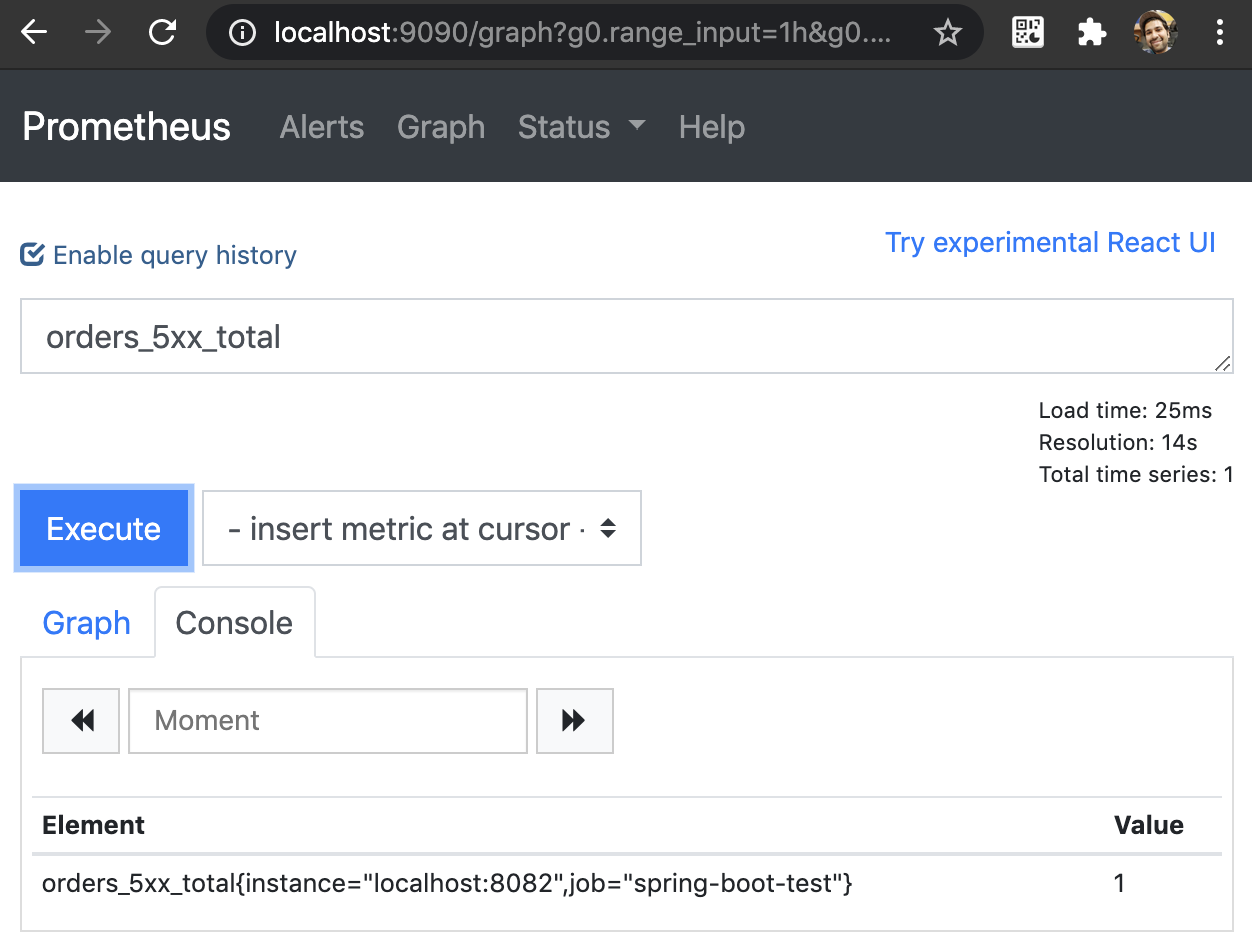
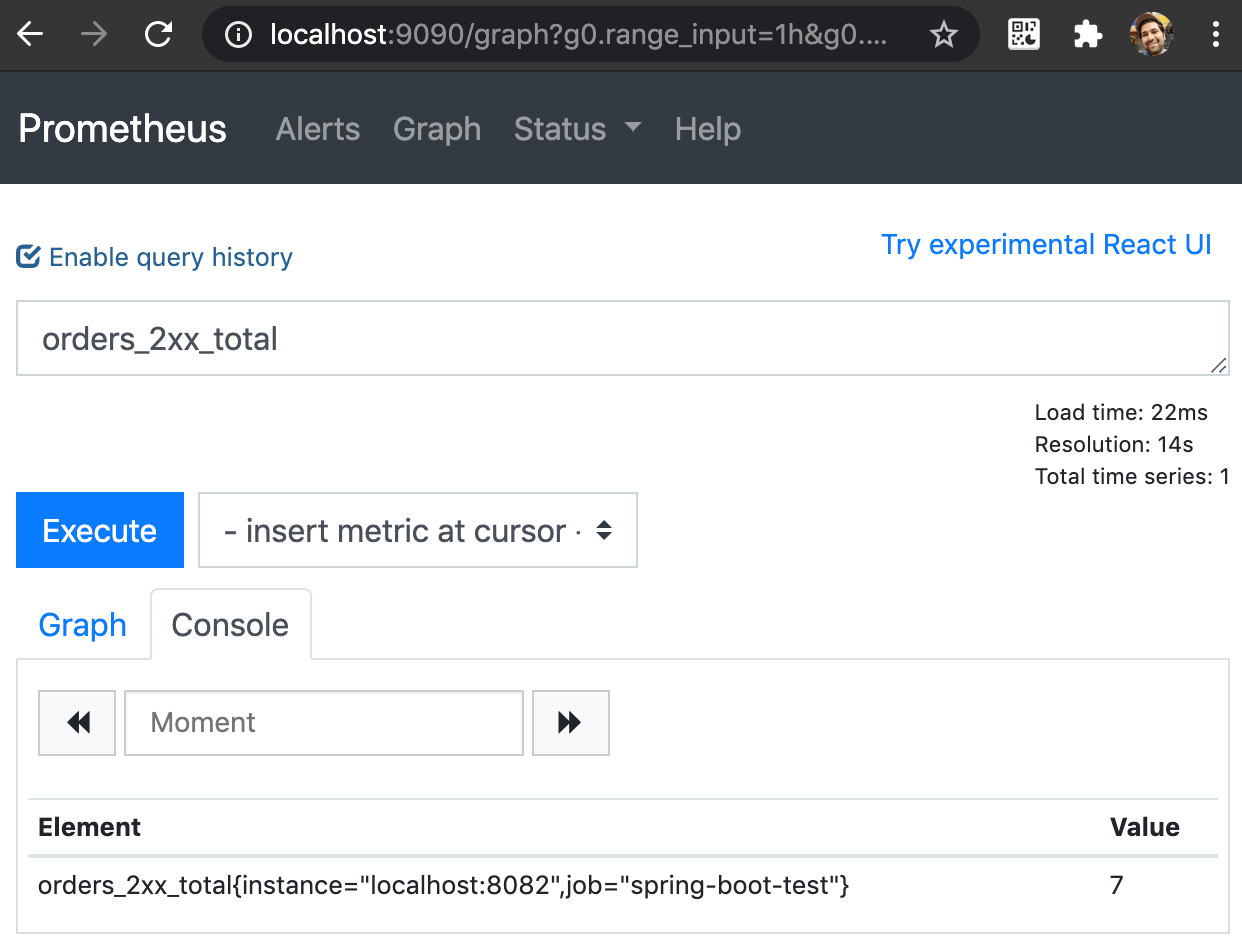
Try querying the metrics like shown in below screenshot.
尝试查询指标,如下面的屏幕截图所示。
orders_5xx_total and orders_2xx_total are the metrics which we pushed from our app
orders_5xx_total和orders_2xx_total是我们从应用程序中推送的指标
第三步: (Step 3:)
Till now you have collected the data and now it’s time to set alerts on top of this data. A very important alert that you would need is the error rate breaching a threshold.
到目前为止,您已经收集了数据,现在该在此数据之上设置警报了。 您需要的一个非常重要的警报是错误率超过阈值。
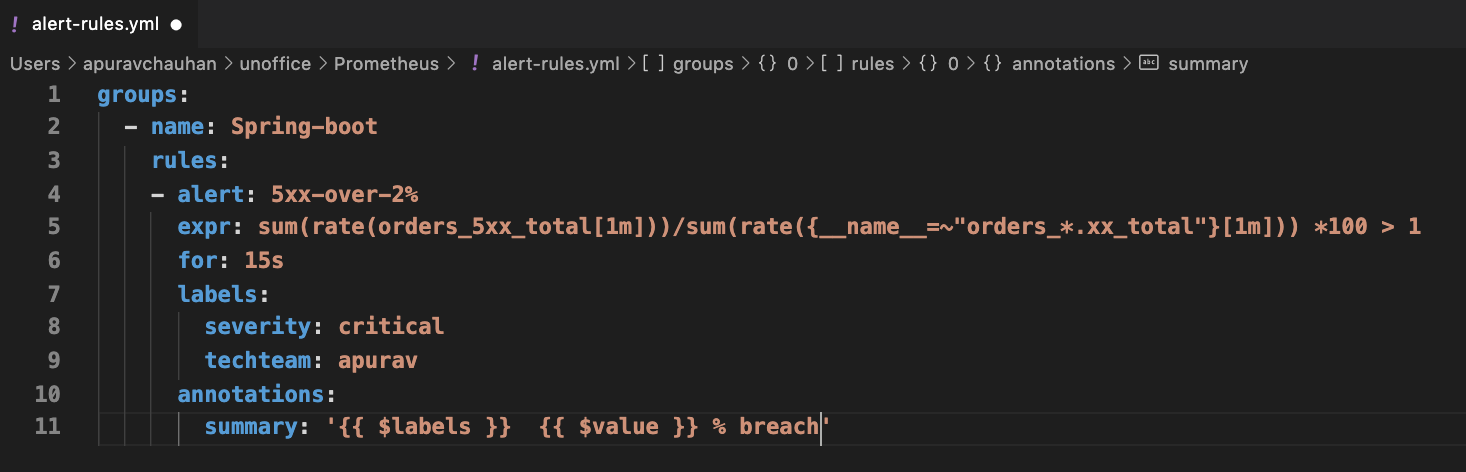
For this example, we will set an alert which will trigger if 5xx rate is more than 1%.
对于此示例,我们将设置一个警报,如果5xx比率大于1%,则将触发该警报。
Let’s create a rules file that will have our condition represented in prometheus query language and some information that we want to push when this alert is triggered.
让我们创建一个规则文件,该文件将以普罗米修斯查询语言表示我们的条件,并在触发此警报时要推送的一些信息。
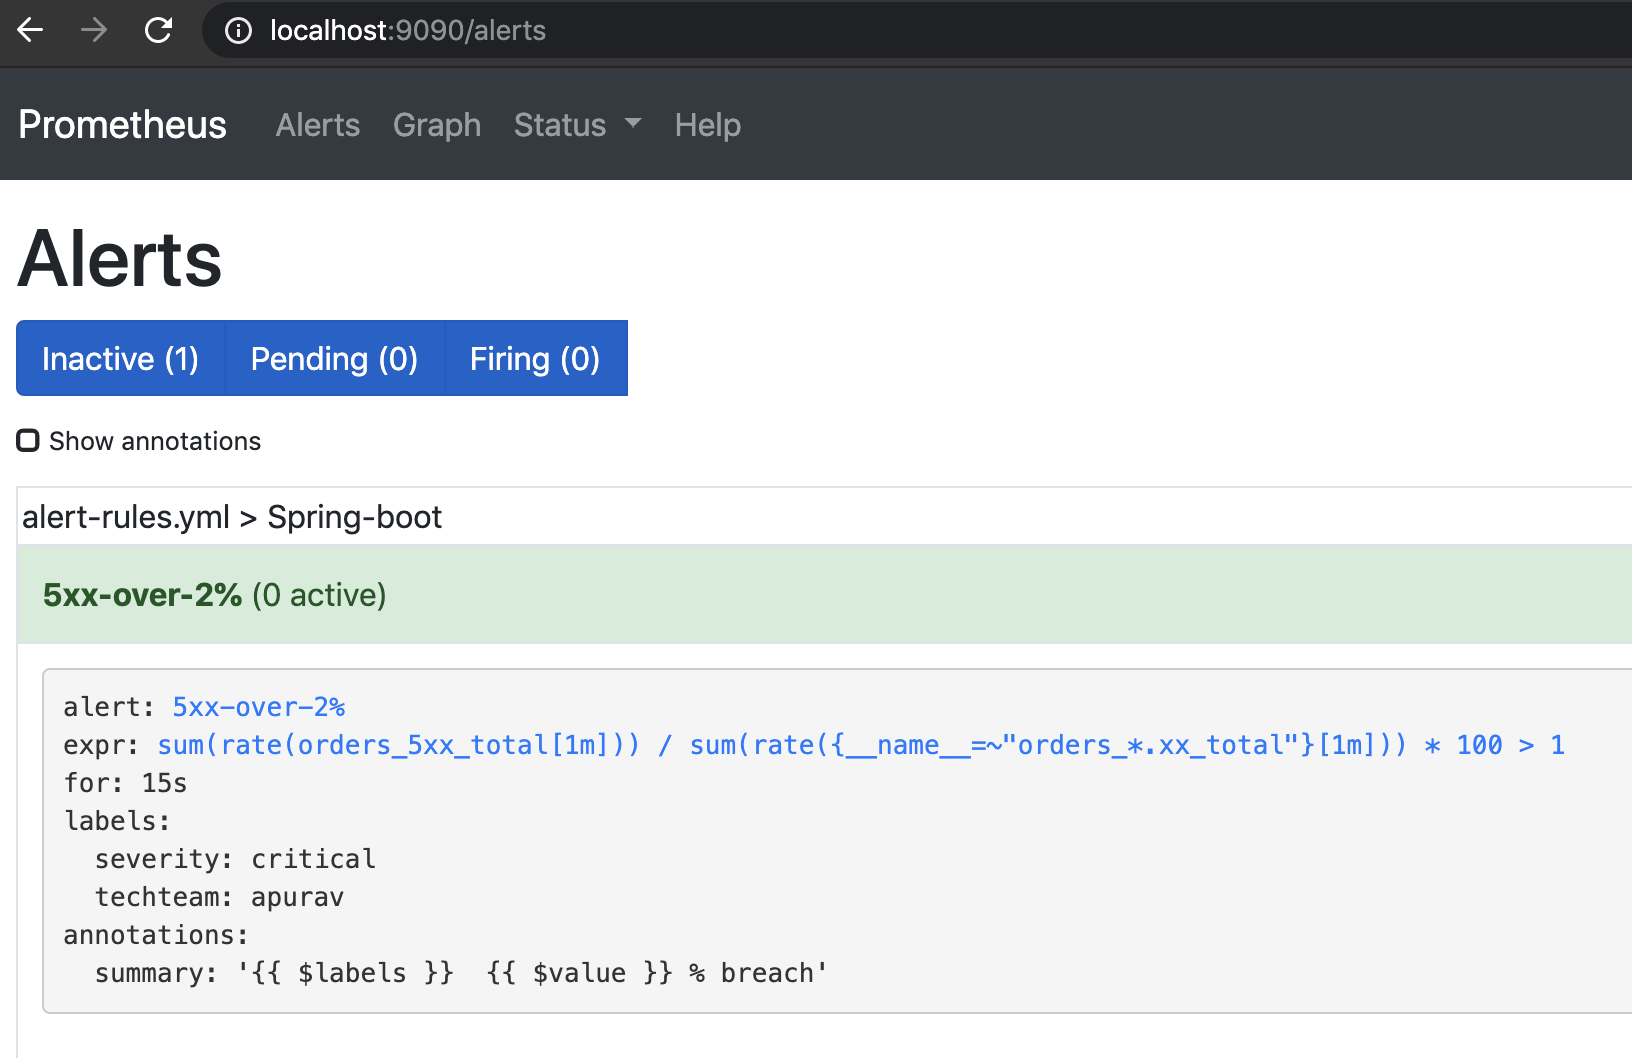
alert-rules.yml is our sample rule file which looks like below. (Gist available in the end)
alert-rules.yml是我们的示例规则文件,如下所示。 (要点最后可用)
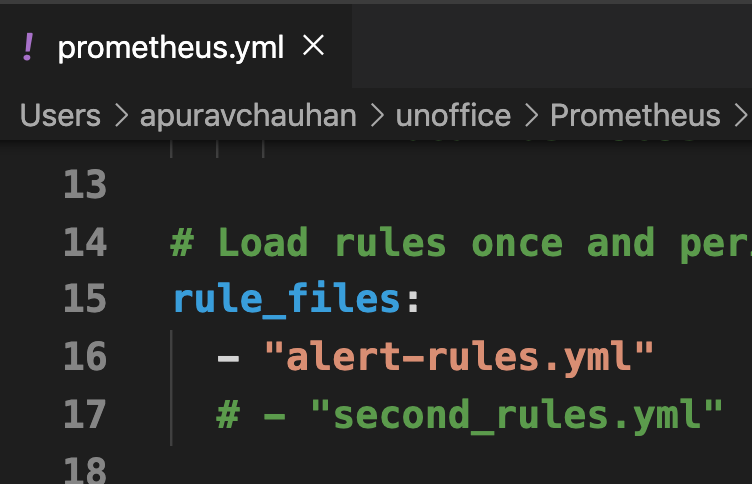
Update prometheus.yml with the info of this file using below configs
使用以下配置,使用此文件的信息更新prometheus.yml
Restart the prometheus server and you should see below Alerts info if you visit Alerts section in panel
重新启动prometheus服务器,如果您访问面板中的“警报”部分,则应该在下面看到警报信息
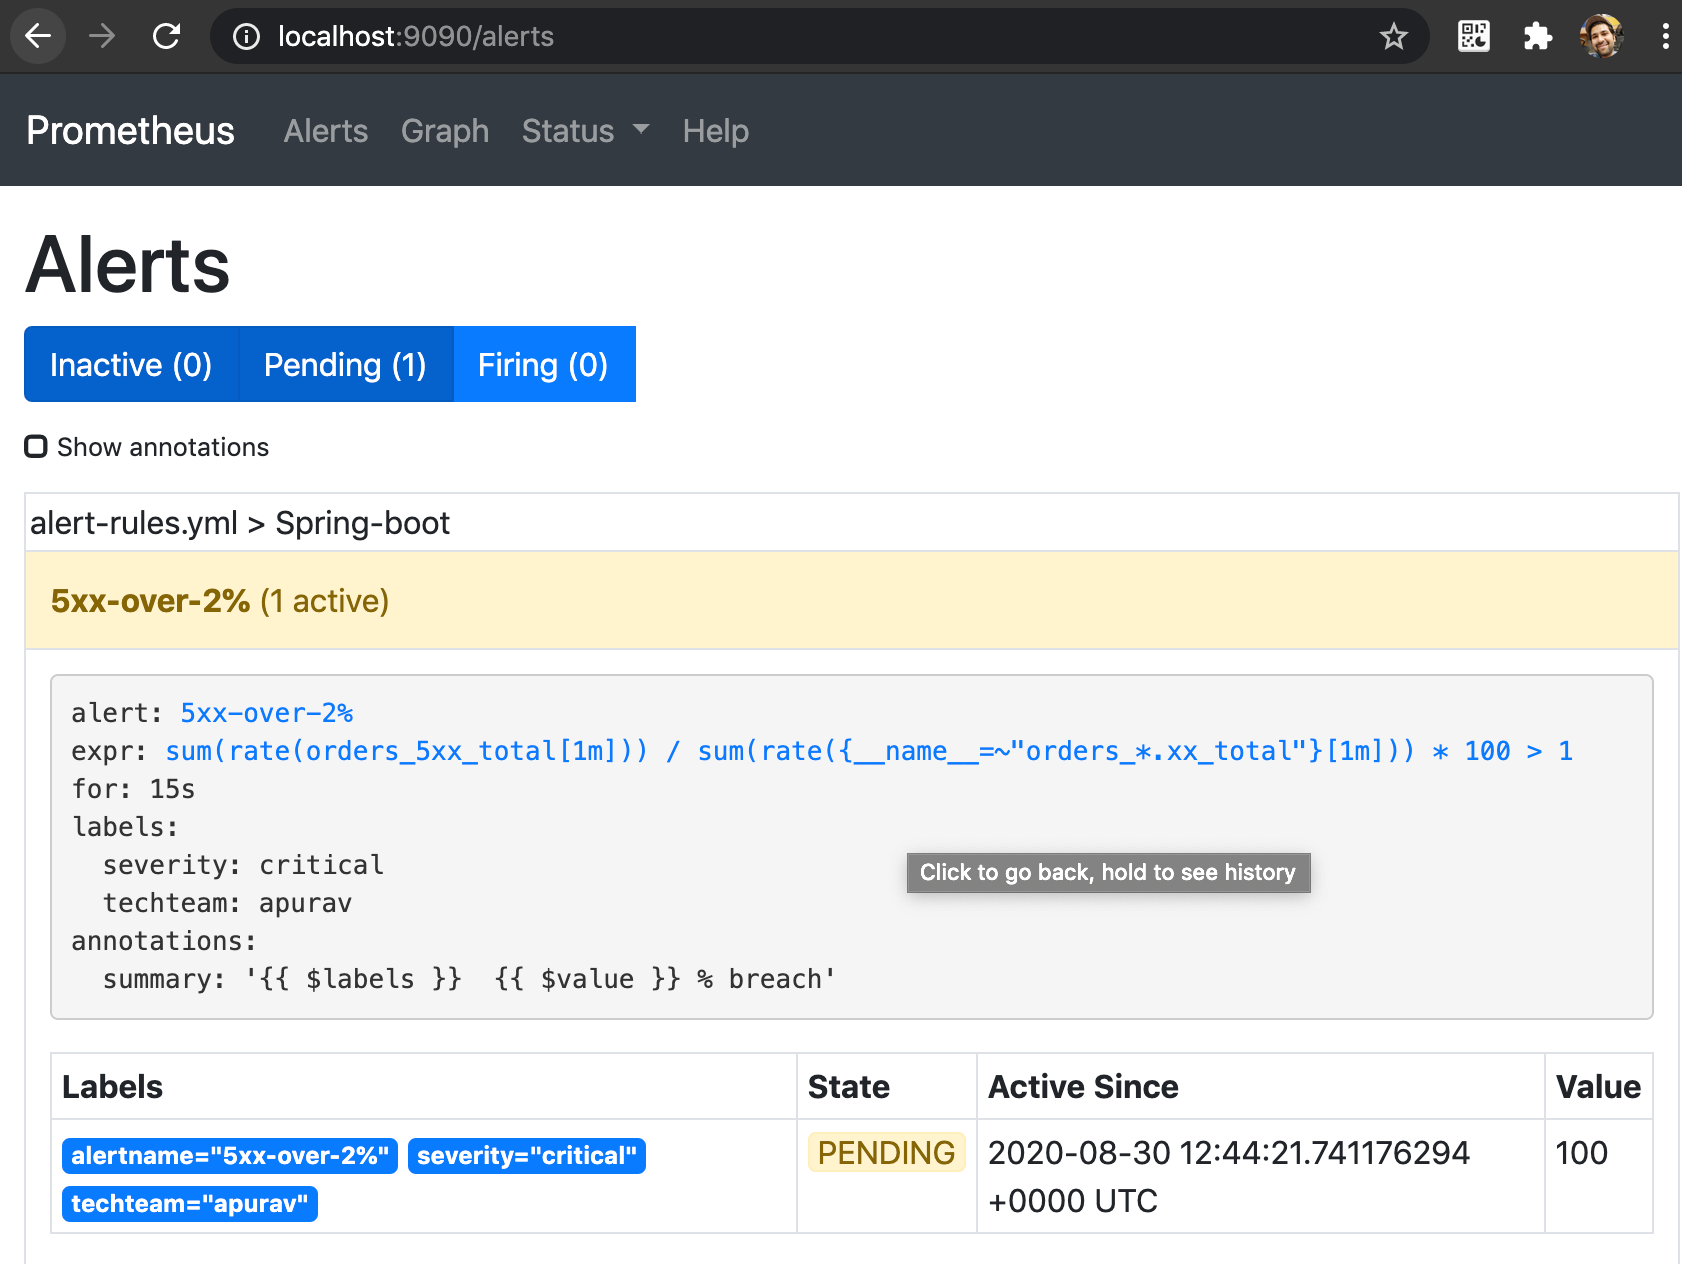
Now to simulate the alert scenario, let’s hit a few 5xx urls and few 2xx urls from our spring boot app. Make sure 5xx hits are more than 2xx
现在模拟警报场景,让我们从我们的Spring Boot应用程序中点击几个5xx网址和几个2xx网址。 确保5xx命中大于2xx
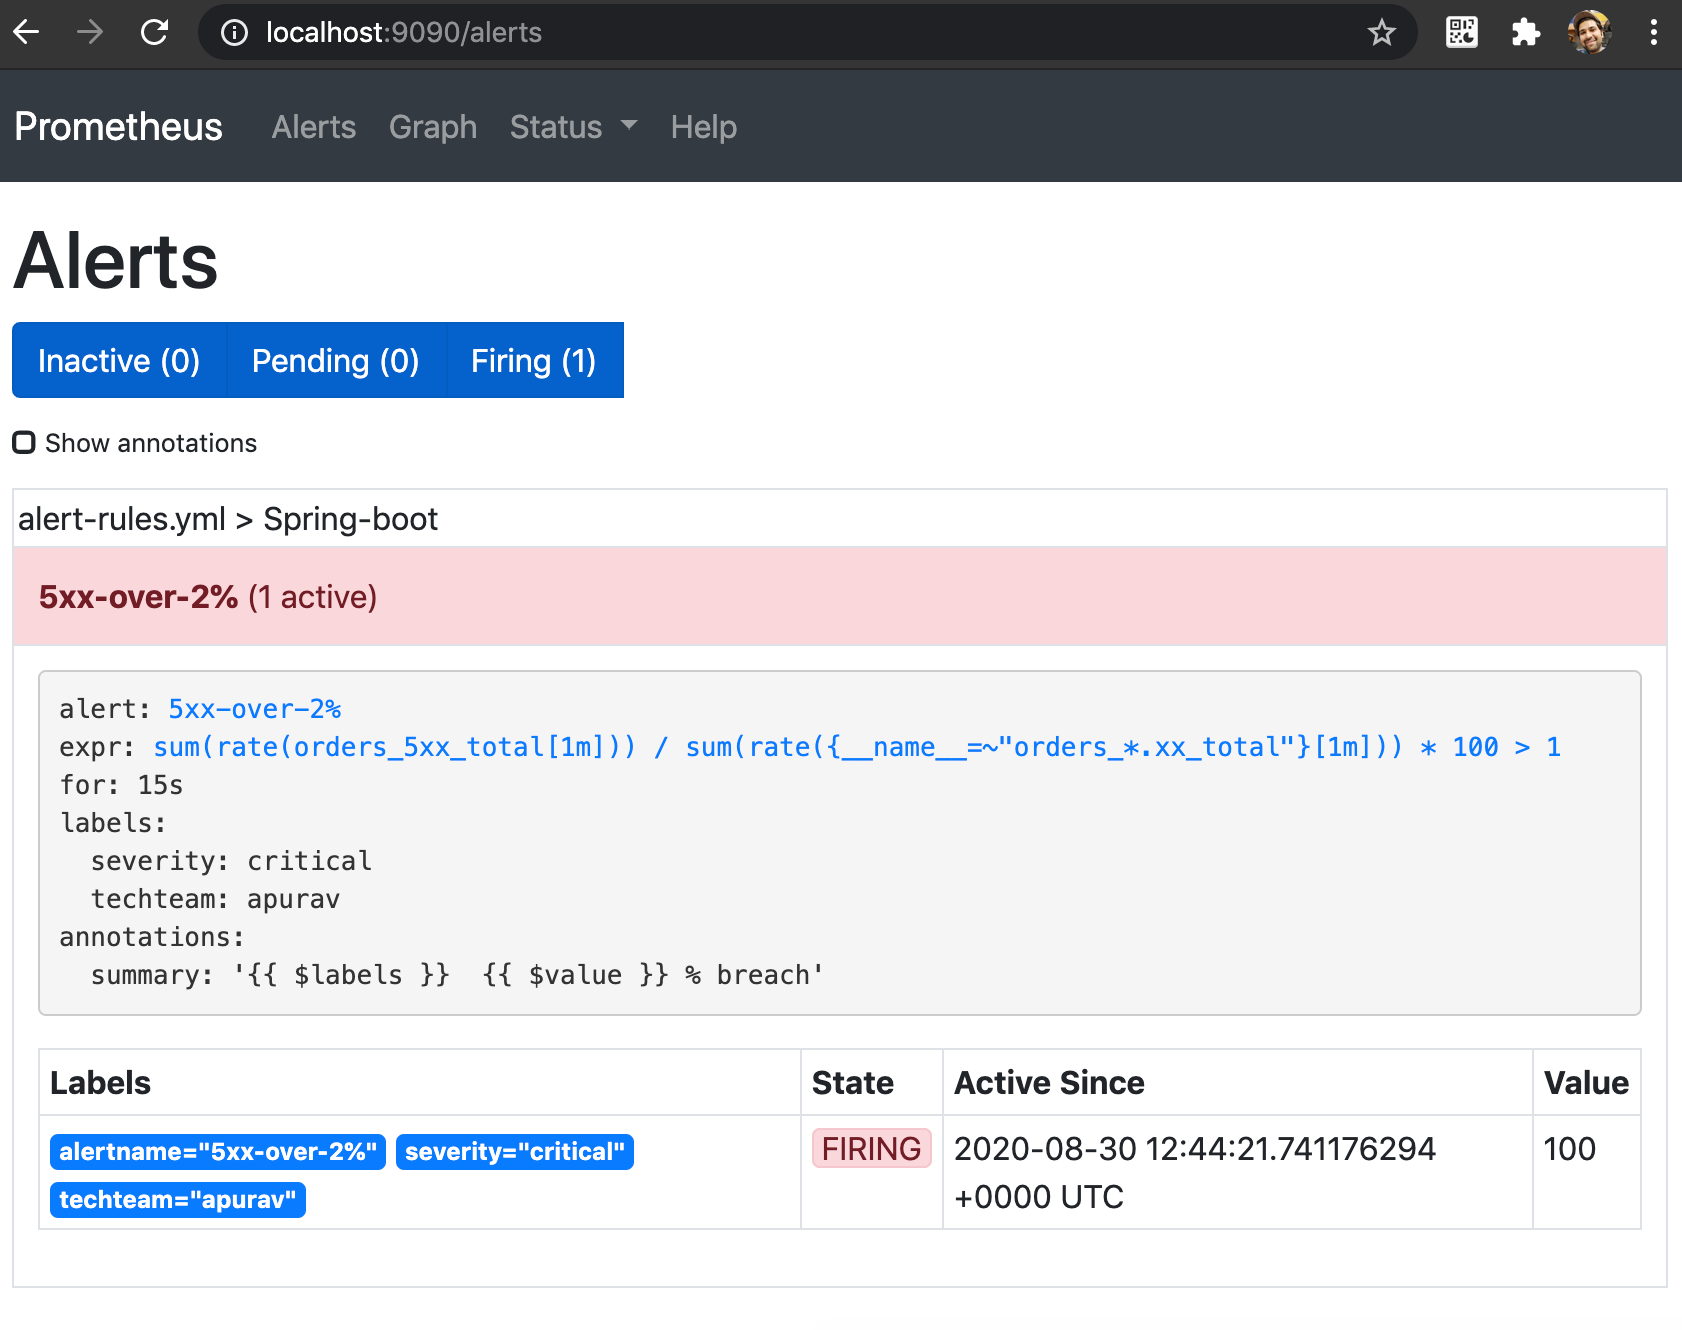
After few seconds (of Rule evaluation/Scrape interval time), you will start seeing Alert Status go into Pending and then into Firing, which means Alert has been triggered.
几秒钟(“规则评估/抓取间隔时间”)后,您将开始看到“警报状态”进入“待处理”,然后进入“开火”,这意味着已触发警报。
第4步 (Step 4)
To get this Alert over various channels like Emails/Webhooks/Slack etc we need another tool called AlertManager.
要通过各种渠道(例如电子邮件/ Webhooks / Slack等)获取此警报,我们需要另一个名为AlertManager的工具。
Download Alertmanager binary here and connect prometheus to alertmanager by updating the alertmanager.yml configuration first.
在此处下载Alertmanager二进制文件,并通过首先更新alertmanager.yml配置将prometheus连接到alertmanager。
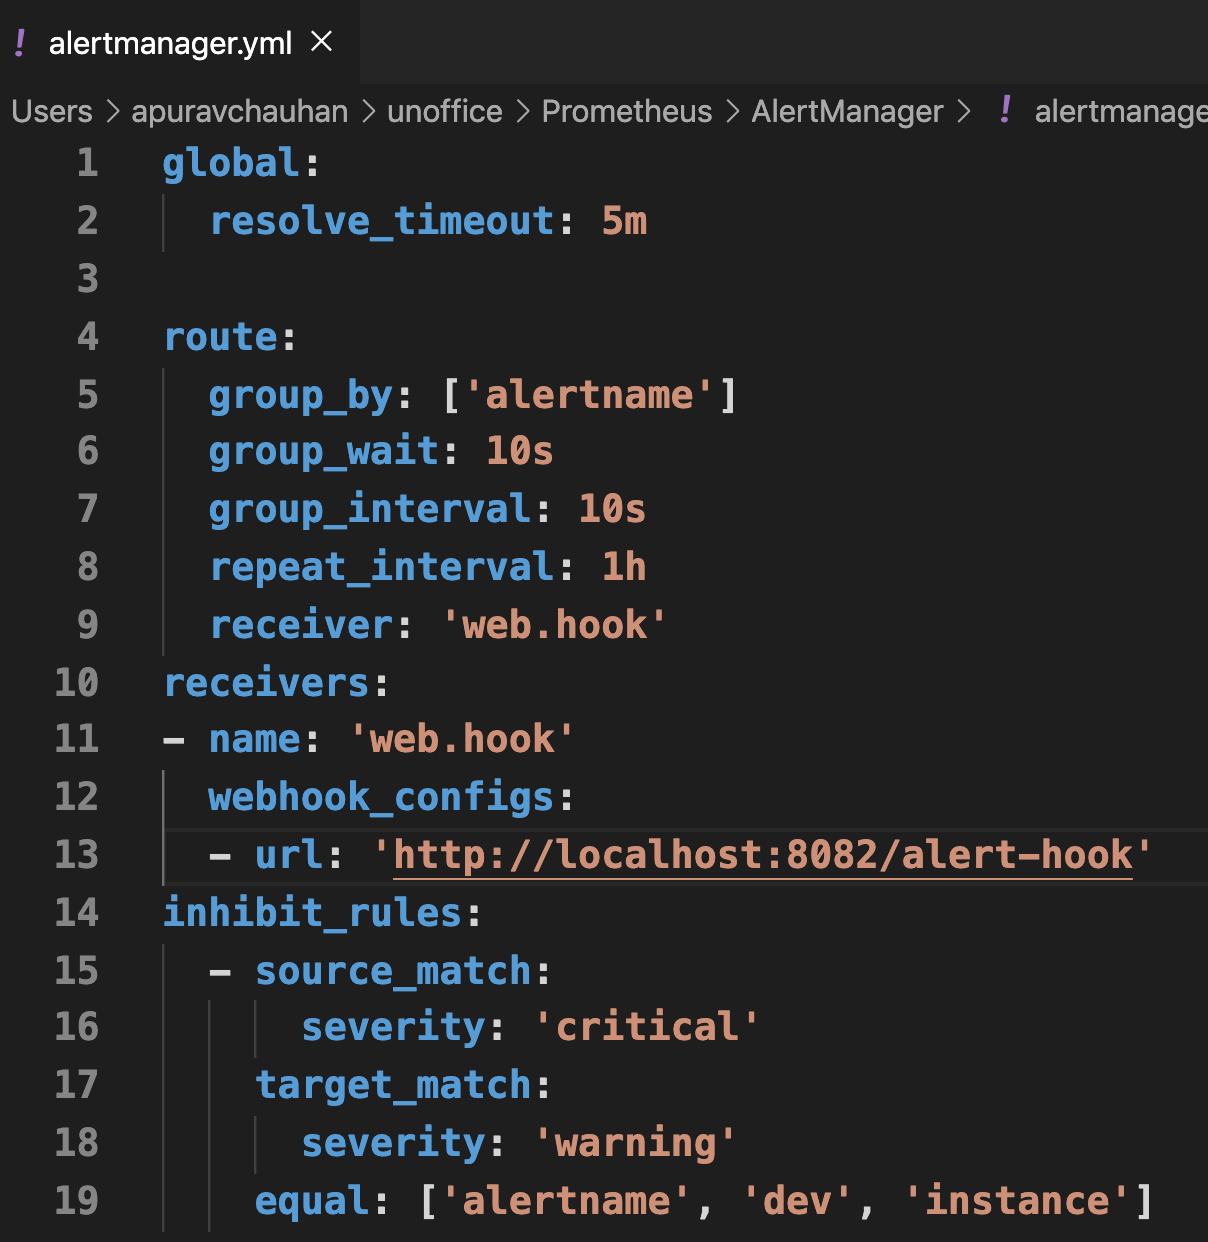
In alertmanager.yml, update line 13 (see below screenshot) to point to api /alert-hook in our spring boot app. It means when ever an alert will come, AlertManager will notify us at this location.
在alertmanager.yml中,更新第13行(请参见下面的屏幕截图)以指向我们的Spring Boot应用程序中的api / alert-hook。 这意味着,每当有警报发出时,AlertManager都会在此位置通知我们。
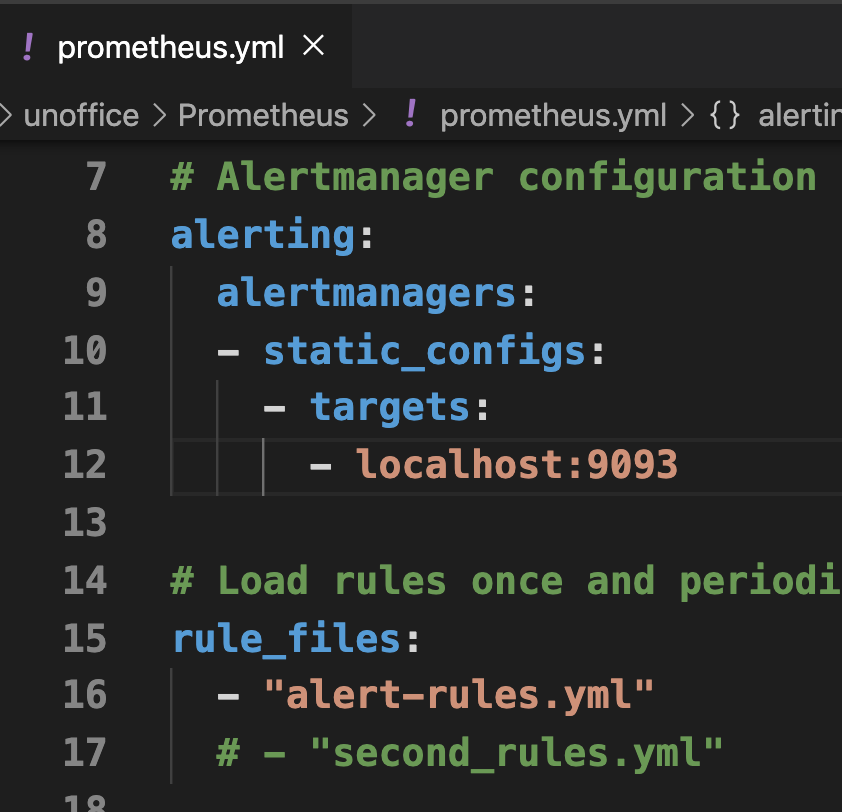
Secondly update, prometheus.yml to connect to Alertmanager server. See below screenshot line 12 of prometheus.yml
其次,更新prometheus.yml以连接到Alertmanager服务器。 参见下面的prometheus.yml屏幕截图第12行
Now run alertmanager from your CLI
现在从您的CLI运行alertmanager
>>./alertmanager
>> ./ alertmanager
and restart the prometheus server
并重新启动Prometheus服务器
>>./prometheus
>> ./普罗米修斯
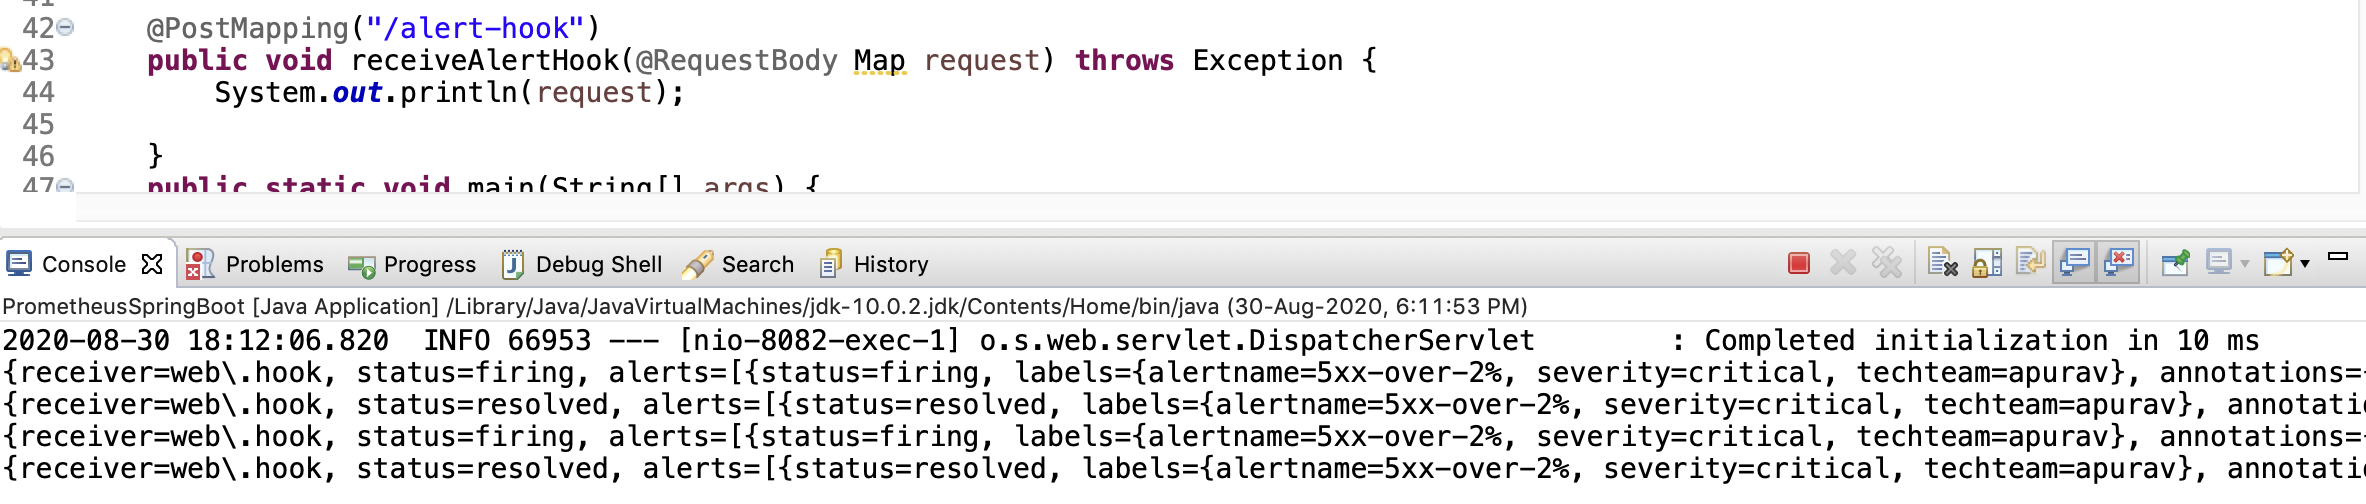
Now if you hit some 5xx more via spring boot API, you should see in your spring boot application console that after few seconds of evaluation, an alert was triggered and received a callback at /alert-hook API
现在,如果您通过Spring Boot API再打5xx,您应该在Spring Boot应用程序控制台中看到经过几秒钟的评估之后,警报已触发并在/ alert-hook API处收到了回调
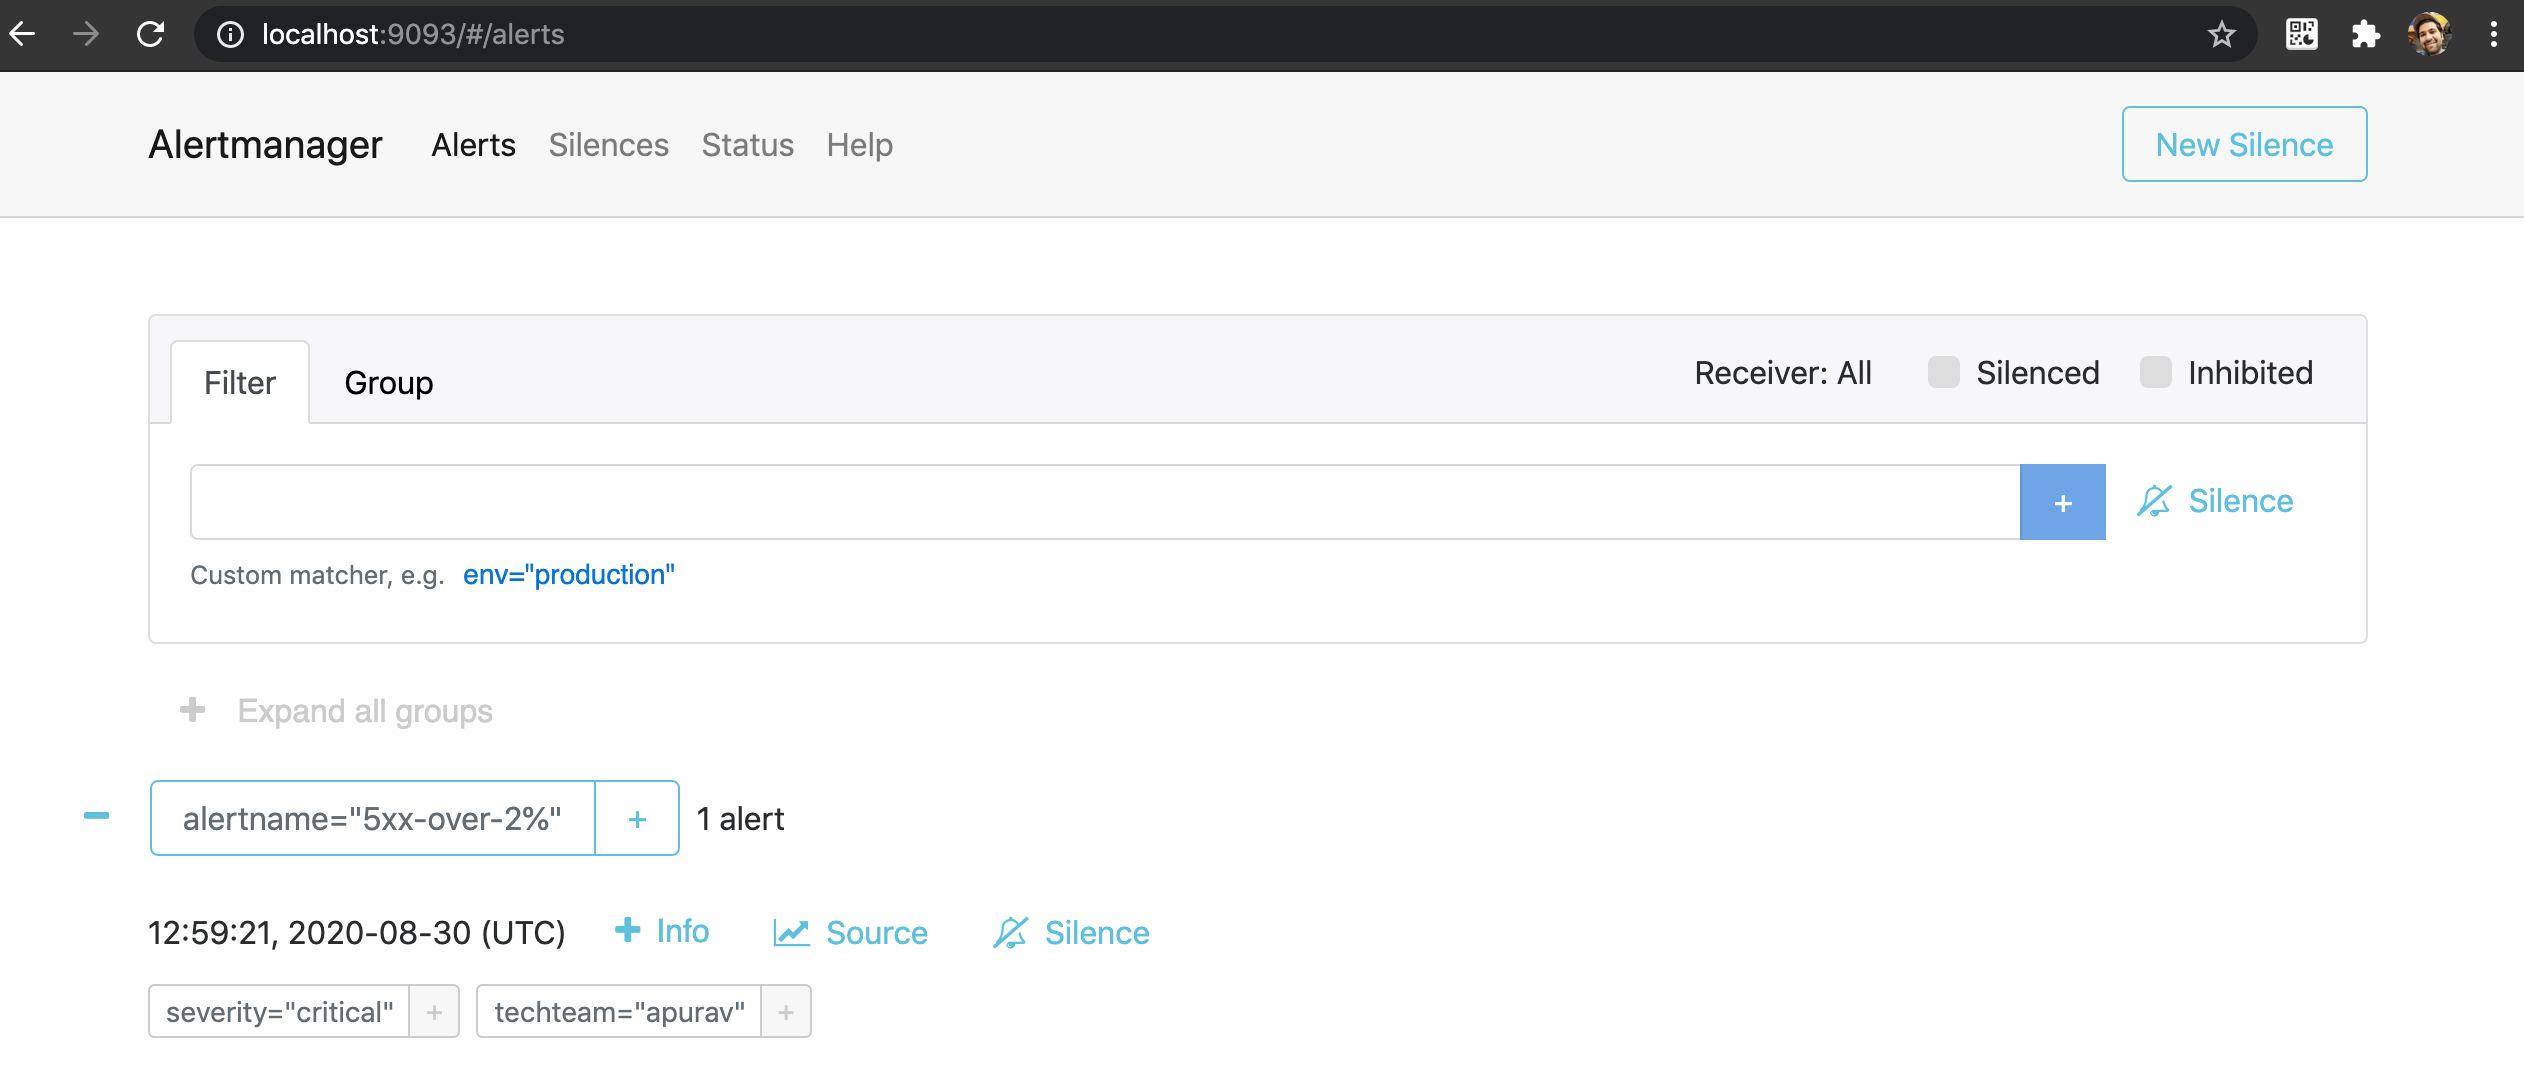
You can also validate this via Alertmanager Panel, available
您也可以通过Alertmanager面板(可用)进行验证
http://localhost:9093/#/alerts
http:// localhost:9093 /#/ alerts
And printing callback via your boot console logs
并通过启动控制台日志打印回调
进一步阅读 (Further Reading)
This tutorial has touched monitoring and alerting from a 100ft view. You should deep dive now to understand architecture in details, Prometheus Query language, aggregate functions and more. If you were able to connect the dots and share the vision, start going through official docs here.
本教程从100英尺视图触及了监视和警报。 现在,您应该深入研究,以详细了解体系结构,Prometheus Query语言,聚合函数等。 如果您能够连接各个点并分享愿景,请在此处开始阅读官方文档。
资料下载 (Downloads)
Code used in the tutorial is open-sourced and is available at Github. Download here
本教程中使用的代码是开源的,可以在Github上找到。 在这里下载
Complete prometheus.yml and alertmanager.yml and alert-rules.yml are available as Gists below
完整的prometheus.yml和alertmanager.yml和alert-rules.yml可作为以下要点获得
对警报线程池的警报线程


 423
423


 被折叠的 条评论
为什么被折叠?
被折叠的 条评论
为什么被折叠?
 到【灌水乐园】发言


