


python 代码简化
So you’ve written a piece of Python code and it does the job. Great, but is your code sufficiently simple? Complex code is difficult to read and makes code maintenance more costly. Catching complexity early can save time, money, and a lot of frustration. In this post, I’ll show you how to use the wily command-line tool to trace the complexity of your code over time.
因此,您编写了一段Python代码,即可完成工作。 很好,但是您的代码足够简单吗? 复杂的代码难以阅读,并使代码维护成本更高。 尽早捕获复杂性可以节省时间,金钱和很多挫败感。 在本文中,我将向您展示如何使用巧妙的命令行工具来跟踪代码随时间推移的复杂性。
代码复杂性快速入门 (A quick primer in code complexity)
Code complexity matters. Unnecessarily complex code is harder to read, and more difficult to maintain. If your code is hard to understand, it’s harder to spot existing bugs and easier to introduce new ones. Clunky code complicates teamwork, and makes it hard to get new colleagues up to speed. There’s a reason why tech companies have complexity thresholds that must be met.
代码复杂性很重要。 不必要的复杂代码更难阅读,也更难以维护。 如果您的代码难以理解,则很难发现现有的错误,也更容易引入新的错误。 笨拙的代码使团队合作变得复杂,并使新同事难以跟上进度。 科技公司有必须满足的复杂性阈值是有原因的。
Developers use several different measures of code complexity. Two such measures are universally represented in complexity analysis tools.
开发人员使用几种不同的代码复杂度度量。 复杂性分析工具中普遍代表了两种这样的措施。
McCabe的拟环复杂性 (McCabe’s Cyclometic Complexity)
First, the McCabe’s Cyclometic Complexity (CYC) relies on graph theory. Developed by Thomas McCabe in 1976, the metric is calculated from a function’s control flow graph, which consists of nodes and edges.
首先, McCabe的算术复杂度 (CYC)依赖于图论。 度量标准是由Thomas McCabe在1976年开发的,它是根据函数的控制流程图来计算的,该流程图由节点和边组成。

Based on such a graph, we can calculate the CYC using the following formula:
基于这样的图,我们可以使用以下公式计算CYC:
CYC = E – N + 2PIn this formula, P is the number of predicate nodes (i.e. nodes that contain an if/else condition), E is the number of edges, and N is the number of nodes. CYC effectively is a measure of the number of independent paths through your module, giving some indication of how difficult the code is to understand, and how many unit tests would be required to achieve full test coverage (i.e. its “testability”).
在此公式中, P是谓词节点(即包含if / else条件的节点)的数量, E是边的数量, N是节点的数量。 CYC有效地衡量了通过模块的独立路径的数量,从而表明了代码难以理解的程度,以及实现完整测试范围(即其“可测试性”)需要进行多少单元测试。
The higher the value of the CYC, the more complex your code. The Software Engineering Institute at Carnegie Mellon defines the following ranges (see this publication, p. 147):
CYC的值越高,代码越复杂。 卡内基梅隆大学软件工程学院定义了以下范围(请参阅此出版物 ,第147页):
1–10: low risk, simple program;
1-10 :低风险,简单的程序;
11–20: moderate risk, more difficult program;
11–20 :中等风险,较困难的计划;
21–50: high risk, very difficult program;
21-50 :高风险,非常困难的程序;
> 50: very high risk, untestable program.
> 50 :非常高的风险,不可测试的程序。
可维护性指数 (The Maintainability Index)
Second, the maintainability index (MI) is a combination of the McCabe metric (C), the Halstead Volume (V), and Lines of Code (LoC). In formula¹:
二, 可维护性指数(MI) 是McCabe指标(C), Halstead体积 (V)和代码行(LoC)的组合。 在公式¹中:
MI = 171 - 5.2*ln(V) - 0.23*(C) - 16.2*ln(LoC)The MI is bound between 0 and 100 in theory but not in practice (most software implementations cap it at 100). The original paper introducing the metric noted the following thresholds: if your code’s MI is below 65 is is hard to maintain; if it’s 85 or higher, your code is easy to maintain. Anything between 65 and 85 is moderately maintainable (Coleman, Lowther, and Oman, 1994). The rescaled version (to between 0 and 100) used by Visual Studio² puts the thresholds at 0 to 9 for low maintainability, 10–19 for moderate, and 20 and above for high maintainability respectively. (Please note that different IDEs and libraries may use different thresholds.)
理论上,MI在0到100之间,而在实践中则不受限制(大多数软件实现将其限制为100)。 引入该指标的原始论文指出了以下阈值:如果代码的MI低于65,则很难维护; 如果它是85或更高,则代码易于维护。 65至85之间的任何值都可以适当维护( Coleman,Lowther和Oman,1994年 )。 Visual Studio²使用的重新缩放版本(在0到100之间)将阈值分别设置为0到9(对于低可维护性),10–19(对于中度)和20(或更高)对高可维护性。 (请注意,不同的IDE和库可能使用不同的阈值。)
关于CYC和MI的警告说明 (A cautionary note on the CYC and MI)
The CYC and MI should not be used in isolation to establish whether your code is overly complex or hard to maintain, for a number of reasons.
出于多种原因,不应孤立地使用CYC和MI来确定代码是否过于复杂或难以维护。
First, these metrics do not account for other indicators of unnecessary complexity such as code duplication, nesting depth, or readability to a human. Second, the MI in particular suffers from bunch of problems that make it inconsistent. It was calibrated several decades ago and makes some rather dubious assumptions on how increases and decreases in some of the variables it uses contribute to overall complexity. (For a more detailed assessment of the shortcomings of the MI, check out this excellent blog post by Arie van Deursen, professor at the Delft University of Technology.)
首先,这些指标没有考虑其他不必要的复杂度指标,例如代码重复,嵌套深度或人类可读性。 其次,尤其是MI遭受了许多使其不一致的问题。 它是在几十年前进行校准的,并对它使用的某些变量的增加和减少如何导致整体复杂性做出了一些相当可疑的假设。 (有关MI缺点的更详细评估,请查看代尔夫特理工大学教授Arie van Deursen撰写的精彩博客文章 。)
Finally, we should expect the MI’s values to differ depending on what framework you are analysing. A simple measure, like Lines of Code (LOC) may therefore be preferred.
最后,我们应该期望MI的值根据您所分析的框架而有所不同。 因此,可能更喜欢像代码行(LOC)这样的简单措施。
These limitations do give us some idea of when and how to use the CYC and MI. First, the MI cannot reliably be used to compare the complexity of two different systems, even if they are built using the same frameworks. Second, we cannot use hard cutoffs for when a piece of code is simple and maintainable enough because these metrics cannot be divorced from human evaluation and expert knowledge of a code base.
这些限制确实使我们对何时以及如何使用CYC和MI有了一些了解。 首先,即使无法使用相同的框架构建MI,也无法可靠地将其用于比较两个不同系统的复杂性。 其次,当一段代码简单且可维护时,我们不能使用硬性临界值,因为这些指标不能脱离人工评估和代码基础的专家知识。
Instead, the CYC and MI may be useful — in combination with other simpler metrics — if we treat them as heuristics that help us identify potential problems with our code. This can be particularly useful if we evaluate our code regularly, and observe how the metrics evolve over time. Sudden and large changes should catch our attention and prompt us to investigate further. Needless to say: as with most code quality tools, the CYC and MI should complement quality control in your development workflow, not replace it.
相反,如果我们将CYC和MI与其他较简单的指标结合使用,可以将它们视为启发式方法,帮助我们识别代码中的潜在问题,则可能会有用。 如果我们定期评估我们的代码,并观察指标随着时间的变化,这将特别有用。 突然的大变化应该引起我们的注意,并促使我们进行进一步的调查。 不用说:与大多数代码质量工具一样,CYC和MI应该在开发工作流程中补充质量控制,而不是替代它。
使用预先提交的挂钩将代码复杂性分析集成到您的工作流中 (Integrating code complexity analyses in your workflow with pre-commit hooks)
In the remainder of this post, I’ll show you how to integrate wily in your Python development workflow to perform complexity analyses for you at every new code commit. Wily is a command-line tool that allows you to analyse, track, and visualise the complexity and maintainability of your Python code. While the mccabe and radon libraries offer similar functionalities, wily has some nice features that allow us to trace complexity over time with relative ease. Check out the video below for an introduction to wily by its author, Anthony Shaw.
在本文的其余部分,我将向您展示如何在Python开发工作流程中进行明智的集成,以在每次提交新代码时为您执行复杂性分析。 Wily是一个命令行工具,可让您分析,跟踪和可视化Python代码的复杂性和可维护性。 尽管mccabe和radon库提供了相似的功能,但wily具有一些不错的功能,这些功能使我们可以相对轻松地随时间推移跟踪复杂性。 观看下面的视频,了解其作者Anthony Shaw的狡猾介绍。
Detecting code complexity is only as useful as the frequency with which you perform the analysis. If you regularly check your code complexity, you can easily spot sudden increases. Such outliers are not necessarily problematic, but they should prompt you to investigate. The best way to ensure you get these insights frequently is to include wily in your project’s pre-commit hooks.
检测代码复杂度仅与执行分析的频率一样有用。 如果您定期检查代码的复杂性,则可以轻松发现突然的增加。 这样的异常值不一定有问题,但是它们应该提示您进行调查。 确保您经常获得这些见解的最佳方法是在项目的预提交挂钩中巧妙地包含进来。
Pre-commit hooks are small “scripts” that are run locally on staged files when using the git commit command. (If you’d like to learn more about pre-commit hooks, you may be interested in my post on using pre-commit hooks to automatically enforce code style.)
预提交挂钩是使用git commit命令在暂存文件上本地运行的小型“脚本”。 (如果您想了解有关预提交挂钩的更多信息,您可能会对我的文章中有关使用预提交挂钩自动执行代码样式的内容感兴趣。)
安装预提交库 (Installing the pre-commit library)
To get started with pre-commit hooks, first install the pre-commit library using terminal (instructions for Homebrew and Conda are available on this page):
要开始使用预提交挂钩,请首先使用终端安装预提交库( 本页上提供了Homebrew和Conda的说明):
pip install pre-commitYou can check whether your installation was successful using the command below. This command should return the version of your pre-commit installation.
您可以使用以下命令检查安装是否成功。 此命令应返回预提交安装的版本。
pre-commit --version创建和配置您的.yaml文件 (Creating and configuring your .yaml file)
After you’ve installed pre-commit, create a .yaml file. Your .yaml file specifies your pre-commit hooks configuration. Use the following command in terminal to create a new .yamlfile in your project directory:
安装pre-commit ,请创建一个.yaml文件。 您的.yaml文件指定您的预提交挂钩配置。 在终端中使用以下命令在您的项目目录中创建一个新的.yaml文件:
nano .pre-commit-config.yamlSubsequently, add the following configuration:
随后,添加以下配置:
repos:
-   repo: local
    hooks:
    -   id: wily
        name: wily
        entry: wily diff
        verbose: true
        language: python
        additional_dependencies: [wily]
使用预提交 (Using pre-commit)
Now that you have installed the pre-commit package and set up your .yamlfile, you’re all set to use pre-commit with wily to analyse code complexity. To get started, first run the following command in terminal to install the pre-commit hooks:
既然您已经安装了pre-commit软件包并设置了.yaml文件,那么您就可以.yaml地使用pre-commit来分析代码的复杂性了。 首先,请在终端中运行以下命令以安装预提交的钩子:
pre-commit installAfter you’ve installed the pre-commit hooks, the pre-commit command will be executed every time you commit a change to git. Optionally, you can run the pre-commit hooks directly from terminal by using the following command:
安装预提交的钩子后,每次提交对git的更改时,都会执行pre-commit命令。 (可选)您可以使用以下命令直接从终端运行预提交挂钩:
pre-commit run明智地入门 (Getting started with wily)
Before you can use wily with pre-commit, you’ll have to go run wily build from terminal. The build command compiles a cache of the complexity changes of your code in your last 50 commits. You need this cache so that wily can compute metrics across your commits. Alternatively, you can use wily setup and follow the instructions in terminal.
必须先从终端运行wily build ,然后才能将wily与pre-commit一起使用。 build命令编译最近50次提交中代码复杂性更改的缓存。 您需要此缓存,以便可以明智地跨提交计算指标。 或者,您可以使用wily setup并按照终端中的说明进行操作。
After you’ve set up and configured pre-commit and created your wily cache, the wily diff command will be run automatically upon every new commit. Upon a new commit, your terminal output will show the complexity of the version of the code in your current commit compared to the previous revision. The output below shows an example of wily’s diff report after removing some lines of code. We obtain four scores, including Lines of Code (LOC), Unique Operands, and the Cyclomatic Complexity and Maintainability Index. If your complexity increases dramatically after a relatively small change, you should probably pause and reconsider the changes you’ve just made.
设置并配置了预提交并创建了wily缓存后, wily diff命令将在每次新提交时自动运行。 进行新的提交后,您的终端输出将显示当前提交中的代码版本与先前版本相比的复杂性。 下面的输出显示了删除几行代码后wily差异报告的示例。 我们获得四个分数,包括代码行(LOC),唯一操作数和圈复杂度和可维护性指数。 如果经过相对较小的更改后复杂度急剧增加,则可能应该暂停并重新考虑刚刚进行的更改。

Getting an overview of how your code changed between two commits is useful, but does not give us that much data to work with. To identify and prioritise potential problem areas, we have to consider how a specific module changed over time. To get this information, run the following commands in terminal:
大致了解两次提交之间的代码更改方式很有用,但并不能为我们提供足够的数据。 为了确定潜在问题领域并确定其优先级,我们必须考虑特定模块随时间的变化。 要获取此信息,请在终端中运行以下命令:
wily build
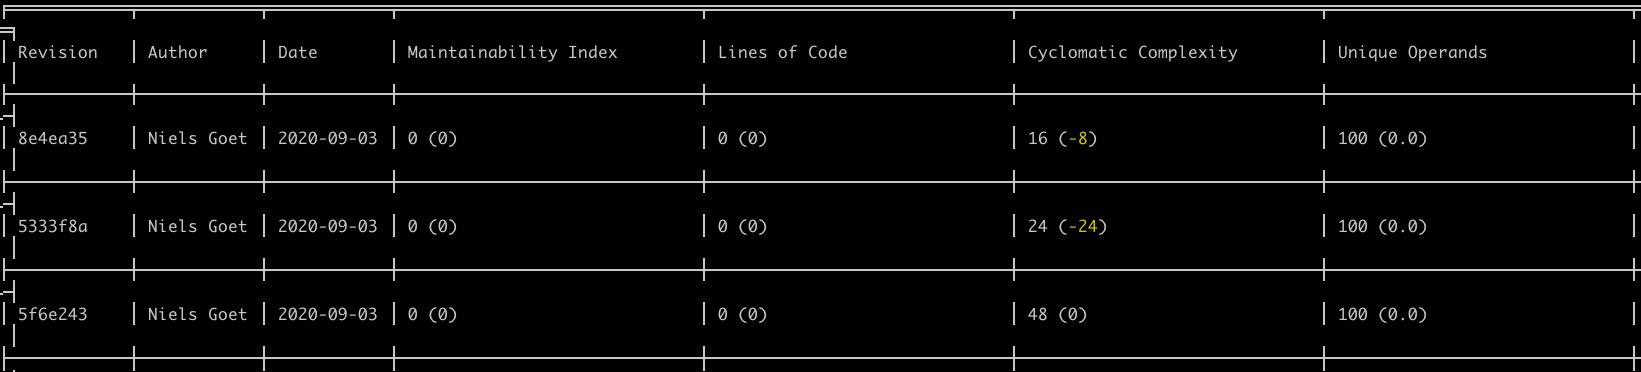
wily report <my-module-name>As shown in the example below, the report command will produce a CLI table of the changes in complexity metrics between all commits for the specified module. This report allows you to easily spot changes, as well as patterns and trends in complexity, and where you might have gone wrong.
如下例所示, report命令将为指定模块的所有提交之间的复杂性指标变化生成一个CLI表。 通过此报告,您可以轻松发现更改,复杂性的模式和趋势以及可能出了问题的地方。
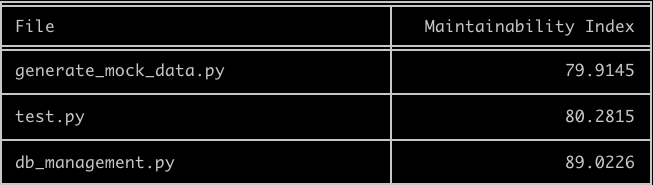
Another useful command to identify (potentially) problematic modules within a larger project is wily rank, which will show the maintainability index of your different modules. In this case all values are above 75, meaning they’re easy to maintain. (Do note the caveats with using the maintainability index that I’ve outlined earlier in this post).
另一个用于识别(在潜在的情况下)较大项目中的模块的有用命令是wily rank ,它将显示您不同模块的可维护性指标。 在这种情况下,所有值均大于75,这意味着它们易于维护。 (请注意使用本文前面概述的可维护性索引的注意事项)。
Finally, it’s easiest to spot trends when plotting the complexity of a piece of code across different commits. You can visualise a module’s complexity report using the graph command, e.g.:
最后,绘制跨不同提交的一段代码的复杂性时,发现趋势最容易。 您可以使用graph命令可视化模块的复杂性报告,例如:
wily graph create_tables.py loc sloc complexityThis command will produce a plot of the create_tables.py module (see below), showing the lines of code on the y-axis, the commits on the x-axis, and the complexity represented by the size of the bubbles on each observation.
此命令将生成create_tables.py模块的图(请参见下文),在y轴上显示代码行,在x轴上显示提交,并通过每次观察中气泡大小表示的复杂性。
Combined, wily’s diff, report, rank, and graph commands can give you useful information on whether your code is becoming unnecessarily complex.
wily的diff , report , rank和graph命令组合在一起可以为您提供有用的信息,以帮助您了解代码是否变得不必要地复杂。
超越智慧:简化您的Python代码 (Beyond wily: Simplifying your Python code)
Writing simple, clear, and legible code is challenging. While code style and (unit) testing can to a large degree be automated, the design of your code itself is still a human task. That is, if the latest advancements in machine programming do not make developers obsolete. Automating complexity analysis can help you make informed decisions about when to reconsider your code, and what areas of your code base to prioritise. These analyses can never replace a proper code design process, but it can go a long way to avoiding unnecessary mistakes and catching potential problems during the development process.
编写简单,清晰且易读的代码具有挑战性。 尽管代码样式和(单元)测试可以在很大程度上实现自动化,但是代码本身的设计仍然是一项人工任务。 也就是说,如果机器编程的最新进展不会使开发人员过时 。 自动化复杂性分析可以帮助您做出明智的决定,以决定何时重新考虑代码以及优先考虑代码的哪些区域。 这些分析永远不能替代适当的代码设计过程,但是可以避免开发过程中不必要的错误并发现潜在的问题。
Thanks for reading!
谢谢阅读!
¹ Original version of the MI. Note that different versions of the MI exist. See, e.g. Radon’s documentation on this metric.
¹MI的原始版本。 请注意,存在不同版本的MI。 参见,例如Radon的有关此度量的文档 。
² Visual Studio’s rescaled MI can be calculated using the following formula: MAX(0,(171–5.2*ln(V) — 0.23 * (C) — 16.2*ln(LoC))*100 / 171). See this article for further details.
²可以使用以下公式计算Visual Studio的重新缩放的MI: MAX(0,(171–5.2*ln(V) — 0.23 * (C) — 16.2*ln(LoC))*100 / 171) 。 有关更多详细信息,请参见本文 。
python 代码简化


 2944
2944


 被折叠的 条评论
为什么被折叠?
被折叠的 条评论
为什么被折叠?
 到【灌水乐园】发言


