


If you have ever dealt with Time-Series data analysis, you would have come across these problems for sure —
如果您曾经处理过时间序列数据分析,那么您肯定会遇到这些问题-
- Combining data into certain intervals like based on each day, a week, or a month. 将数据组合成一定的时间间隔,例如基于每天,一周或一个月。
- Aggregating data in the time interval like if you are dealing with price data then problems like total amount added in an hour, or a day. 像在处理价格数据那样在时间间隔内聚合数据,则会出现诸如在一小时或一天之内添加的总量之类的问题。
- Finding patterns for other features in the dataset based on a time interval. 根据时间间隔在数据集中查找其他特征的模式。
In this article, you will learn about how you can solve these problems with just one-line of code using only 2 different Pandas API’s i.e. resample() and Grouper().
在本文中,您将学习如何仅使用两行Pandas API(即resample()和Grouper())仅用一行代码即可解决这些问题。
As we know, the best way to learn something is to start applying it. So, I am going to use a sample time-series dataset provided by World Bank Open data and is related to the crowd-sourced price data collected from 15 countries. For more details about the data, refer Crowdsourced Price Data Collection Pilot. For this exercise, we are going to use data collected for Argentina.
众所周知,学习某件事的最好方法是开始应用它。 因此,我将使用世界银行公开数据提供的样本时间序列数据集,该数据集与从15个国家/地区收集的众包价格数据相关。 有关数据的更多详细信息,请参阅众包价格数据收集试点 。 在本练习中,我们将使用为阿根廷收集的数据。
📚 Resources: Google Colab Implementation | Github Repository | Dataset 📚
📚资源: Google Colab实施 | Github资料库 | 数据集 📚
数据集详细信息 (Dataset Details)
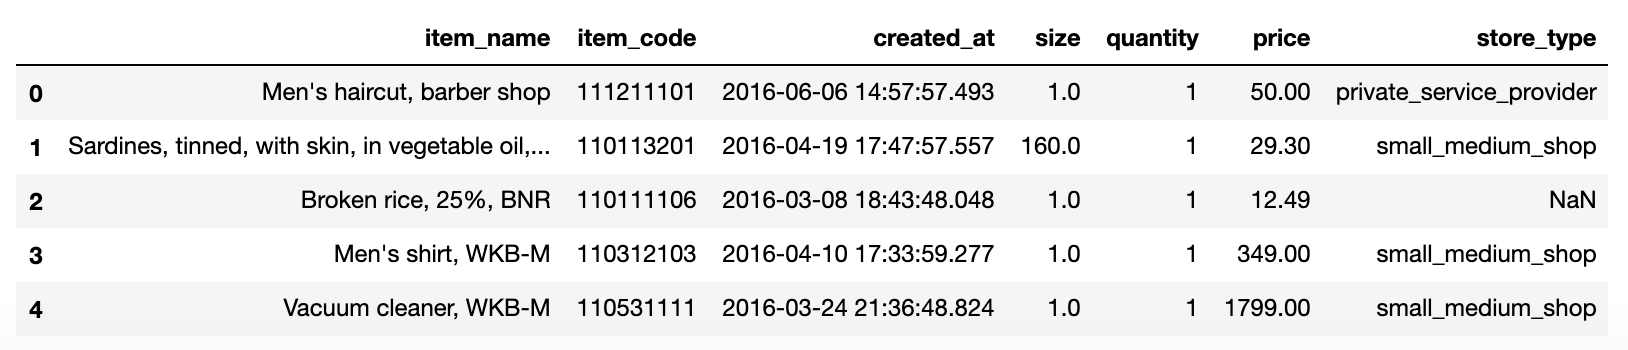
This data is collected by different contributors who participated in the survey conducted by the World Bank in the year 2015. The basic idea of the survey was to collect prices for different goods and services in different countries. We are going to use only a few columns from the dataset for the demo purposes —
该数据由参与世界银行2015年调查的不同贡献者收集。该调查的基本思想是收集不同国家/地区不同商品和服务的价格。 我们仅将数据集中的几列用于演示目的-
根据不同的时间间隔合并数据。 (Combining data based on different Time Intervals.)
Pandas provides an API named as resample() which can be used to resample the data into different intervals. Let’s see a few examples of how we can use this —
Pandas提供了一个名为resample()的API,可用于将数据重新采样为不同的间隔。 让我们来看一些如何使用它的示例-
每小时添加的总金额。 (Total Amount added each hour.)
Let’s say we need to find how much amount was added by a contributor in an hour, we can simply do so using —
假设我们需要找出一个小时内贡献者增加了多少,我们可以简单地使用-
# data re-sampled based on an hour
data.resample('H', on='created_at').price.sum()# output
created_at
2015-12-14 18:00:00     5449.90
2015-12-14 19:00:00       15.98
2015-12-14 20:00:00       66.98
2015-12-14 21:00:00        0.00
2015-12-14 22:00:00        0.00
Here is what we are doing here —
这就是我们在这里所做的-
First, we resampled the data into an hour ‘H’ frequency for our date column i.e. created_at. We can use different frequencies, I will go through a few of them in this article. Check out Pandas Time Frequencies for a complete list of frequencies. You can even go up to nanoseconds.
首先,对于日期列(即created_at),我们将数据重新采样为一个小时的“ H”频率。 我们可以使用不同的频率,本文将介绍其中的一些。 查看熊猫时间频率 ,以获取完整的频率列表。 您甚至可以达到纳秒级。
- After this, we selected the ‘price’ from the resampled data. Later we will see how we can aggregate on multiple fields i.e. total amount, quantity, and the unique number of items in a single command. 之后,我们从重采样数据中选择了“价格”。 稍后,我们将看到如何在单个命令中汇总多个字段,即总量,数量和唯一项数。
- Computed the sum for all the prices. This will give us the total amount added in that hour. 计算所有价格的总和。 这将为我们提供该小时内增加的总金额。
By default, the time interval starts from the starting of the hour i.e. the 0th minute like 18:00, 19:00, and so on. We can change that to start from different minutes of the hour using offset attribute like —
默认情况下,时间间隔从小时的开头开始,即从0分钟开始,例如18:00、19:00,依此类推。 我们可以使用offset属性将其更改为从每小时的不同分钟开始,例如-
# Starting at 15 minutes 10 seconds for each hour
data.resample('H', on='created_at', offset='15Min10s').price.sum()# Output
created_at
2015-12-14 17:15:10     5370.00
2015-12-14 18:15:10       79.90
2015-12-14 19:15:10       64.56
2015-12-14 20:15:10       18.40
2015-12-14 21:15:10        0.00
Please note, you need to have Pandas version > 1.10 for the above command to work.
请注意,您需要使Pandas版本> 1.10才能使上述命令起作用。
每周添加的总金额。 (Total Amount added each week.)
In this example, we will see how we can resample the data based on each week.
在此示例中,我们将看到如何基于每周对数据进行重新采样。
# data re-sampled based on an each week, just change the frequency
data.resample('W', on='created_at').price.sum()# output
created_at
2015-12-20    4.305638e+04
2015-12-27    6.733851e+04
2016-01-03    4.443459e+04
2016-01-10    1.822236e+04
2016-01-17    1.908385e+05
By default, the week starts from Sunday, we can change that to start from different days i.e. let’s say if we would like to combine based on the week starting on Monday, we can do so using —
默认情况下,星期从星期日开始,我们可以将其更改为从不同的日期开始,也就是说,如果我们要基于星期一开始的星期进行合并,可以使用-
# data re-sampled based on an each week, week starting Monday
data.resample('W-MON', on='created_at').price.sum()# output
created_at
2015-12-14    5.532860e+03
2015-12-21    3.850762e+04
2015-12-28    6.686329e+04
2016-01-04    5.392410e+04
2016-01-11    1.260869e+04
每月添加的总金额。 (Total Amount added each month.)
This is similar to what we have done in the examples before.
这类似于我们在前面的示例中所做的。
# data re-sampled based on each month
data.resample('M', on='created_at').price.sum()# Output
created_at
2015-12-31    1.538769e+05
2016-01-31    4.297143e+05
2016-02-29    9.352684e+05
2016-03-31    7.425185e+06
2016-04-30    1.384351e+07
One observation to note here is that the output labels for each month are based on the last day of the month, we can use the ‘MS’ frequency to start it from 1st day of the month i.e. instead of 2015–12–31 it would be 2015–12–01 —
这里要注意的一个观察是,每个月的输出标签基于该月的最后一天,我们可以使用“ MS”频率从该月的第一天开始,即代替2015–12–31在2015–12–01 —
# month frequency from start of the month
data.resample('MS', on='created_at').price.sum()created_at
2015-12-01    1.538769e+05
2016-01-01    4.297143e+05
2016-02-01    9.352684e+05
2016-03-01    7.425185e+06
2016-04-01    1.384351e+07
采样数据的多重聚合。 (Multiple Aggregation on sampled data.)
Often we need to apply different aggregations on different columns like in our example we might need to find —
通常,我们需要在不同的列上应用不同的聚合,例如在我们的示例中,我们可能需要找到-
- Unique items that were added in each hour. 每小时添加的唯一项。
- The total quantity that was added in each hour. 每小时添加的总数量。
- The total amount that was added in each hour. 每小时添加的总量。
We can do so in a one-line by using agg() on the resampled data. Let’s see how we can do it —
我们可以通过在重新采样的数据上使用agg()来单行执行此操作。 让我们看看我们如何做到-
# aggregating multiple fields for each hour
data.resample('H', on='created_at').agg({'price':'sum', 'quantity':'sum','item_code':'nunique'})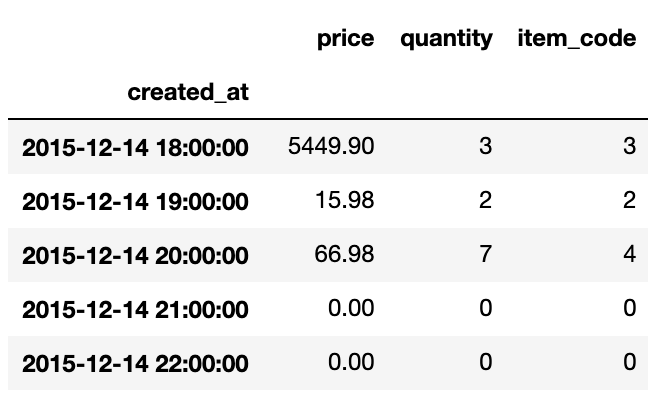
根据不同的时间间隔对数据进行分组 (Grouping data based on different Time intervals)
In the above examples, we re-sampled the data and applied aggregations on it. What if we would like to group data by other fields in addition to time-interval? Pandas provide an API known as grouper() which can help us to do that.
在以上示例中,我们重新采样了数据并对其应用了聚合。 如果我们除了时间间隔之外还想按其他字段对数据分组怎么办? 熊猫提供了一个称为grouper()的API,可以帮助我们做到这一点。
In this section, we will see how we can group data on different fields and analyze them for different intervals.
在本节中,我们将看到如何将不同字段上的数据分组并分析不同间隔的数据。
每个月为每种商店类型添加的金额。 (Amount added for each store type in each month.)
Let’s say we need to analyze data based on store type for each month, we can do so using —
假设我们需要每月根据商店类型分析数据,我们可以使用-
# Grouping data based on month and store type
data.groupby([pd.Grouper(key='created_at', freq='M'), 'store_type']).price.sum().head(15)# Output
created_at  store_type
2015-12-31  other                          34300.00
            public_semi_public_service       833.90
            small_medium_shop               2484.23
            specialized_shop              107086.00
2016-01-31  market                           473.75
            other                         314741.00
            private_service_provider         325.00
            public_semi_public_service       276.79
            small_medium_shop              31042.79
            specialized_shop               29648.44
2016-02-29  market                          1974.04
            other                         527950.00
            private_service_provider        1620.00
            public_semi_public_service      1028.52
            small_medium_shop             224653.83
Let’s understand how I did it —
让我们了解一下我是如何做到的–
- First, we passed the Grouper object as part of the groupby statement which groups the data based on month i.e. ‘M’ frequency. This is similar to resample(), so whatever we discussed above applies here as well. 首先,我们将Grouper对象作为groupby语句的一部分传递,该语句根据月(即“ M”频率)对数据进行分组。 这类似于resample(),因此我们上面讨论的任何内容也都适用于此。
- We added store_type to the groupby so that for each month we can see different store types. 我们将store_type添加到了groupby,以便每个月我们都能看到不同的商店类型。
- For each group, we selected the price, calculated the sum, and selected the top 15 rows. 对于每个组,我们选择价格,计算总和,然后选择前15行。
每月基于item_name添加的总金额。 (Total Amount added based on item_name in each month.)
As we did in the last example, we can do a similar thing for item_name as well.
就像在上一个示例中所做的一样,我们也可以对item_name做类似的事情。
# Grouping data based on each month and item_name
data.groupby([pd.Grouper(key='created_at', freq='M'), 'item_name']).price.sum()# Output
created_at  item_name
2015-12-31  Bar soap, solid, SB                                33.17
            Beer, domestic brand, single bottle, WKB           29.79
            Black tea, BL                                      12.00
            Black tea, in bags, WKB                            60.99
            Bread, white, sliced, WKB                          85.45
                                                              ...
2016-08-31  Wheat flour, not self-rising, BL                  150.38
            White sugar, WKB                                  266.47
            Women's haircut, basic hairdresser               7730.00
            Wrist-watch, men's, CITIZEN Eco-Drive BM6060    52205.00
            Yoghurt, plain, WKB                               150.96
每个月中store_type的多次汇总。 (Multiple Aggregation for store_type in each month.)
We can apply aggregation on multiple fields similarly the way we did using resample(). The only thing which is different here is that the data would be grouped by store_type as well and also, we can do NamedAggregation (assign a name to each aggregation) on groupby object which doesn’t work for re-sample.
我们可以像使用resample()一样,将聚合应用于多个字段。 唯一不同的是,数据也将按store_type分组,而且我们可以对groupby对象执行NamedAggregation(为每个聚合分配一个名称),该对象不适用于重新采样。
# grouping data and named aggregation on item_code, quantity, and price
data.groupby([pd.Grouper(key='created_at', freq='M'), 'store_type']).agg(unique_items=('item_code', 'nunique'),
         total_quantity=('quantity','sum'),
         total_amount=('price','sum'))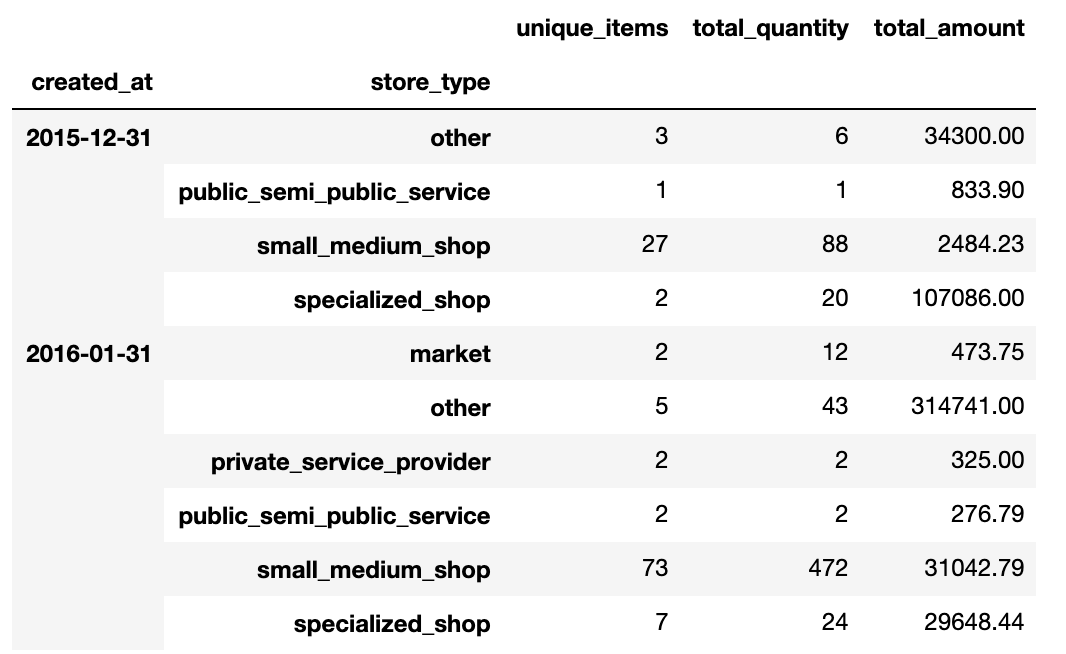
结论 (Conclusion)
I hope this article will help you to save time in analyzing time-series data. I recommend you to check out the documentation for the resample() and grouper() API to know about other things you can do with them.
我希望本文将帮助您节省分析时序数据的时间。 我建议您查看resample()和grouper() API的文档,以了解可以使用它们进行的其他操作。
If you would like to learn about other Pandas API’s which can help you with data analysis tasks then do checkout the article Pandas: Put Away Novice Data Analyst Status where I explained different things that you can do with Pandas.
如果您想了解其他可以帮助您完成数据分析任务的Pandas API,请查看Pandas:Pave Away Novice Data Analyst Status一文 ,在此我解释了您可以使用Pandas进行的其他操作。
Let me know in the comments or ping me on LinkedIn if you are facing any problems with using Pandas or Data Analysis in general. We can try to solve them together. That’s all for now, see you in the next article.
如果您在使用Pandas或Data Analysis时遇到任何问题,请在评论中让我知道,或者在LinkedIn上ping我。 我们可以尝试一起解决它们。 现在就这些,在下一篇文章中见。
Cheers!!! Stay Safe!!! Keep Learning!!!
干杯!!! 注意安全!!! 保持学习!!!


 587
587

 被折叠的 条评论
为什么被折叠?
被折叠的 条评论
为什么被折叠?
 到【灌水乐园】发言


