


python pdb调试
Python is both one of the most popular programming languages and one of the fastest growing ones. With the increasing popularity of Artificial Intelligence applications and data science, python’s popularity is growing every year.
Python既是最受欢迎的编程语言之一,也是增长最快的编程语言之一。 随着人工智能应用程序和数据科学的日益普及,python的普及每年都在增长。
Troubleshooting is one of the most important and time-consuming part of any programmer’s life. Where there is code, there are bugs. It’s impossible to have a bug-free code solution, this is where a debugger comes in handy.
故障排除是任何程序员一生中最重要,最耗时的部分之一。 有代码的地方就有错误。 没有错误的代码解决方案是不可能的,这是调试器派上用场的地方。
Python also comes with a built-in debugger called pdb.
Python还带有一个称为pdb的内置调试器。
What is Pdb?
什么是Pdb?
- An interactive debugging environment for Python programs. 用于Python程序的交互式调试环境。
- Let’s you pause your program, look at the values of variables, and watch program execution step-by-step. 让我们暂停程序,查看变量的值,并逐步观察程序的执行。
- Helps you understand what your program does and find bugs in the logic. 帮助您了解程序的功能并查找逻辑中的错误。
Different Operational Modes Of PDB:
PDB的不同操作模式:
PDB can be invoked in 4 different modes as stated below:
可以通过以下四种不同的方式调用PDB:
- Script Mode 脚本模式
- Run Mode运行模式
- Trace Mode追踪模式
- Post-Mortem Mode事后模式
PDB in Script mode:
脚本模式下的PDB:
Let’s begin with a small ‘MyCounter’ example mycounter.py
让我们从一个小的“ MyCounter”示例mycounter.py开始
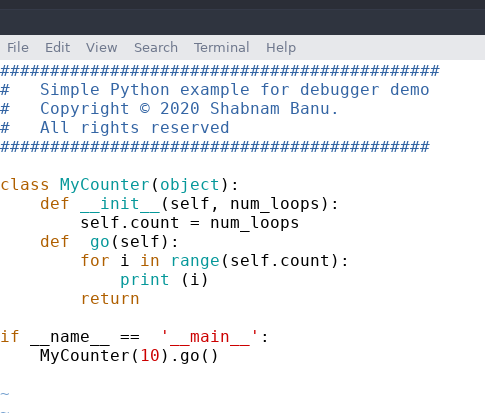
Above program shows a small example of a counter. The command used to invoke the debugger in script mode is: ‘Python -m pdb myconter.py’
上面的程序显示了一个计数器的小例子。 用于以脚本模式调用调试器的命令是:'Python -m pdb myconter.py'
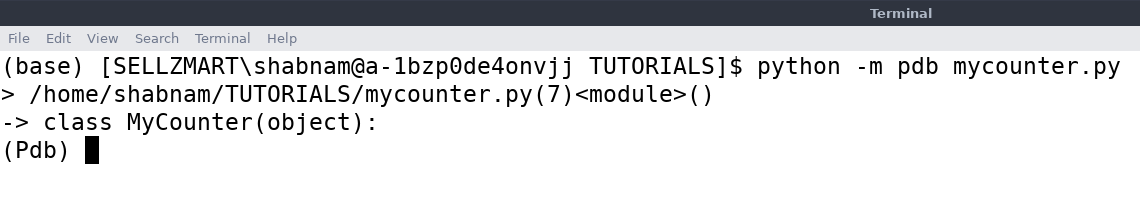
After invoking the debugger in script mode, it does the following:
在脚本模式下调用调试器后,它将执行以下操作:
> Loads the source file and stops execution on the first statement.
>加载源文件并停止在第一条语句上执行。
> In this case, it stops before evaluating the definition of the class MyCounter on line 7.
>在这种情况下,它将在评估第7行的类MyCounter的定义之前停止。
PDB in Enhanced script mode:
增强脚本模式下的PDB:
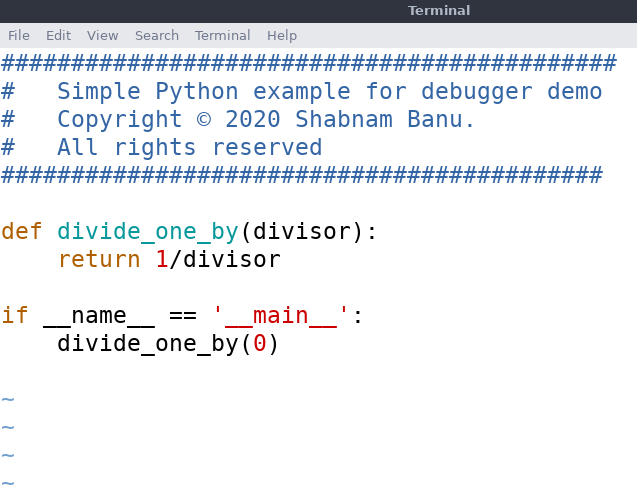
Let’s see another small example buggy.py to begin with:
让我们看另一个小示例buggy.py开头:
Pdb in script mode comes with some additional advanced options to make debugging easier. Some useful ones amongst them are listed below:
脚本模式下的Pdb带有一些其他高级选项,使调试更加容易。 下面列出了其中一些有用的:
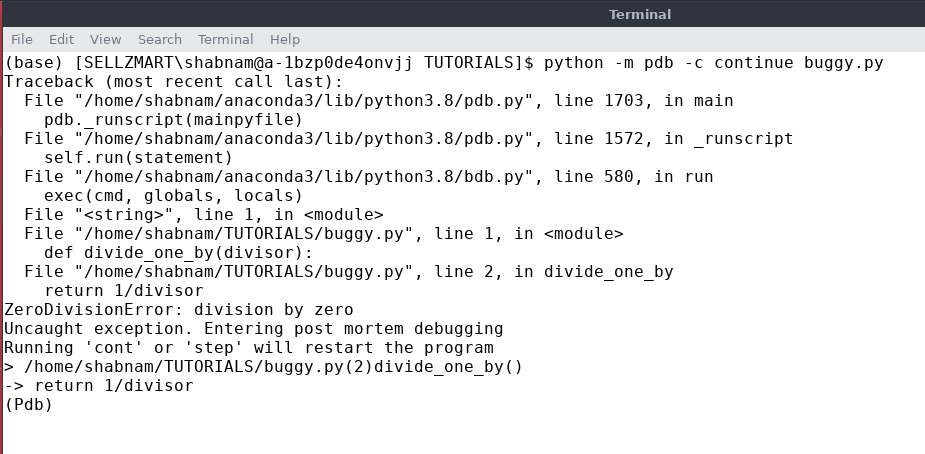
Option “-c continue” :
选项“ -c继续”:
- Invoked as “python -m pdb -c continue buggy.py”. 称为“ python -m pdb -c Continue buggy.py”。
- Let’s the script run until an exception occurs, then presents prompt. 让脚本运行直到发生异常,然后显示提示。
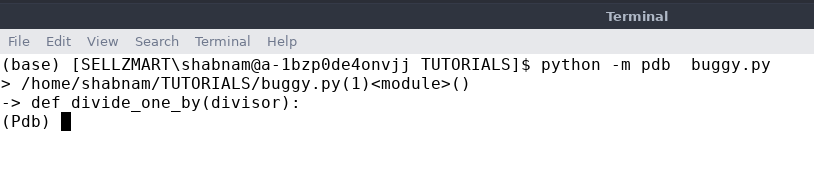
Same script run without “-c continue” option would yield the following
没有“ -c继续”选项的相同脚本运行将产生以下结果
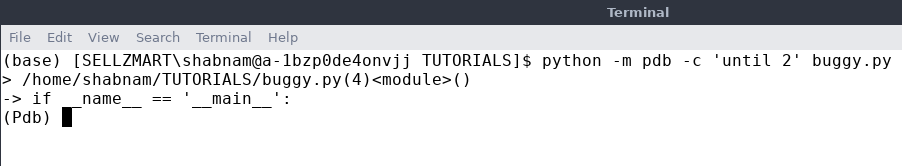
Option “-c until n” :
选项“ -c直到n”:
- Invoked as “python -m pdb -c ‘until 2’ buggy.py”. 称为“ python -m pdb -c'直到2'buggy.py”。
- Let’s the script run until it reaches line 2, then presents prompt. 让脚本运行直到到达第2行,然后显示提示。
PDB in Run mode:
运行模式下的PDB:
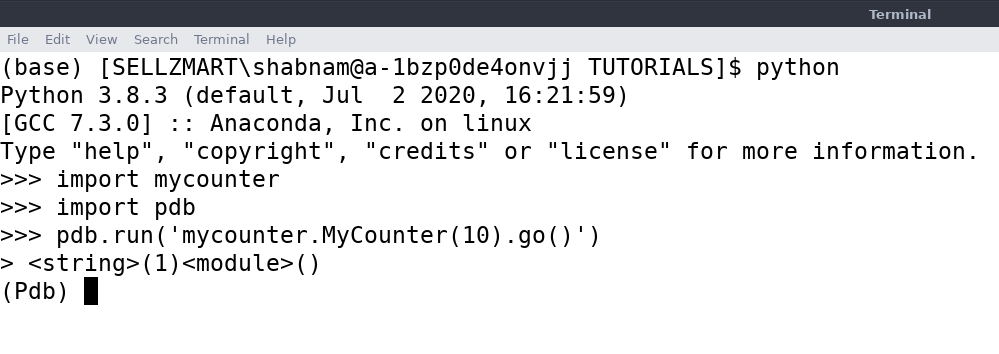
To run the pdb in ‘Run Mode’, following steps are required
要以“运行模式”运行pdb,需要执行以下步骤
- Run the debugger from within an interactive interpreter从交互式解释器中运行调试器
- Use run()or runeval()使用run()或runeval()
- The argument to run() is a string expression that can be evaluated by the Python interpreter run()的参数是一个字符串表达式,可以由Python解释器评估
- Debugger will parse it, then pause execution just before the first expression evaluates.调试器将解析它,然后在第一个表达式求值之前暂停执行。
PDB in Trace mode:
跟踪模式下的PDB:
The third mode in which a pdb debugger can run is “Trace mode”. All previous examples assumed, you want to start the debugger at the beginning of your program. But that is not the case always. For a long-running process where the problem appears much later in the program execution, it’s more convenient to start the debugger from inside your program using the function set_trace().
pdb调试器可以运行的第三种模式是“跟踪模式”。 假定所有先前的示例,您都想在程序的开头启动调试器。 但这并非总是如此。 对于长时间运行的过程,该问题在程序执行的后期出现,使用函数set_trace()从程序内部启动调试器更为方便。
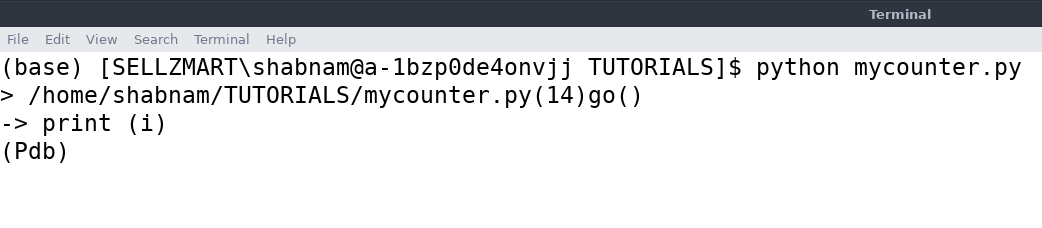
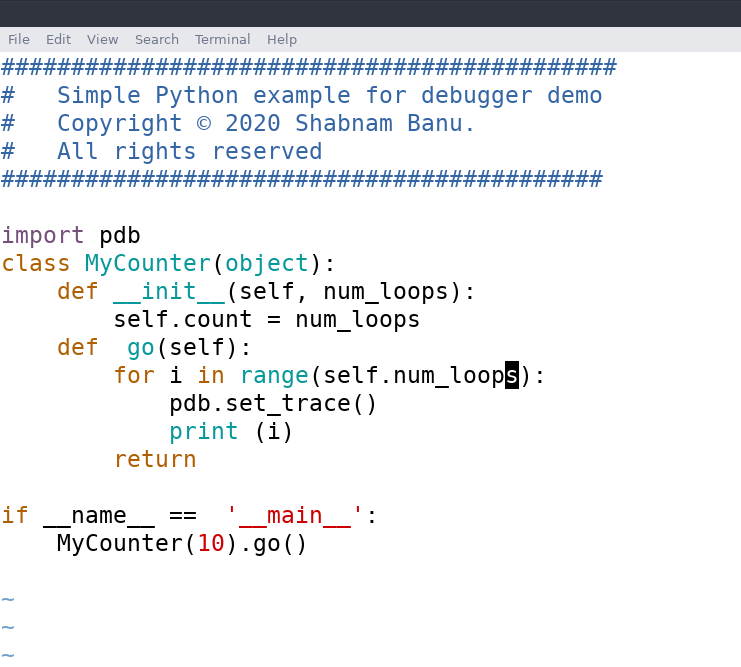
A short example showing the usage of set_trace() is given below :
下面是显示set_trace()用法的简短示例:
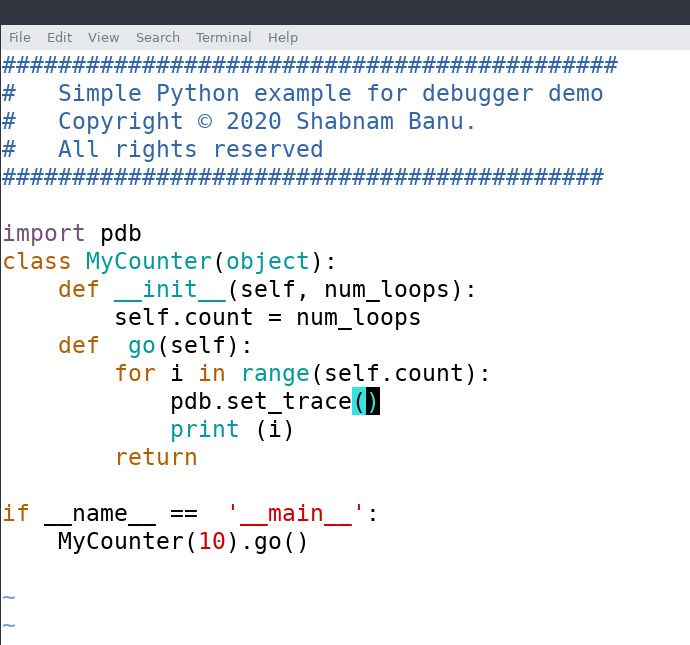
After execution, the execution stops at the line where pdb.set_trace() was added.
执行后,执行在添加pdb.set_trace()的行处停止。
Some Key points about “Trace Mode” are:
有关“跟踪模式”的一些关键点是:
- set_trace() is just a Python function. Can be called from any point in your program. set_trace()只是一个Python函数。 可以从程序的任何位置调用。
- Let’s you enter the debugger based on conditions inside your program, including from an exception handler or via a specific branch of a control statement. 让我们根据程序内部的条件进入调试器,包括从异常处理程序或通过控制语句的特定分支。
PDB in Post-Mortem mode:
事后模式下的PDB:
The last mode in the row is ‘Post-Mortem mode’. As the name suggests, ‘PDB post-mortem mode’ involves debugging the program after the program has terminated/failed.
该行中的最后一个模式是“后期模式”。 顾名思义,“ PDB验尸模式”涉及在程序终止/失败后调试程序。
Invoking the debugger in post-mortem mode :
在验尸模式下调用调试器:
• Python supports post-mortem debugging through the pm() and post_mortem() functions.
•Python支持通过pm()和post_mortem()函数进行事后调试。
• pm() looks for the active traceback and starts the debugger at the point in the call stack where the exception occurred.
•pm()查找活动的追溯,并在调用堆栈中发生异常的位置启动调试器。
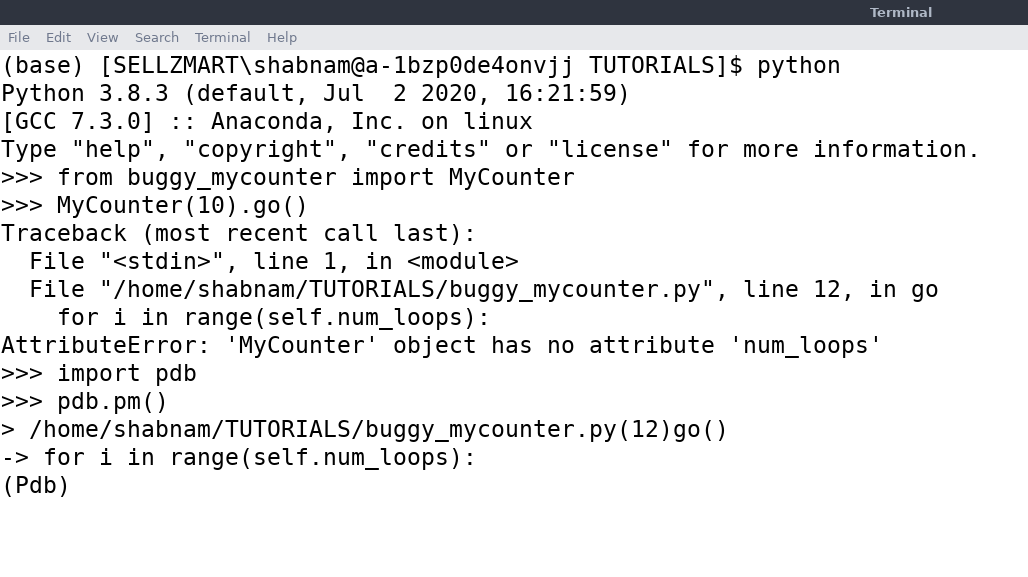
Let’s have a deeper look into it using an example buggy_mycounter.py
让我们使用示例buggy_mycounter.py对其进行更深入的研究
In the above example, there is a bug ‘undefined attribute self.num_loops’
在上面的示例中,存在一个错误“未定义的属性self.num_loops”
Following snapshot shows usage of pdb.pm() for debugging the above buggy example. Steps followed are:
以下快照显示了使用pdb.pm()调试上面的错误示例。 遵循的步骤是:
- Run the python interpreter 运行python解释器
- Run the program MyCounter(10).go()运行程序MyCounter(10).go()
- Import pdb 导入pdb
- Run pdb.pm() to start debugging from the stack trace where the exception occurred. 运行pdb.pm()从发生异常的堆栈跟踪开始调试。
This was a brief introduction to python debugger and its operational modes.
这是python调试器及其操作模式的简要介绍。
Some Final Words:
最后几句话:
Python is one of the most used language in the world and learning a language is incomplete without having a good knowledge about its debugger. This was a brief introduction to python debugger and its different operational modes.I sincerely hope that you find it helpful.
Python是世界上使用最广泛的语言之一,如果不了解其调试器,则学习该语言是不完整的。 这是python调试器及其不同操作模式的简要介绍,我衷心希望您对它有所帮助。
In my next article PDB:Controlling the python debugger, I will dive deeper into the different commands used inside a python debugger and intuitive way of remembering them.
在我的下一篇文章PDB:控制python调试器中,我将深入研究python调试器中使用的不同命令以及记住它们的直观方法。
Please let me know your thoughts, comments and suggestions in the comment section below.
请在下面的评论部分中让我知道您的想法,评论和建议。
Cheers,
干杯,
Shabnam
沙布南
翻译自: https://medium.com/python-in-plain-english/pdb-a-brief-introduction-to-python-debugger-abeaa2da5010
python pdb调试


 1518
1518

 被折叠的 条评论
为什么被折叠?
被折叠的 条评论
为什么被折叠?
 到【灌水乐园】发言


