


 本文介绍了Chrome开发者工具中一些鲜为人知却极为实用的功能,包括使用console.table()以表格形式展示数组数据、多光标编辑、命令面板快速访问工具、CSS属性定位、条件断点调试等,帮助开发者提高工作效率。
If you’re a web developer, then you surely spend quite some time poking around in browsers dev tools or web console. Inspecting elements, modifying CSS or running commands in console — these are some basic things that every web developer knows how to do using browsers developer tools. There are however, quite a few more things you can do inside your browser to make your debugging, development and web design so much more efficient. Here are a few hidden or lesser known features of Chrome DevTools which you should know about and which you will be using every day…
如果您是Web开发人员,那么您一定会花很多时间在浏览器开发工具或Web控制台中四处逛逛。 检查元素,修改CSS或在控制台中运行命令-这些是每个Web开发人员都知道如何使用浏览器开发人员工具进行的一些基本操作。 但是,您还可以在浏览器中执行很多操作,以使调试,开发和Web设计更加高效。 以下是您应该了解的Chrome开发工具的一些隐藏的或鲜为人知的功能,以及每天将要使用的这些功能…
表格漂亮打印阵列 (Pretty-Print Array as Table)
When working with lots of data in JavaScript (e.g. creating data visualizations), things never work on first try and you will inevitably have to go to web console and view the data — probably with console.log. That will yield JavaScript Object (JSON), which in case of 2D arrays is going to be hard read and hard to find useful information in. But there's simple fix for that:
当使用JavaScript处理大量数据(例如,创建数据可视化)时,首先尝试就无法进行,您将不可避免地必须使用Web控制台并查看数据-可能使用console.log 。 这将产生JavaScript Object(JSON),在2D数组的情况下,将很难读取它并且很难在其中找到有用的信息。但是有一个简单的解决方法:
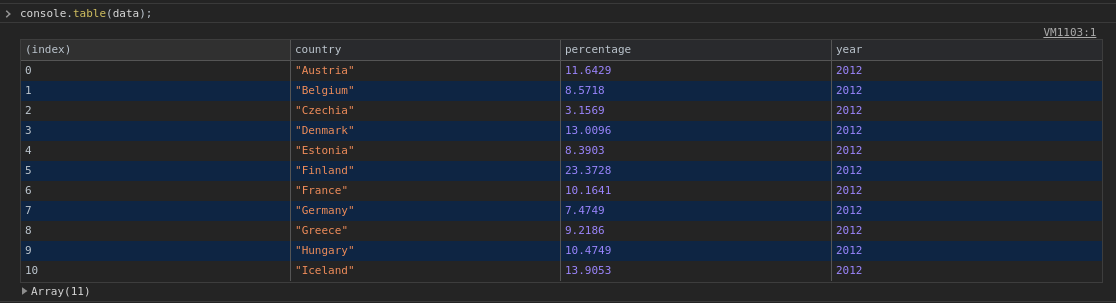
All it takes is to replace console.log with console.table. This function can easily display 1D and 2D arrays, but what makes this function extra useful is that it can also correctly displays column names and on top of that it also allows you to sort by each of these columns. So, to get table like the one above you would use data in following format:
console.log用console.table替换console.table 。 此函数可以轻松显示1D和2D数组,但是使此函数特别有用的是,它也可以正确显示列名,并且最重要的是,它还允许您按这些列中的每一个进行排序。 因此,要获得与上述表格类似的表格,您将使用以下格式的数据:
[
  { "country": "Austria", "percentage": 11.6429, "year": 2012},
  { "country": "Belgium", "percentage": 8.5718, "year": 2012},
  { "country": "Czechia", "percentage": 3.1569, "year": 2012},
  { "country": "Denmark", "percentage": 13.0096, "year": 2012},
  { "country": "Estonia", "percentage": 8.3903, "year": 2012},
  { "country": "Finland", "percentage": 23.3728, "year": 2012},
  { "country": "France", "percentage": 10.1641, "year": 2012},
  { "country": "Germany", "percentage": 7.4749, "year": 2012},
  { "country": "Greece", "percentage": 9.2186, "year": 2012},
  { "country": "Hungary", "percentage": 10.4749, "year": 2012},
  { "country": "Iceland", "percentage": 13.9053, "year": 2012}
]使用多光标(Using Multi Cursor)
One of the most basic features and shortcuts in every code editor is multi cursor and multi select. If you’re trying to be as efficient as possible like me, then you will surely put these shortcuts to good use:
每个代码编辑器中最基本的功能和快捷方式之一是多光标和多选择。 如果您想像我一样尽可能地高效,那么您一定会充分利用这些捷径:
Multi Cursor using CTRL + Click:
使用CTRL + Click多光标
Multi cursor is helpful, but not very accurate and little cumbersome when you need to select and replace a lot of occurrences of a text. For those cases you can use much more suitable CTRL + D shortcut:
当您需要选择和替换大量出现的文本时,多光标很有用,但不是很准确,也不麻烦。 对于这些情况,您可以使用更合适的CTRL + D快捷键:
In the GIF above you can see how one could use CTRL + D to select (and optionally CTRL + U to deselect) occurrences of text to easily modify them or replace them.
在上面的GIF中,您可以看到如何使用CTRL + D选择(以及可选地CTRL + U取消选择)出现的文本,以轻松地对其进行修改或替换。
使用命令面板 (Using Command Palette)
There’s a lot of tools, tabs, files, commands, etc. in Chrome DevTools and remembering name or place where to find each and everyone of them might not be feasible. To help with that, you can use Command Palette which can be opened using CTRL + Shift + P. In this palette you will find all the shortcuts, panels, console settings, tabs, settings and more.
Chrome DevTools中有很多工具,标签,文件,命令等,并且记住每个人可能都不可行的名称或位置。 为此,您可以使用Command Palette ,可以使用CTRL + Shift + P打开。 在此选板中,您将找到所有快捷方式,面板,控制台设置,选项卡,设置等。
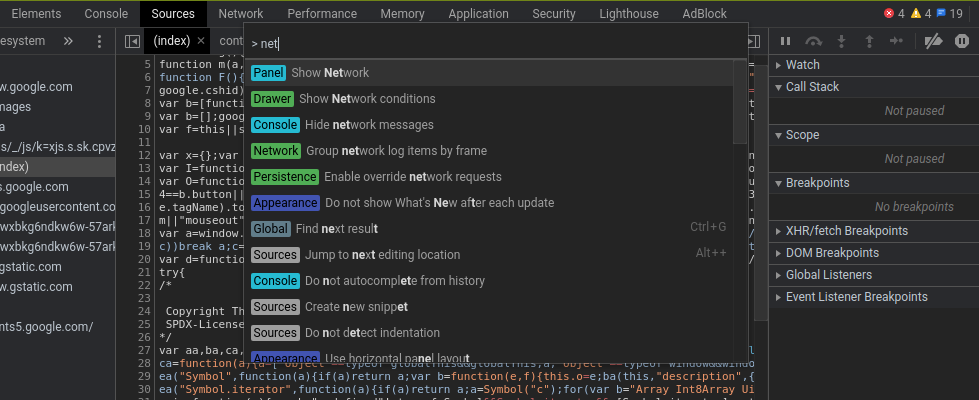
Also if you omit the Shift in this shortcut and instead use CTRL + P, it will give you list of all the available files which you can open. This can be also handy if your website has lots of source files.
同样,如果您在此快捷方式中省略Shift键,而使用CTRL + P ,它将为您提供所有可以打开的可用文件的列表。 如果您的网站上有很多源文件,这也很方便。
便捷的拾色器 (Convenient Color Picker)
I’m probably not the only one who endlessly messes with and tweaks fonts, colors and whatnot in CSS. To make at least the color tweaking a little easier, you might want use the Color Picker which you can open by finding element which color you want to change and clicking on it’s CSS color field.
我可能不是唯一一个在CSS中无休止地弄乱字体,颜色和其他东西的人。 为了至少使颜色调整更容易一些,您可能需要使用拾色器,可以通过找到要更改的颜色的元素并单击其CSS颜色字段来打开拾色器。
This is a nice feature, but the real game changer is the ability to select any color from website just by clicking on it while Color Picker is opened — like so:
这是一个不错的功能,但真正的游戏改变者是能够在打开拾色器的情况下通过单击从网站上选择任何颜色的能力,如下所示:

暗模式(Dark Mode)
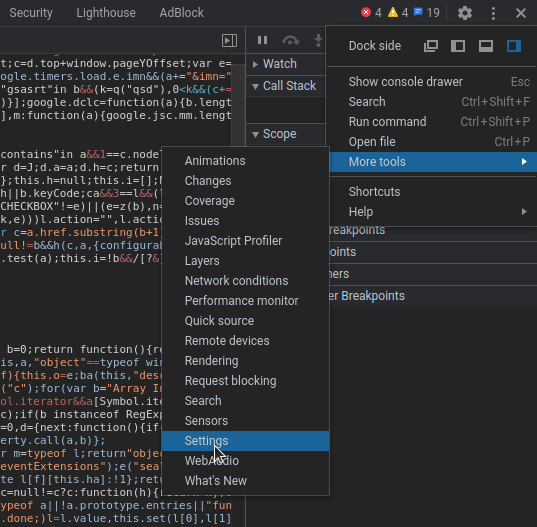
From the screenshots and GIFs above, you probably already noticed that I’m using dark mode in Chrome DevTools. So, in case you’re wondering how to change from light mode to dark mode, then you can navigate to top right corner of DevTools — click on the 3 Vertical Dots icon, next select More tools and then Settings. In the settings menu select Preferences and finally set Theme to Dark. That’s it! Welcome to the dark side!
在上面的屏幕截图和GIF中,您可能已经注意到我在Chrome DevTools中使用了暗模式。 因此,如果您想知道如何从亮模式更改为暗模式,则可以导航至DevTools的右上角-单击3 Vertical Dots图标,然后依次选择“更多工具”和“设置” 。 在设置菜单中,选择“首选项” ,最后将“主题”设置为“暗” 。 而已! 欢迎来到黑暗的一面!
查找定义CSS属性的位置(Find Where CSS Property is Defined)
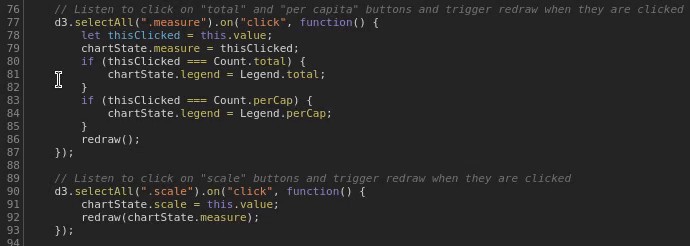
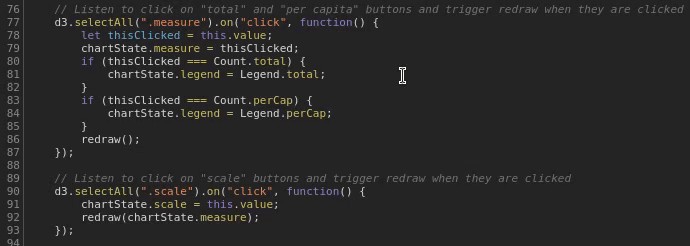
Working with CSS involves a lot of trial and error (at least for me, anyway) and rather than going between editing code in IDE and refreshing browser tab, why not save some time and do it all in DevTools? One such time-saving trick is to use CTRL + Click to find where the CSS property is defined, so that you can edit it in its source file:
使用CSS涉及很多试验和错误(无论如何,至少对我而言),而不是在IDE中编辑代码和刷新浏览器选项卡之间进行转换,为什么不节省一些时间,并在DevTools中全部完成呢? 这样一种省时的技巧是使用CTRL + Click查找CSS属性的定义位置,以便您可以在其源文件中对其进行编辑:
使用设计模式使网站可编辑(Make Website Editable With Design Mode)
Another CSS/Design trick is to use Design Mode to directly edit anything on the website. No need to modify HTML and CSS source files — just click/highlight anything on the page and change it! To turn this mode on just type document.designMode = "on" into console and start designing (well, really just messing with anything and everything):
CSS / Design的另一个技巧是使用“设计模式”直接编辑网站上的任何内容。 无需修改HTML和CSS源文件-只需单击/突出显示页面上的任何内容并进行更改! 要打开此模式,只需document.designMode = "on"控制台中输入document.designMode = "on"并开始设计(好吧,实际上只是弄乱了所有东西):

条件断点(Conditional Breakpoints)
It’s generally quite hard/annoying to properly debug JavaScript running in browser using IDE. So, instead of using IDE, let’s leverage DevTools debugger.
使用IDE正确调试浏览器中运行JavaScript通常非常困难/麻烦。 因此,让我们利用DevTools调试器,而不是使用IDE。
Setting basic breakpoints in debugger isn’t really interesting and you surely know how to do that. What about conditional breakpoints, though? Sometimes you might have a for loop which iterates over 1000 or more records and you know that bug surfaces only when certain condition is met — e.g. when if statement inside said loop returns false. To stop at the breakpoint only when this conditions is met, we can set up conditional breakpoint:
在调试器中设置基本断点并不是很有趣,您当然知道如何做到这一点。 但是条件断点呢? 有时您可能有一个for循环,该循环会迭代1000或更多条记录,并且您知道仅在满足某些条件时(例如,当所述循环内的if语句返回false时)才会出现false 。 要仅在满足此条件时才在断点处停止,我们可以设置条件断点:
We first right-click on existing breakpoint (red dot), then click on Edit Breakpoint and insert our desired expression. When this expression evaluates to true the breakpoint will be triggered and we will have the chance to poke around. This conditional breakpoint doesn't have to be added only on lines with if statements - it can be on any line and its expression will be evaluated every time code execution passes through it.
我们首先右键单击现有断点(红色点),然后单击“编辑断点”并插入所需的表达式。 当该表达式的值为true ,将触发断点,并且我们将有机会四处寻找。 该条件断点不必只在带有if语句的行上添加-它可以在任何行上,并且每次代码执行通过它时,都会评估其表达式。
While you are poking around, looking for the bug during paused execution, you might also consider adding suspecting variables to Watch tab, so that you can keep an eye on them as the values change. To add variable to Watch you can do the following:
当您四处寻找时,在暂停执行过程中查找错误时,您可能还考虑将可疑变量添加到“监视”选项卡,以便在值更改时随时关注它们。 要向Watch添加变量,您可以执行以下操作:
模拟慢速互联网(Simulating Slow Internet)
Most people know about the Network tab in DevTools in which you can see how long each function, operation or file load takes. What most people don’t know though, is that you can also use Network tab to simulate slow internet connection using Network Throttling. Here’s how to do that:
大多数人都知道DevTools中的“网络”选项卡,您可以在其中查看每个功能,操作或文件加载所花费的时间。 但是,大多数人不知道的是,您还可以使用“网络”选项卡使用“网络限制”来模拟缓慢的Internet连接。 这样做的方法如下:
After adding and selecting this profile, all that’s left to do is refresh the page and see how it performs with terrible internet connection. Beware — by trying this — you might just realise how slow your website really is (kinda depressive personal experience).
添加并选择此配置文件后,剩下要做的就是刷新页面并查看其在糟糕的Internet连接下的性能。 当心(通过尝试执行此操作),您可能会意识到您的网站确实有多慢(有点令人沮丧的个人体验)。
衡量网站效果 (Measuring Website Performance)
While on the topic of performance, let’s explore what Chrome DevTools can do for us in terms of application profiling. To run profiler we need to switch to Performance tab in DevTools. When on this tab we just have to hit CTRL + Shift + E. This shortcut with start profiler and simultaneously refresh the page. After the page loads, we need to press this same shortcut again to stop profiler recording.
在性能方面,让我们探讨一下Chrome DevTools在应用程序性能分析方面可以为我们做些什么。 要运行事件探查器,我们需要切换到DevTools中的Performance选项卡。 在此选项卡上时,我们只需要按CTRL + Shift + E 。 该快捷方式与启动事件探查器同时刷新页面。 页面加载后,我们需要再次按此相同的快捷方式以停止分析器记录。
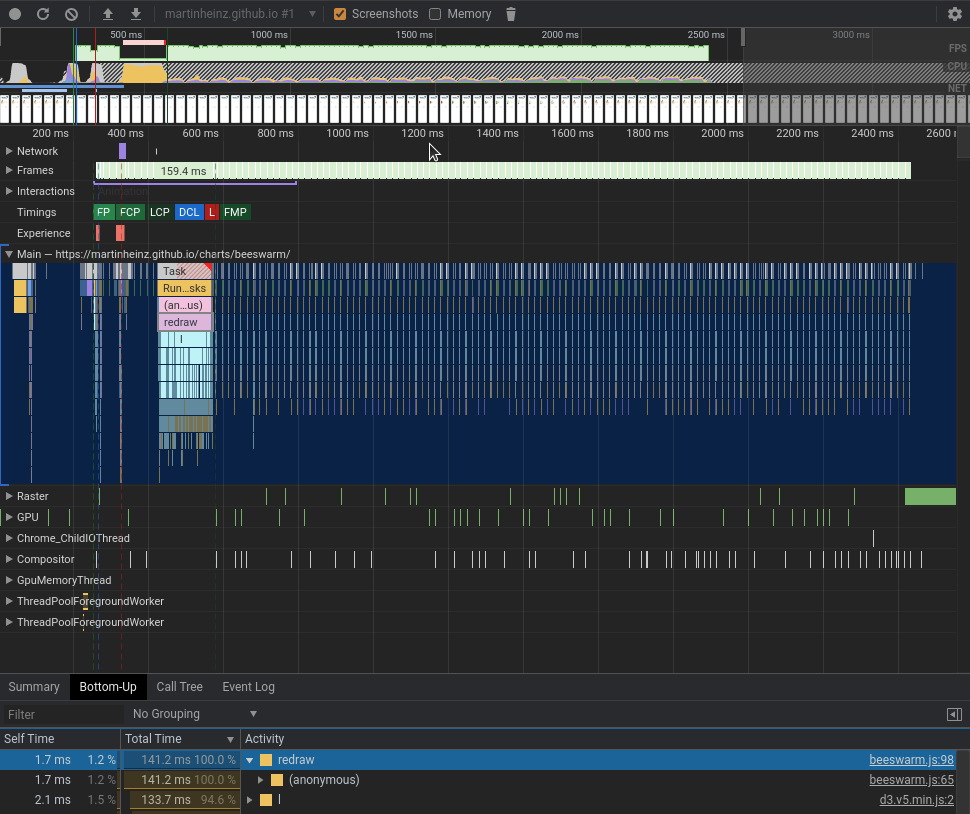
From here we can dig into network performance, animations, function times, etc. There’s a lot of things you could have a look at, but one in particular would be to check function timing. To check some of those functions, you can click on the orange bars in the diagram and select Bottom-Up tab in the bottom section. If you then sort them by Total Time you might be able to find some parts of your code that are taking little too much time to complete.
从这里我们可以深入了解网络性能,动画,功能时间等。您可以看很多东西,但是其中一个特别要检查功能计时。 要检查其中一些功能,可以单击图中的橙色条,然后在底部选择“自下而上”选项卡。 如果然后按“总时间”对它们进行排序,则可能可以找到代码中需要花费很少时间才能完成的某些部分。
结论 (Conclusion)
These are just a few of my favourite tips and tricks and this definitely isn’t exhaustive list of all the features in Chrome DevTools. You might find lots of useful features in Chrome DevTools Guides that fit your workflow. Also, I suggest to keep and eye on the What’s new section for the latest updates, which bring more useful tools to your browser.
这些只是我最喜欢的一些技巧和窍门,但这绝对不是Chrome DevTools中所有功能的详尽列表。 您可能会在适合您工作流程的Chrome DevTools指南中找到许多有用的功能。 另外,我建议您留意“最新消息”部分中的最新更新,该更新为您的浏览器带来了更多有用的工具。
If you’re missing any specific features it’s worth checking DevTools extensions on Chrome Webstore as there are extra tools built by both Google and user community. And if you can’t find tool/extension for your specific problem, maybe consider building something yourself using Extending DevTools tutorial. 😉
如果您缺少任何特定功能,则值得在Chrome Webstore上检查DevTools扩展,因为Google和用户社区都构建了额外的工具。 而且,如果找不到针对特定问题的工具/扩展程序,则可以考虑使用Extending DevTools教程自己构建一些东西。 😉
This article was originally posted at martinheinz.dev
本文最初发布于martinheinz.dev
If you liked this article you should check out other of my articles below!
如果您喜欢这篇文章,则应在下面查看我的其他文章!
翻译自: https://towardsdatascience.com/hidden-features-of-chrome-devtools-33d9de390dc0


 1174
1174

 被折叠的 条评论
为什么被折叠?
被折叠的 条评论
为什么被折叠?
 到【灌水乐园】发言


