


TensorFlow Probability uses structural time series models to conduct time series forecasting. In particular, this library allows for a “scenario analysis” form of modelling — whereby various forecasts regarding the future are made.
TensorFlow概率使用结构时间序列模型进行时间序列预测。 尤其是,该库允许进行“情景分析”形式的建模,从而做出有关未来的各种预测。
Structural time series modelling takes the inherent characteristics of the time series into account when making forecasts. This includes factors such as the local linear trend, seasonal, residual and autoregressive components. The greater the variation surrounding these components — the more uncertain the forecast.
结构时间序列建模在进行预测时会考虑时间序列的固有特征。 这包括局部线性趋势 , 季节 , 残差和自回归成分等因素。 这些组件之间的差异越大,预测就越不确定。
The examples illustrated in this article use the template from the Structural Time Series modeling in TensorFlow Probability tutorial, of which the original authors (Copyright 2019 The TensorFlow Authors) have made available under the Apache 2.0 license.
本文中说明的示例使用TensorFlow概率教程中的结构时间序列建模中的模板,该模板的原始作者(Copyright 2019 The TensorFlow Authors)已获得Apache 2.0许可。
联合航空旅客数据 (United Airlines Passenger Data)
For this example, a structural time series model is built in TensorFlow Probability to forecast air passenger data. The data is sourced from San Francisco Open Data: Air Traffic Passenger Statistics.
对于此示例,在TensorFlow概率中构建了一个结构时间序列模型来预测航空乘客数据。 该数据来自“旧金山开放数据:空中交通旅客统计” 。
In particular, passenger numbers for United Airlines from February 2014 — June 2020 are analysed. The specific segment of passengers analysed are enplaned, domestic, departing from Terminal 3 at Boarding Area E.
特别是分析了2014年2月至2020年6月联合航空的乘客数量。 从3号航站楼E登机区出发的经过分析的特定旅客是国内旅客。
Here is a visual overview of the time series:
这是时间序列的直观概述:
We can see that passenger numbers have traditionally ranged between 200,000 to 350,000 — before plummeting to a low of 7,115 in May 2020.
我们可以看到,旅客人数传统上介于200,000至350,000之间,然后在2020年5月跌至7,115的低点。
It is wishful thinking to expect that any time series model would have been able to forecast this — such a drop was very sudden and completely out of line with the overall trend.
一厢情愿的期望是,任何时间序列模型都能够预测到这一点-这种下降是非常突然的,并且与总体趋势完全不符。
However, could TensorFlow Probability have potentially identified a drop of a similar scale? Let’s find out.
但是,TensorFlow概率是否有可能识别出类似规模的下降? 让我们找出答案。
TensorFlow概率模型 (TensorFlow Probability Model)
The model is fitted with a local linear trend, along with a monthly seasonal effect.
该模型符合局部线性趋势以及每月的季节性影响。
def build_model(observed_time_series):
trend = sts.LocalLinearTrend(observed_time_series=observed_time_series)
seasonal = tfp.sts.Seasonal(
num_seasons=12, observed_time_series=observed_time_series)
residual_level = tfp.sts.Autoregressive(
order=1,
observed_time_series=observed_time_series, name='residual')
autoregressive = sts.Autoregressive(
order=1,
observed_time_series=observed_time_series,
name='autoregressive')
model = sts.Sum([trend, seasonal, residual_level, autoregressive], observed_time_series=observed_time_series)
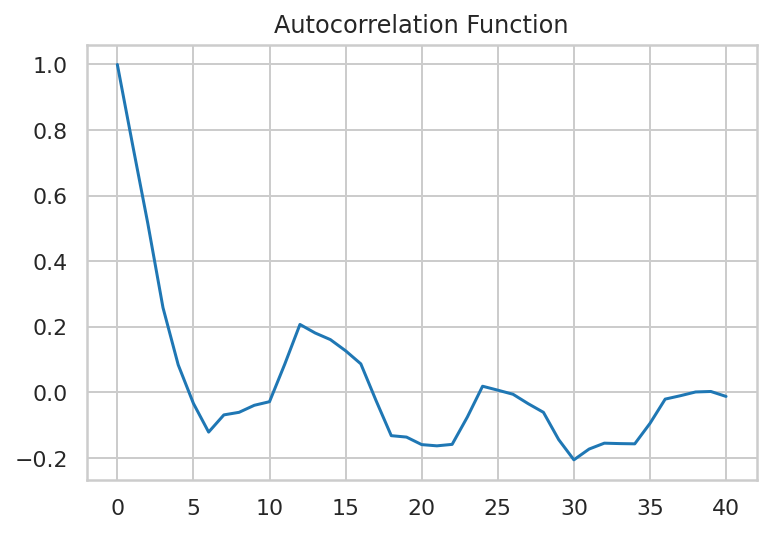
return modelNote that since autocorrelation is detected as being present in the series — an autoregressive component is also added to the model.
请注意,由于检测到序列中存在自相关,因此还将自回归分量添加到模型中。
Here is a plot of the autocorrelation function for the series:
这是该系列的自相关函数的图:
The time series is split into training and test data for the purposes of comparing the forecasts with the actual values.
时间序列分为训练和测试数据,目的是将预测值与实际值进行比较。
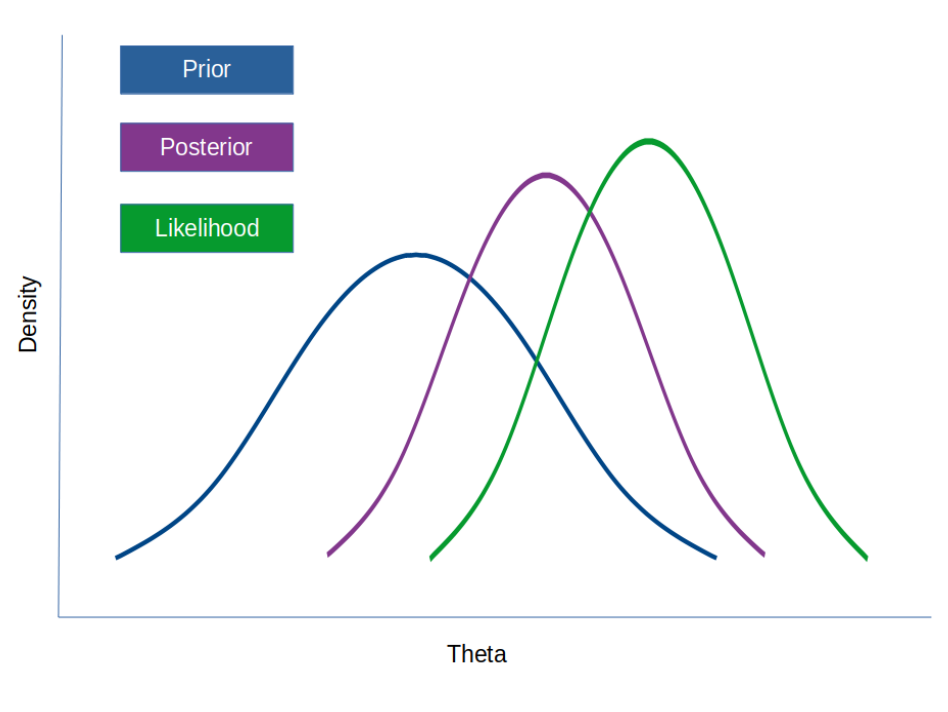
The forecast is made using the assumption of a posterior distribution — that is, a distribution comprised of the prior distribution (prior data) and a likelihood function.
预测是使用后验分布 (即由先验分布(先验数据)和似然函数组成的分布)的假设进行的。
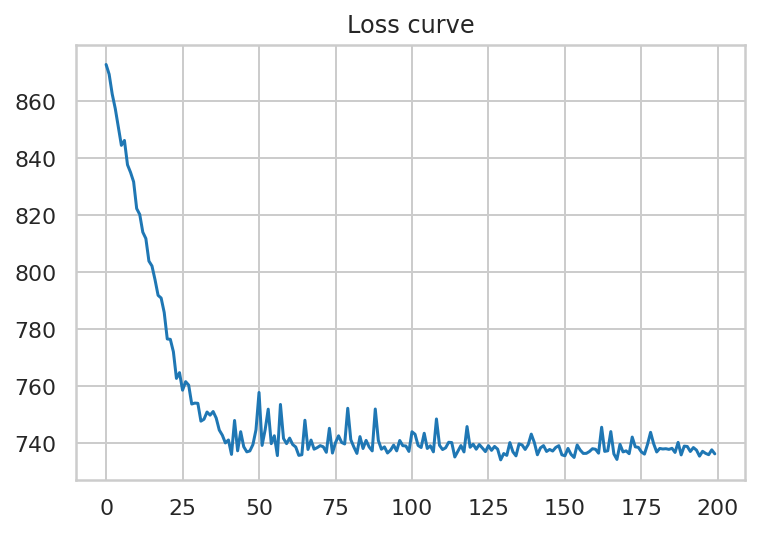
In order to effect this forecast, the TensorFlow Probability model minimises the loss in the variational posterior as follows:
为了实现此预测,TensorFlow概率模型将变后验中的损失最小化,如下所示:
#@title Minimize the variational loss.# Allow external control of optimization to reduce test runtimes.
num_variational_steps = 200 # @param { isTemplate: true}
num_variational_steps = int(num_variational_steps)optimizer = tf.optimizers.Adam(learning_rate=.1)
# Using fit_surrogate_posterior to build and optimize the variational loss function.@tf.function(experimental_compile=True)
def train():
  elbo_loss_curve = tfp.vi.fit_surrogate_posterior(
    target_log_prob_fn=tseries_model.joint_log_prob(
        observed_time_series=tseries_training_data),
    surrogate_posterior=variational_posteriors,
    optimizer=optimizer,
    num_steps=num_variational_steps)
  return elbo_loss_curveelbo_loss_curve = train()plt.plot(elbo_loss_curve)
plt.title("Loss curve")
plt.show()# Draw samples from the variational posterior.
q_samples_tseries_ = variational_posteriors.sample(50)
Here is a visual of the loss curve:
这是损耗曲线的外观:
预报 (Forecasts)
20 samples (or 20 separate forecasts) are made using the model:
使用该模型制作了20个样本(或20个单独的预测):
# Number of scenarios
num_samples=20tseries_forecast_mean, tseries_forecast_scale, tseries_forecast_samples = (
tseries_forecast_dist.mean().numpy()[..., 0],
tseries_forecast_dist.stddev().numpy()[..., 0],
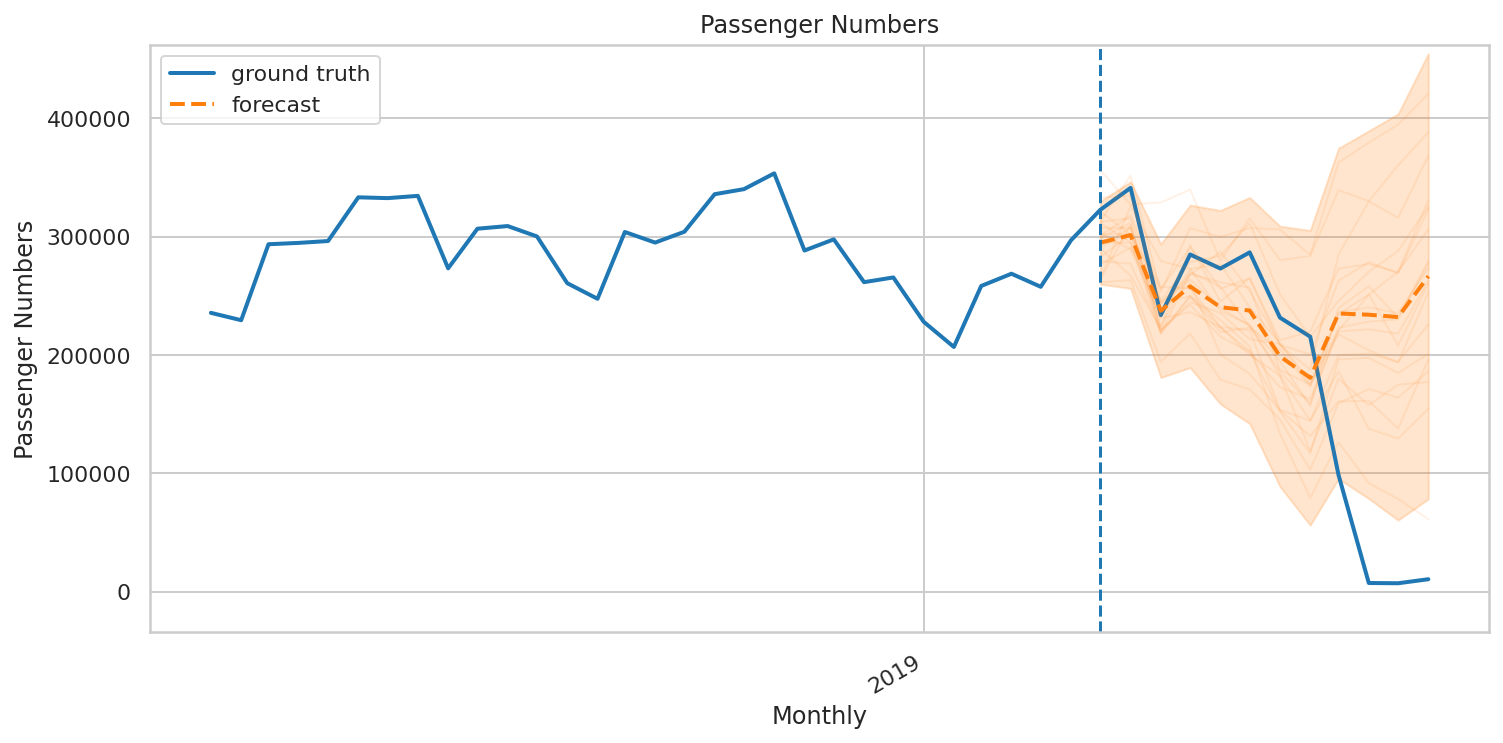
tseries_forecast_dist.sample(num_samples).numpy()[..., 0])Here is a plot of the forecasts:
这是预测的图:
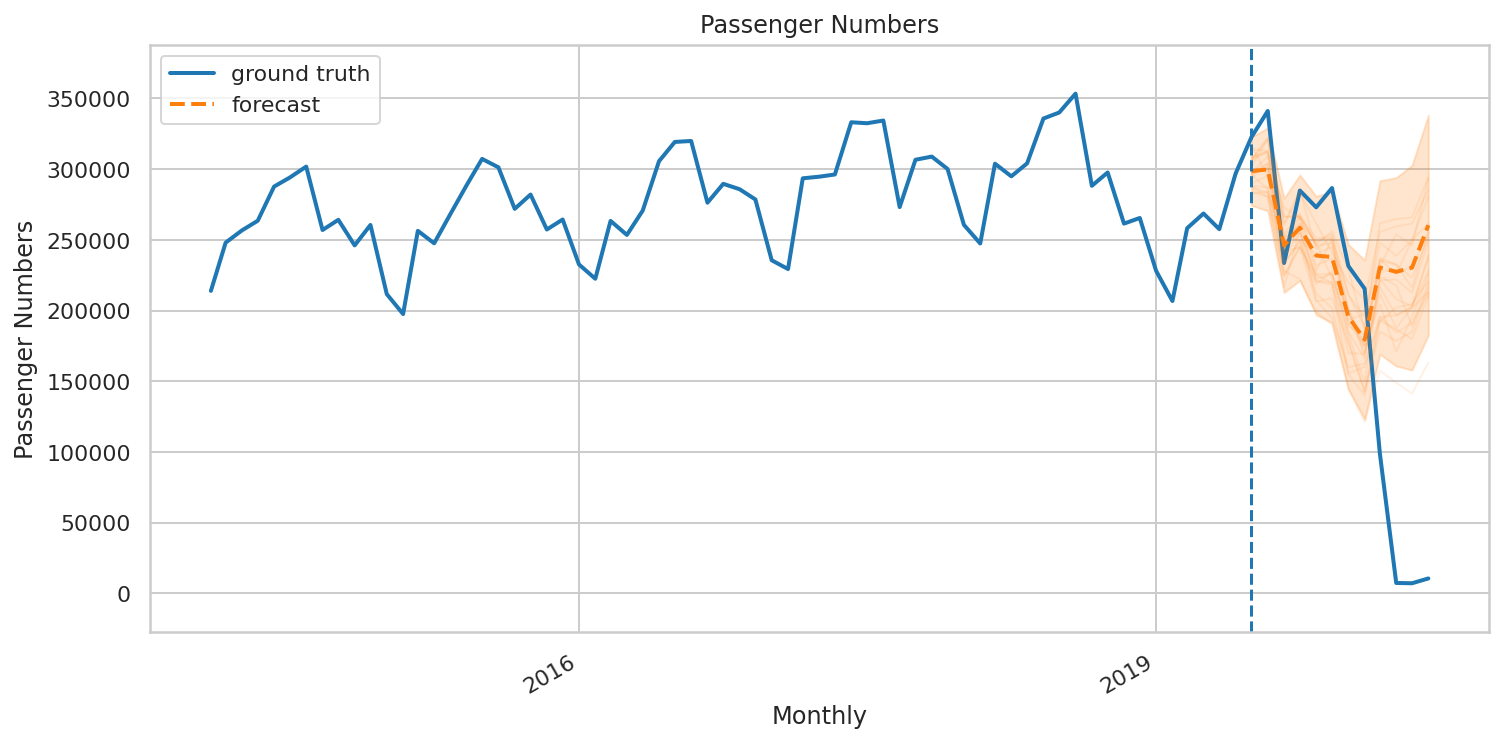
We can see that while the worst case scenario forecasted a drop to 150,000 passengers — the model generally could not forecast the sharp drop we have seen in passenger numbers.
我们可以看到,即使在最坏的情况下,预测的乘客量将下降到15万人,但该模型通常无法预测我们所看到的乘客人数的急剧下降。
Here is an overview of the time series components:
以下是时间序列组件的概述:
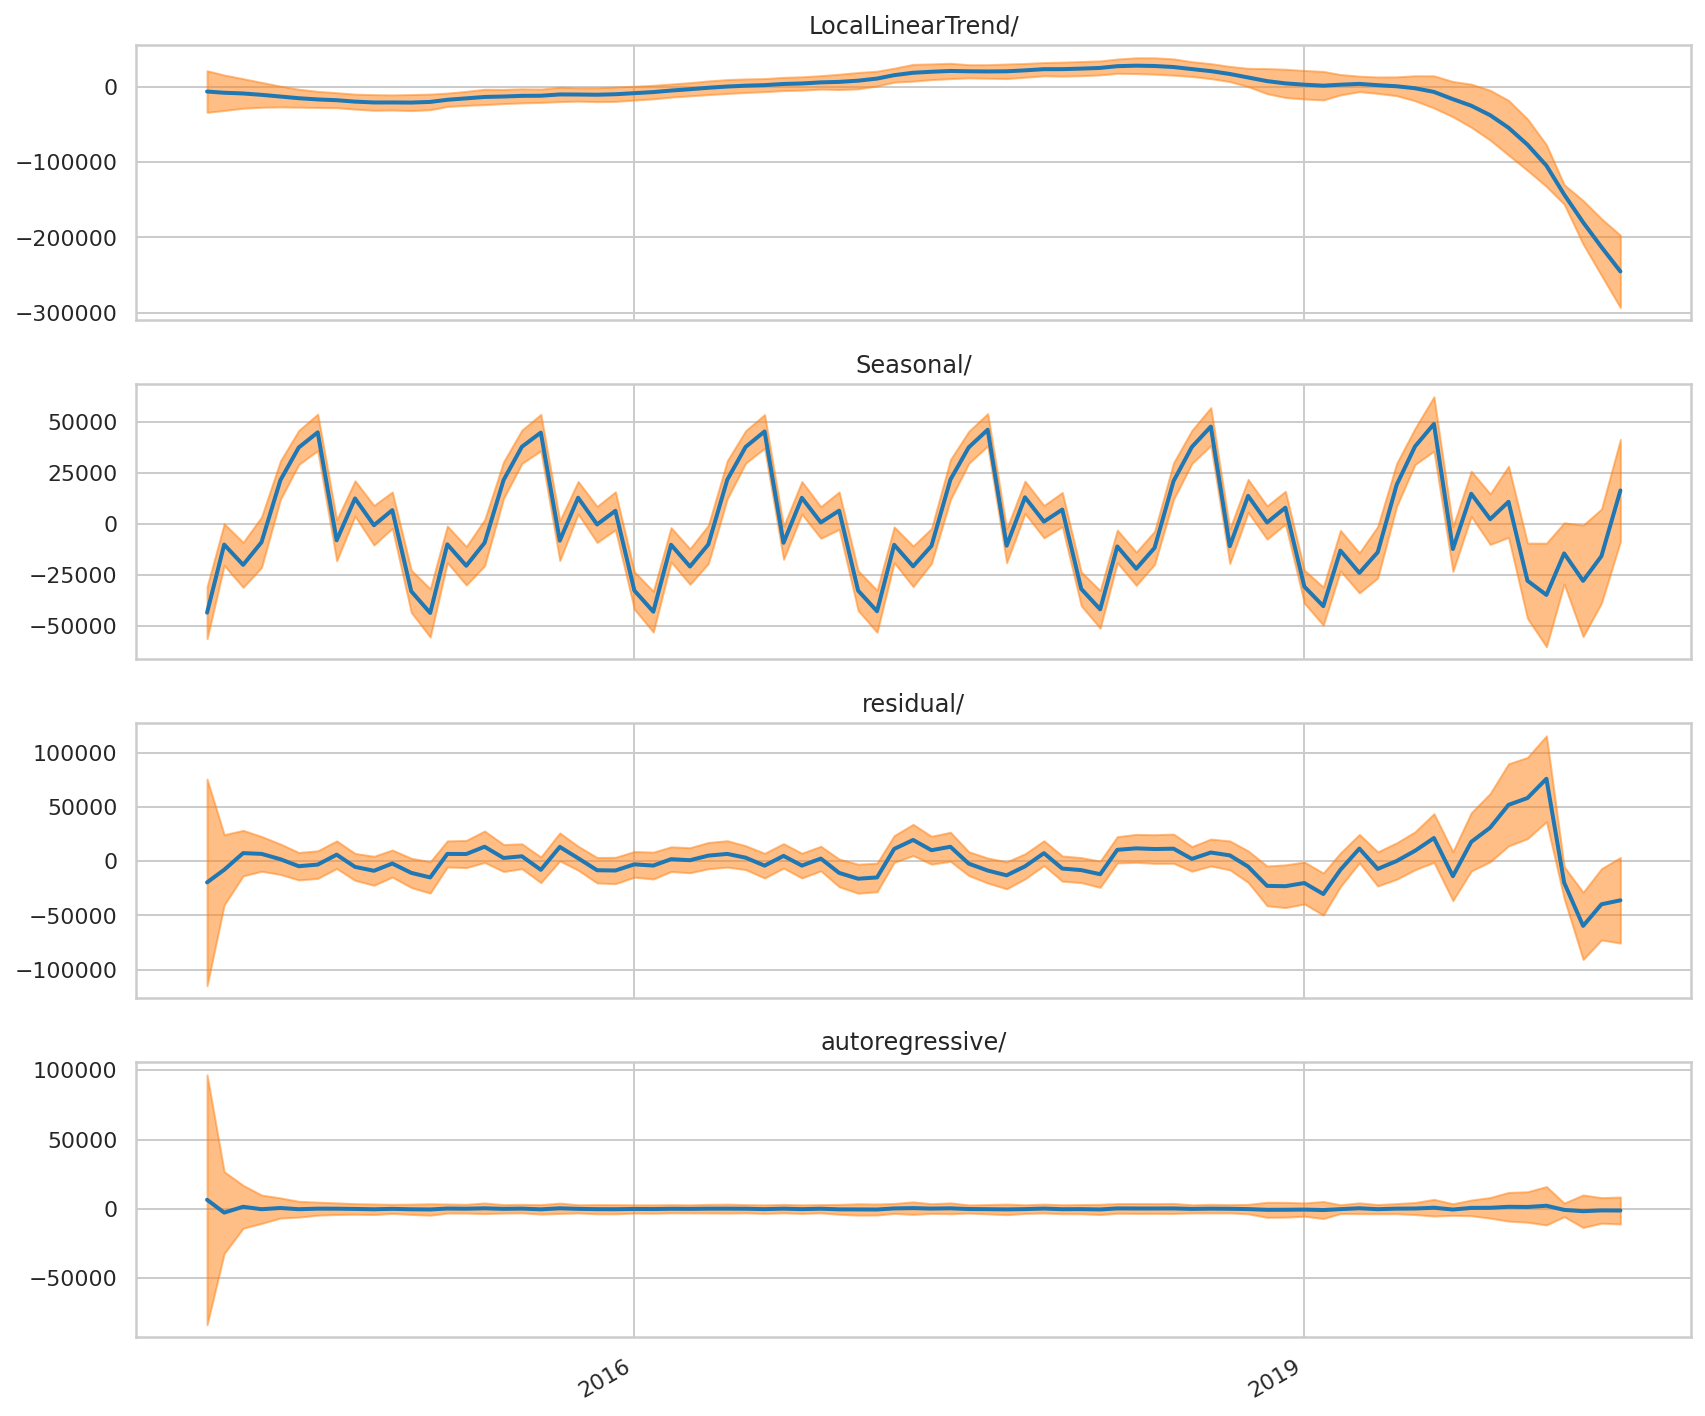
In particular, we can see that towards the end of the series — we see a widening of variation in the autoregressive and seasonal components — indicating that the forecasts have become more uncertain as a result of this higher variation.
特别是,我们可以看到在系列末期(我们看到自回归和季节成分的变化范围扩大了),这表明由于这种较高的变化,预测变得更加不确定。
However, what if we were to shorten the time series? Let’s rebuild the model using data from January 2017 onwards and see how this affects the forecast.
但是,如果我们要缩短时间序列怎么办? 让我们使用2017年1月以后的数据重建模型,看看这如何影响预测。
We can see that the “worst-case scenario” forecast comes in at roughly 70,000 or so. While this is still significantly above the actual drop in passenger numbers — this model is doing a better job at indicating that a sharp drop in passenger numbers potentially lies ahead.
我们可以看到“最坏情况”的预测大约为70,000。 尽管这仍大大高于实际的乘客人数下降,但该模型在表明潜在的乘客人数急剧下降方面做得更好。
Let’s analyse the time series components for this forecast:
让我们分析此预测的时间序列成分:
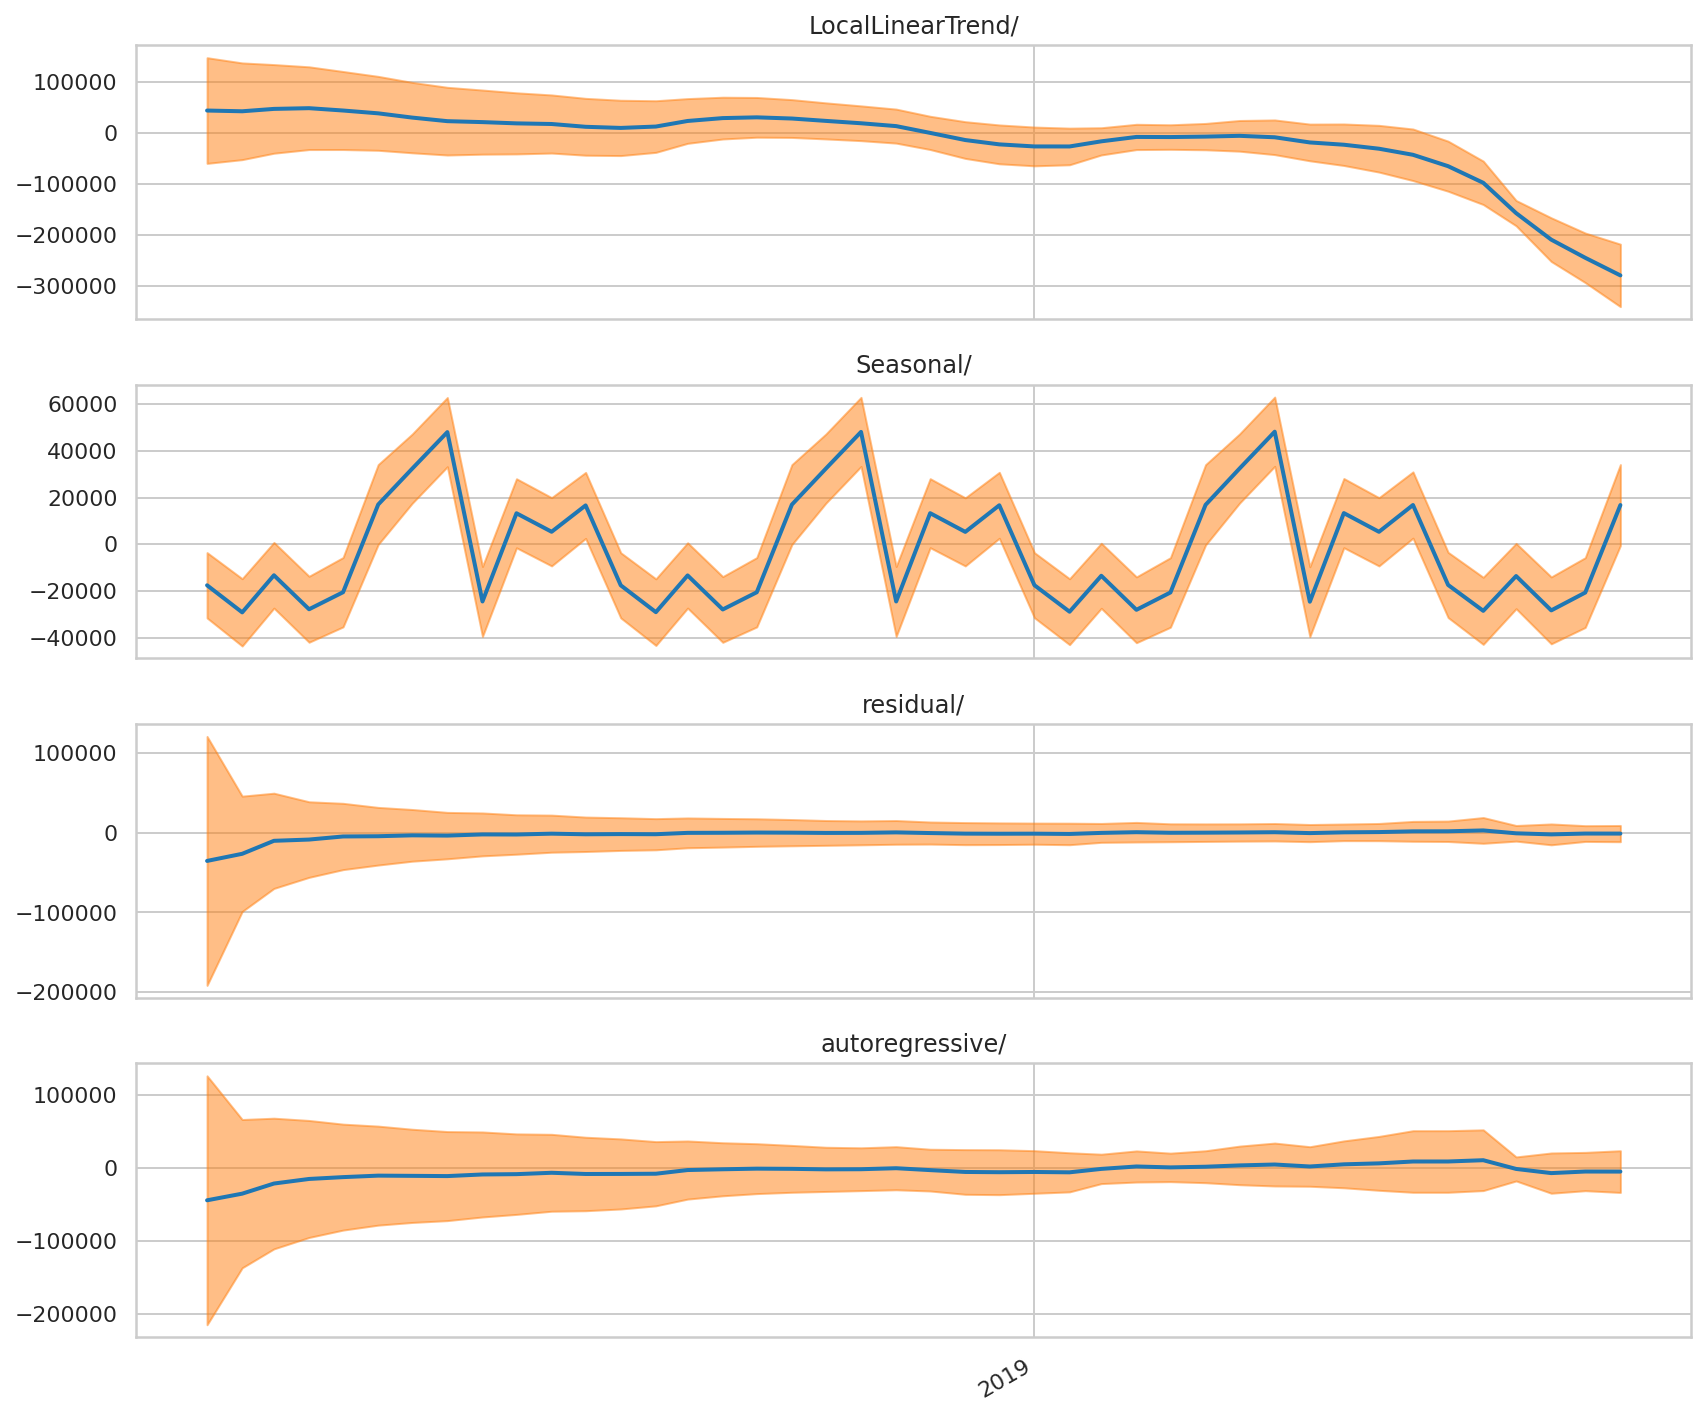
Unlike in the last forecast, we can see that the autoregressive, residual and seasonal components are actually narrowing in this instance — indicating more certainty behind the forecasts. In this regard, incorporating more recent data into this forecast has allowed the model to determine that a significant drop in passenger numbers could lie ahead — which ultimately came to pass.
与上次预测不同,我们可以看到在这种情况下自回归,残差和季节性成分实际上正在缩小,这表明预测的确定性更高。 在这方面,将更多最新数据纳入此预测已使该模型能够确定未来可能会出现旅客数量的大幅下降,而这种下降最终将成为现实。
Note that a main forecast (as indicated by the dashed orange line) is also given. Under normal circumstances, the model indicates that while there would have been a dip in passenger numbers to 200,000 — numbers would have rebounded to 250,000 in June. This is still less than the nearly 300,000 passengers recorded for the month of June — indicating that downward pressure on passenger numbers was an issue before COVID-19 — though nowhere near to that which has actually transpired, of course.
注意,还给出了主要预测(如橙色虚线所示)。 在正常情况下,该模型表明,尽管旅客人数将下降至20万人,但6月份的人数将回升至25万人。 这仍然低于6月份记录的近30万名乘客-这表明在COVID-19之前,乘客人数的下降压力是一个问题-当然,距离实际发生的事情还差得很远。
结论 (Conclusion)
This has been an overview of how TensorFlow Probability can be used to conduct forecasts — in this case using air passenger data.
这是如何使用TensorFlow概率进行预测的概述-在这种情况下,使用航空乘客数据。
Hope you found this article of use, and any feedback or comments are greatly welcomed. The code and datasets for this example can be found at my GitHub repository here.
希望您能找到本文的使用,并欢迎任何反馈或意见。 该示例的代码和数据集可以在我的GitHub存储库中找到 。
Disclaimer: This article is written on an “as is” basis and without warranty. It was written with the intention of providing an overview of data science concepts, and should not be interpreted as professional advice in any way.
免责声明:本文按“原样”撰写,不作任何担保。 它旨在提供数据科学概念的概述,并且不应以任何方式解释为专业建议。


 3869
3869


 被折叠的 条评论
为什么被折叠?
被折叠的 条评论
为什么被折叠?
 到【灌水乐园】发言


