


 本文介绍了如何在Python中使用WordCloud库生成词云,从简单词云开始,逐步展示如何改善词云,去除不重要的停用词,并通过自定义形状创建独特的词云效果,甚至使用图片颜色为词云赋予背景色彩。
Word cloud is an effective way of visualizing the texts. From a pool of texts, you can see which words are the dominants. They are fun and engaging visuals. So, just by looking at this visualization, you know the mode of the text. In this article, I am going to explain how to generate a word cloud using a python module called WordCloud. This is simple and easy. I will start with a simple word cloud and then show some custom and cool shape.
词云是可视化文本的有效方法。 从大量的文本中,您可以看到哪些词占主导地位。 它们既有趣又引人入胜的视觉效果。 因此,仅通过查看此可视化,您就可以知道文本的模式。 在本文中,我将解释如何使用称为WordCloud的python模块生成词云。 这很简单。 我将从一个简单的词云开始,然后展示一些自定义的酷形状。
建立 (Setup)
For this tutorial, I will use a dataset from Kaggle. Please feel free to download the dataset and follow along:
在本教程中,我将使用Kaggle的数据集。 请随时下载数据集并遵循:
To use the WordCloud module, you need to install it. That can be done by using the pip install command:
要使用WordCloud模块,您需要安装它。 这可以通过使用pip install命令来完成:
pip install wordcloudThe command for anaconda users:
Anaconda用户的命令:
conda install -c conda-forge wordcloudThe tools to be used:
使用的工具:
Jupyter Notebook environment
Please make sure that you have them installed.
请确保已安装它们。
简单词云 (Simple Word Cloud)
The simplest version is very easy to build. First import the necessary packages and dataset.
最简单的版本很容易构建。 首先导入必要的包和数据集。
import numpy as np
import pandas as pd
from os import path
from PIL import Image
from wordcloud import WordCloud, STOPWORDS, ImageColorGeneratorimport matplotlib.pyplot as plt
%matplotlib inlinedf = pd.read_csv("winemag-data-130k-v2.csv", index_col=0)
As you can see, this dataset has a description of wines of different countries and some other information as well. But for this tutorial, I will only focus on the description column because that contains a good amount of text. I will join all the descriptions and make one large text.
如您所见,该数据集包含对不同国家/地区的葡萄酒的描述以及一些其他信息。 但是对于本教程,我将仅关注描述列,因为其中包含大量文本。 我将加入所有描述并撰写一个大文本。
text = " ".join(review for review in df.description)
print ("There are {} words in the combination of all review.".format(len(text)))#output:
There are 31661073 words in the combination of all review.
That’s a big text data. Here is the code snippet to generate the simplest word cloud.
那是一个很大的文本数据。 这是生成最简单词云的代码片段。
wordcl = WordCloud().generate(text)
plt.imshow(wordcl, interpolation='bilinear')
plt.axis('off')
plt.show()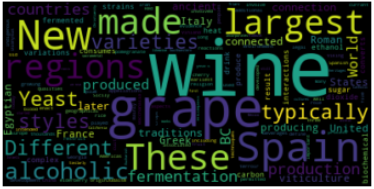
The most basic word cloud is done! The bigger and bolder the word is, the more frequently it appeared in the text.
最基本的词云已完成! 这个词越大越大,它在文本中出现的频率就越高。
Let’s see how to improve this word cloud.
让我们看看如何改善这个词云。
改善词云 (Improve The Word Cloud)
One important improvement you may think of is, to get rid of some less important words such as is, are, too, some, etc. That is very easy. Because there is a set of those words called ‘stopwords’ that are already there for us to use.
您可能会想到的一项重要改进是,摆脱一些不太重要的单词,例如“是”,“是”,“有些”等。这很容易。 因为有一组称为“停用词”的词已经可供我们使用。
stopwords = set(STOPWORDS)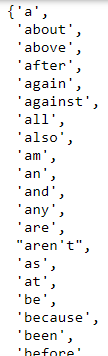
Here is part of the output. You can see some of the stopwords. There are a few more words I want to add in the stopwords. Such as the word ‘wine’. That is probably the most used word in the text as the word looks very big in the WordCloud. We know this is about wine. We do not need to visualize that word so big. I will also add a few other words in the stopwords as follows:
这是输出的一部分。 您可以看到一些停用词。 我想在停用词中添加几个词。 如“葡萄酒”一词。 这可能是文本中使用最多的单词,因为该单词在WordCloud中看起来很大。 我们知道这与葡萄酒有关。 我们不需要想象这个词那么大。 我还将在停用词中添加一些其他词,如下所示:
stopwords.update("drink", "now", "wine", "made", "the")I will use a few more styling parameters as well.
我还将使用更多的样式参数。
background_color: To change the default black background
background_color:更改默认的黑色背景
max_font_size: In the example above, you can see that some words are really large. I believe it will look better if we can control that.
max_font_size:在上面的示例中,您可以看到某些单词确实很大。 我相信,如果我们能够控制这一点,它将看起来更好。
max_words: Based on the frequency of appearance, it will present the specified number of words in the word cloud.
max_words:根据出现的频率,它将在单词云中显示指定数量的单词。
Let’s use all the parameters explained above and create the word cloud again:
让我们使用上面解释的所有参数并再次创建单词cloud:
wordcl = WordCloud(stopwords=stopwords, background_color="white", max_font_size=50, max_words= 2000).generate(text)
plt.figure(figsize=(10, 8))
plt.imshow(wordcl, interpolation='bilinear')
plt.axis('off')
plt.show()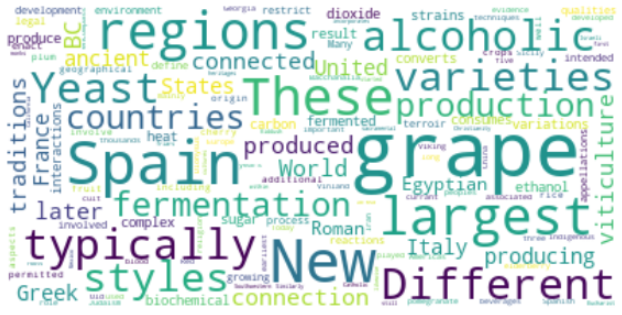
I suggest, please feel free to play with these parameters.
我建议,请随时使用这些参数。
使用自定义形状 (Use A Custom Shape)
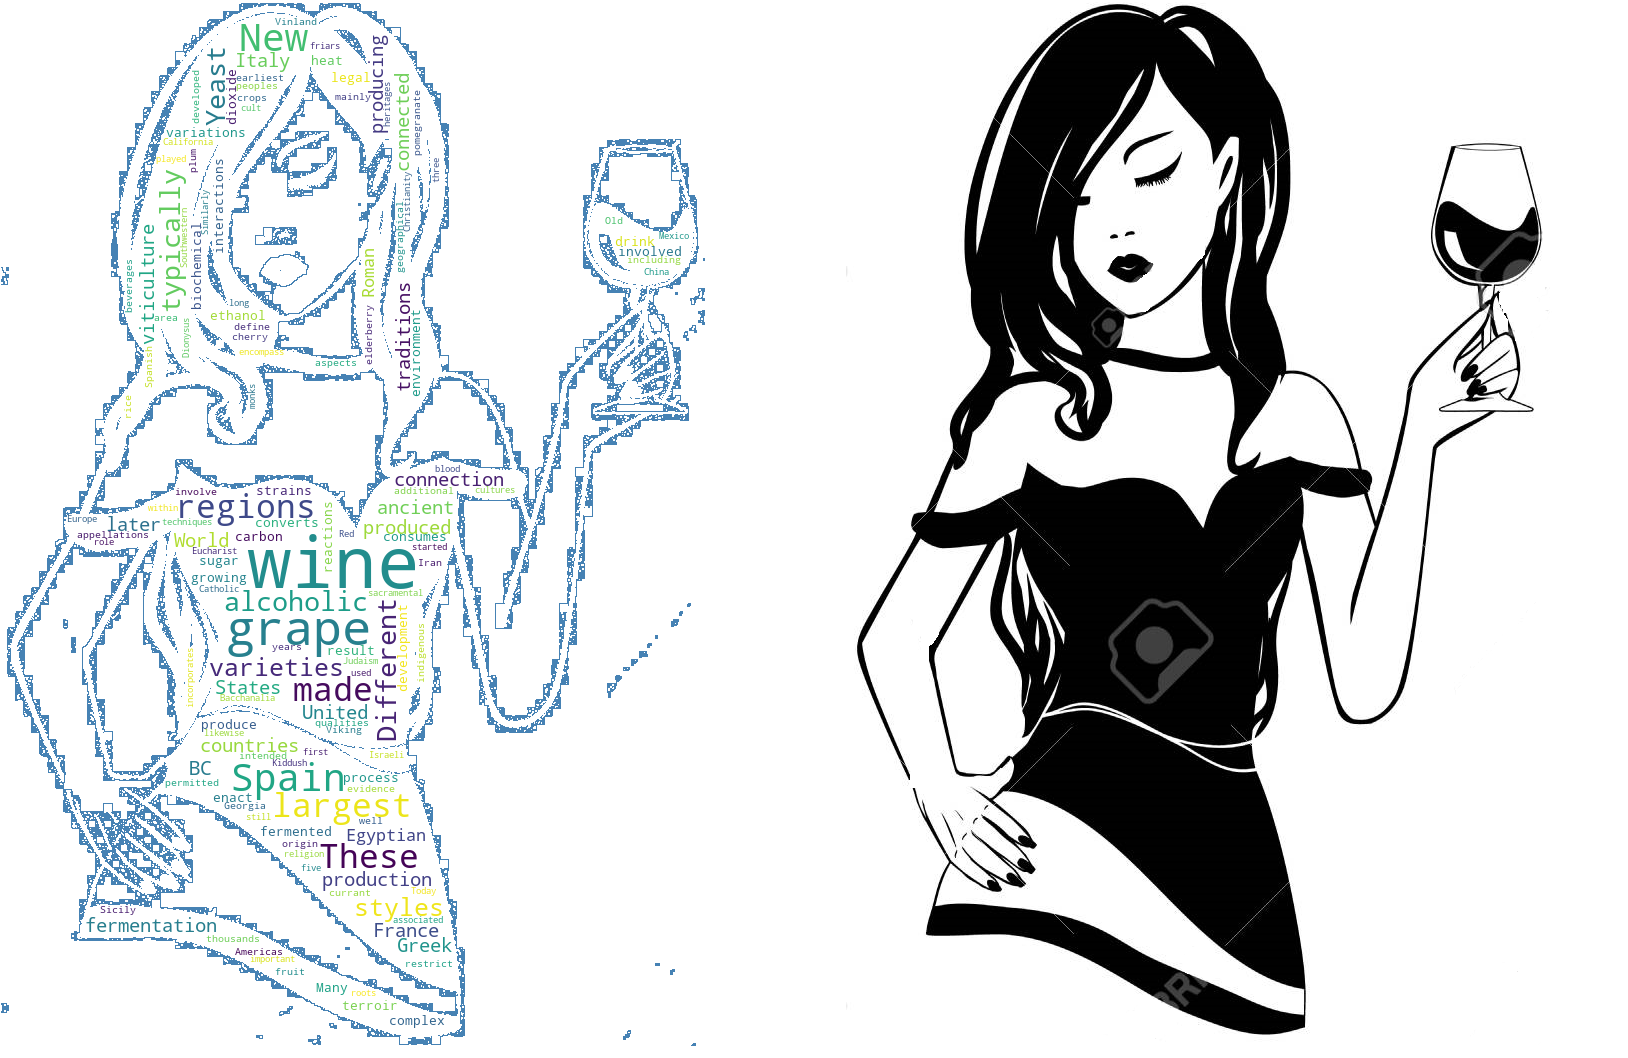
Instead of having a rectangular shape, we can make this word cloud in the shape of our choice using a custom shape. To demonstrate that I will use this picture:
除了使用矩形形状之外,我们还可以使用自定义形状使此字云变成我们选择的形状。 为了证明我将使用这张照片:

You can take a screenshot from this page as well to use this picture. We will make our word cloud in this shape. I saved this picture in a folder called ‘img’.
您也可以从此页面获取屏幕截图以使用此图片。 我们将使我们的词云变成这种形状。 我将此图片保存在名为“ img”的文件夹中。
mask = np.array(Image.open("img/w_wine.png"))Now, use this mask in the WordCloud module.
现在,在WordCloud模块中使用此掩码。
wc = WordCloud(background_color='black', mask=mask, mode='RGB',
              width=1000, max_words=200, height=1000,
              random_state=1)
wc.generate(text)
plt.figure(figsize=(10, 10))
plt.imshow(wc, interpolation='bilinear')
plt.tight_layout(pad=0)
plt.axis('off')
plt.show()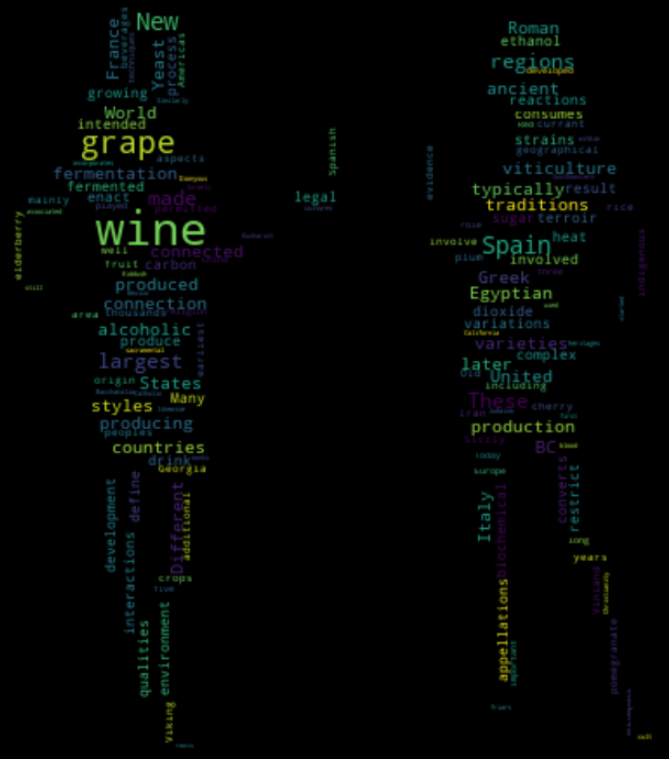
In my opinion, instead of all these colors, white-colored words will look clearer and better in black background.
我认为,除了所有这些颜色以外,白色的单词在黑色背景下看起来更清晰,更好。
wc = WordCloud(background_color='black', mask=mask, mode='RGB',
               color_func=lambda *args, **kwargs: "white",
              width=1000, max_words=200, height=1000,
              random_state=1)
wc.generate(text)
plt.figure(figsize=(10, 10))
plt.imshow(wc, interpolation='bilinear')
plt.tight_layout(pad=0)
plt.axis('off')
plt.show()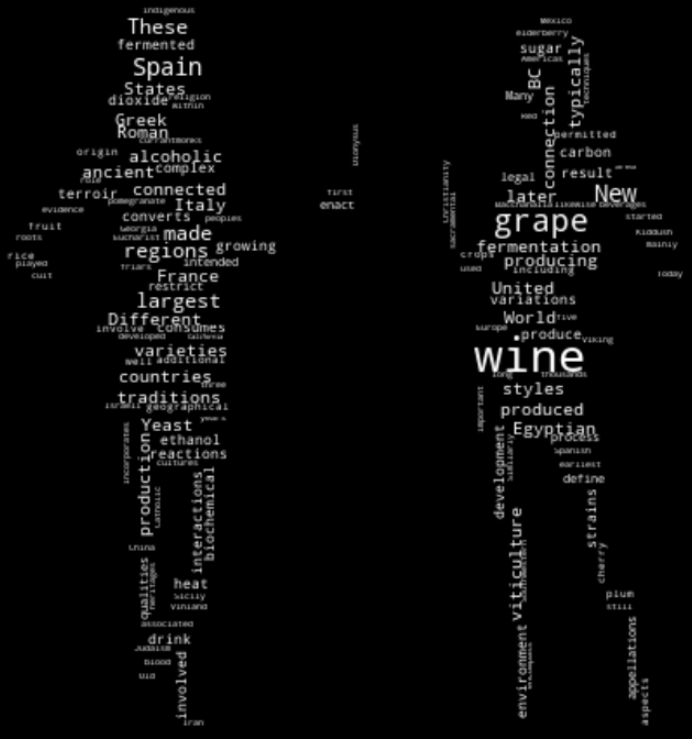
Get a more accurate shape using contour.
使用轮廓获得更精确的形状。
wc = WordCloud(background_color='white', mask=mask, mode='RGB',
               width=1000, max_words=1000, height=1000,
               random_state=1, contour_width=1, contour_color='steelblue')
wc.generate(text)
plt.figure(figsize=(10, 10))
plt.imshow(wc, interpolation='bilinear')
plt.tight_layout(pad=0)
plt.axis('off')
plt.show()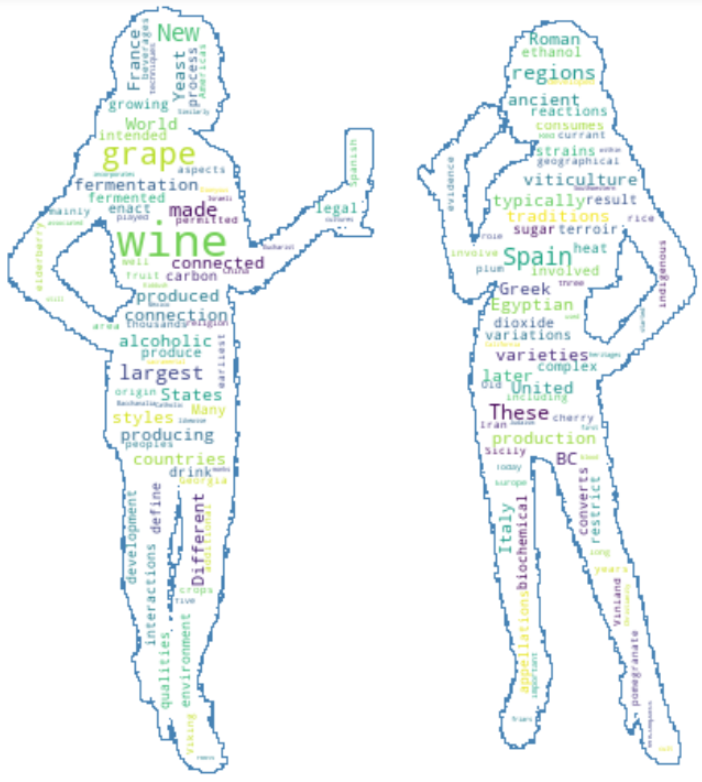
Isn’t that cool! Using the same code I developed this word cloud with the picture beside.
那不是很酷! 使用相同的代码,我开发了带有图片的单词云。
Please feel free to try it. Do we have to get those black pictures always to do this type of visualization? Not really. We can use a colored picture and make the color of words as the pictures. I will use this colored picture next.
请随时尝试。 我们是否必须始终获得这些黑色图片才能进行这种类型的可视化? 并不是的。 我们可以使用彩色图片,并将单词的颜色用作图片。 接下来,我将使用这张彩色图片。
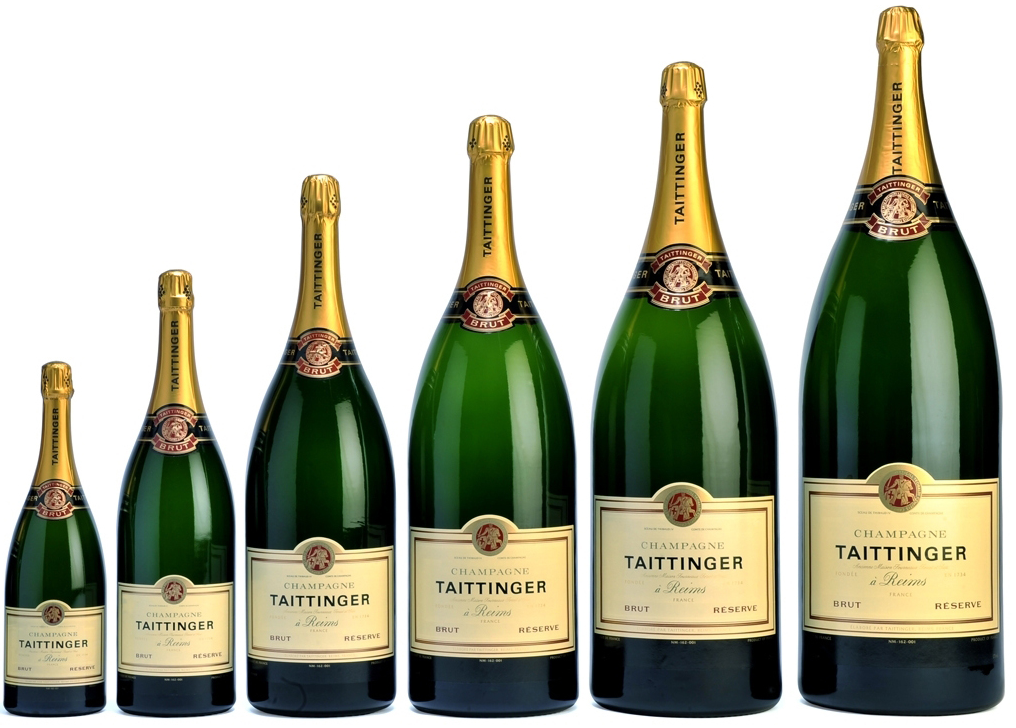
Here we will use the Image color generator module to generate the color for the word cloud. Here is the total code snippet:
在这里,我们将使用图像颜色生成器模块为词云生成颜色。 这是总代码段:
bottles = np.array(Image.open("img/bottle size.png"))
wc = WordCloud(background_color='white', mask=bottles)
wc.generate(text)image_colors = ImageColorGenerator(bottles)
wc.recolor(color_func=image_colors)plt.figure(figsize=[10, 10])
plt.imshow(wc, interpolation='bilinear')
plt.axis('off')
plt.show()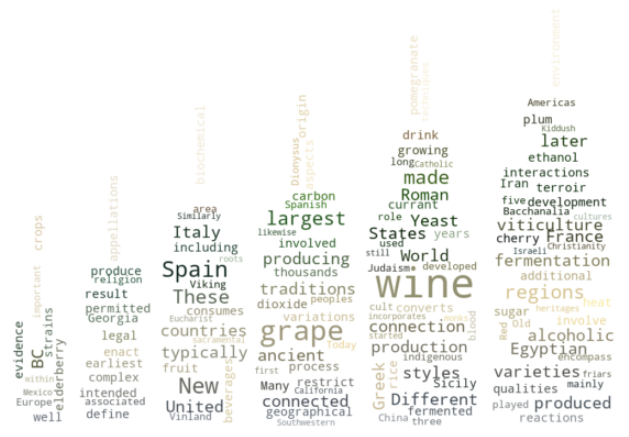
Look the color of the words are almost like the color of the bottles. But it is not that exact. Because the color of the bottles is not uniform and simple.
看起来的文字颜色几乎像瓶子的颜色。 但这不是那么精确。 因为瓶子的颜色不均匀简单。
One disadvantage is if the shape is too complicated and the color is complicated it may not give you the desired result.
一个缺点是,如果形状过于复杂且颜色过于复杂,则可能无法获得理想的效果。
The shape of the bottles is simple. So, the shape of the word cloud came out to be reasonably clear. But the color of the bottles is a bit complicated. In my opinion, the word cloud could not catch the exact color of the bottles.
瓶子的形状很简单。 因此,“云”一词的形状很清楚。 但是瓶子的颜色有点复杂。 我认为,“云”一词无法捕捉到瓶子的确切颜色。
As I showed before, you can put a border on this.
正如我之前所展示的,您可以在此上加边框。
wc = WordCloud(background_color="white", mask=bottles,
              contour_width=1, contour_color='firebrick')
wc.generate(text)
image_colors = ImageColorGenerator(bottles)
wc.recolor(color_func=image_colors)
plt.figure(figsize=(10,10))
plt.imshow(wc, interpolation='bilinear')
plt.axis('off')
plt.show()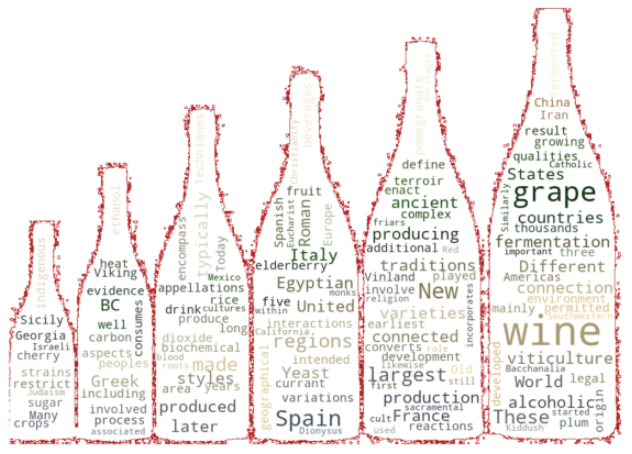
Finally, you may want to save this image in a file. I have a folder called ‘img’ in the same folder as this notebook. I decided to save this file there. Here is how to do that:
最后,您可能需要将此图像保存在文件中。 我在与此笔记本相同的文件夹中有一个名为“ img”的文件夹。 我决定将此文件保存在那里。 这样做的方法如下:
wc.to_file("img/wine.png")结论 (Conclusion)
I tried to explain the process of making a word cloud in this article. Provided some code snippet that should work well. There are other parameters in the WordCloud module, I did not touch it because I wanted to keep it as simple as I can.
我试图在本文中解释使词云模糊的过程。 提供了一些应该可以正常工作的代码段。 WordCloud模块中还有其他参数,我没有碰它,因为我想让它尽可能简单。
补充阅读: (Additional Reading:)
翻译自: https://towardsdatascience.com/generate-word-clouds-of-any-shape-in-python-e87f265f6352


 3003
3003

 被折叠的 条评论
为什么被折叠?
被折叠的 条评论
为什么被折叠?
 到【灌水乐园】发言


