


Covid-19 virus outbreak has changed our lives and we will have to live with consequences for a long time. Covid-19 statistics has become a new number to follow on daily basis to understand how we and the governments are dealing with the virus and what kind of business and personal decisions we have to make. But how trusted Covid-19 statistics can actually be? Are countries properly doing statistics and do we actually know the real situation?
Covid-19病毒爆发改变了我们的生活,我们将不得不长期承受后果。 Covid-19统计数据已成为每天要遵循的新数字,以了解我们和政府如何处理该病毒以及我们必须做出何种业务和个人决策。 但是,实际上Covid-19统计数据有多可信? 各国是否在正确地进行统计,我们是否真正了解实际情况?
This research came into my mind after I recently watched Netflix series “Connected”, where one of the episodes was about some unexplained, but known law of digits — Benford’s Law or law of first-digits. In short Benford’s Law says, that in many real-life sets of numerical data the first digits of these numbers always follows same pattern of frequency. Digit 1 will be the first digit for ~30% of numbers, digit 2 ~17.6% of numbers and so on till digit 9, which will be the first digit for ~ 4.6% of numbers in any given data set. I will not go in details, so if you want then more detailed description you can find in this Medium article — https://towardsdatascience.com/what-is-benfords-law-and-why-is-it-important-for-data-science-312cb8b61048 or by watching Netflix series “Connected”, episode “Digits”. Rumor says that USA IRS is using Benford’s Law as trigger for fraud detection of income statements, because it is very hard to randomly create or calculate numbers of income statement so they would conform with Benford’s Law.
我最近看了Netflix系列“ Connected”之后,便想到了这项研究,其中的一集讲述的是一些无法解释但已知的数字定律-Benford's Law或一位数定律。 简而言之,本福德定律说,在许多实际数字数据集中,这些数字的前几位始终遵循相同的频率模式。 数字1将是约30%的数字的第一个数字,数字2是约17.6%的数字,依此类推,直到数字9,这将是任何给定数据集中约4.6%的数字的第一个数字。 我不会详细介绍,因此,如果您需要更多详细说明,可以在此中型文章中找到— https://towardsdatascience.com/what-is-benfords-law-and-why-is-it-important-for -data-science-312cb8b61048或通过观看Netflix系列“已连接”的第“数字”集。 谣言说,美国国税局正在使用本福德定律作为对损益表进行欺诈检测的触发因素,因为很难随机创建或计算损益表的数量以使其符合本福德定律。
So my hypothesis is that if countries are doing Covid-19 statistics properly, then the firsts digits of statistics should follow frequency distribution as per Benford’s Law. I chose to use Covid-19 statistics from https://www.worldometers.info/ and took Daily New Cases as data set for research. I extracted data of five highest listed countries per total cases from each continent (Africa, Asia, Europe, Oceania (only two countries), South America, North America) and also randomly selected other countries which seemed interesting to be included in this data set. In total 42 countries were selected and analyzed.
因此,我的假设是,如果国家/地区正确进行Covid-19统计,则根据Benford定律,统计的前几位应遵循频率分布。 我选择使用来自https://www.worldometers.info/的Covid-19统计数据,并将Daily New Cases作为研究的数据集。 我从每个大陆(非洲,亚洲,欧洲,大洋洲(仅两个国家),南美洲,北美洲)的总病例中提取了五个列出的最高国家/地区的数据,还随机选择了其他有趣的国家/地区,这些国家似乎很有趣。 。 总共选择和分析了42个国家。
First thing to check was how trusted worldwide data of Daily New Cases can be according to Benford’s Law. To be honest results show that not much, because trust index* is 47.40%, which is rather low. The chart below shows how first-digit frequency distribution should look according to Benford’s Law (blue bars) and how it looks for worldwide Daily New Cases data set (orange bars):
首先要检查的是,根据本福德定律,《每日新案件》的全球数据有多可信。 坦白地说,结果并不多,因为信任指数*为47.40% ,这是相当低的。 下表显示了根据本福德法则的前几位频率分布(蓝色条形)以及如何查找全球每日新病例数据集(橙色条形):
*trust index is created based on deviation in percents from frequency distribution of each digit according to Benford’s Law.
*根据本福德定律,信任指数是根据与每个数字的频率分布的百分比偏差来创建的。
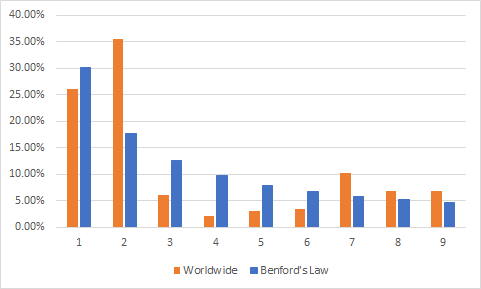
Deviations are very noticeable and that means that if we look on Daily New Cases worldwide overall then the accuracy is not high and we shouldn’t trust it. But does it mean that all Covid-19 statistics are wrong and we shouldn’t trust it at all?
差异非常明显,这意味着如果我们整体上看待全球每日新案件,那么准确性就不高,我们不应该信任它。 但这是否意味着所有Covid-19统计数据都是错误的,我们根本不应该相信它吗?
To find out more I deep dived into the data set and checked which countries are doing statistics properly according to Benford’s Law and which countries are ruining the overall statistics. Table below shows my chosen countries and their trust indexes:
为了了解更多信息,我深入研究了数据集,并检查了哪些国家/地区根据本福德法则正确地进行了统计,哪些国家/地区破坏了总体统计数据。 下表显示了我选择的国家及其信任指数:
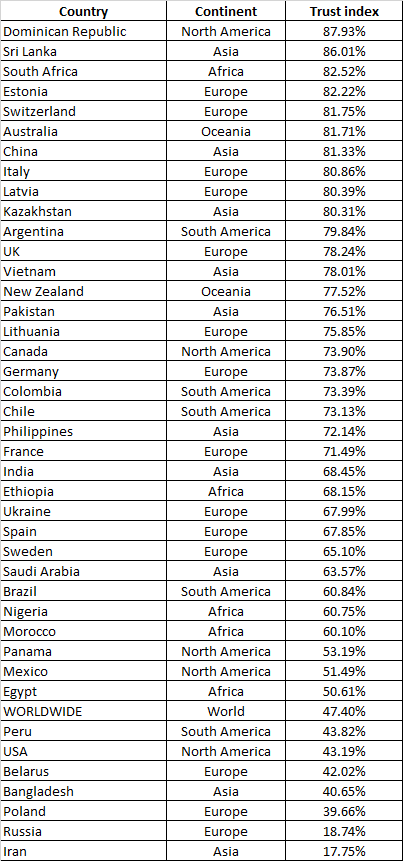
If we are looking on TOP 10 countries then there is not one continent better than others in reporting, and overall none of the continents is better or worse. The bottom of the table is concerning, but I am not stating that these countries are lying or faking data, because there can be errors in data of tests or the methodology how statistics are done may be incomplete, so I will leave it to yourself to decide your own truth.
如果我们关注的是前十名国家,那么在报告方面,没有哪一个大洲比其他大洲更好,而且总体而言,没有哪个大洲的好坏。 表格的底部是有关的,但我并不是要说明这些国家在撒谎或伪造数据,因为测试数据可能存在错误,或者统计方法可能不完整,因此我将自己留给自己决定自己的真相。
To prove my hypothesis we can check how the best countries according to trust index look on charts comparing with Benford’s Law:
为了证明我的假设,我们可以根据信任指数检查最佳国家在图表上与本福德定律相比如何:
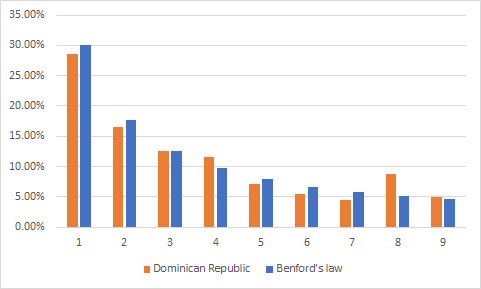
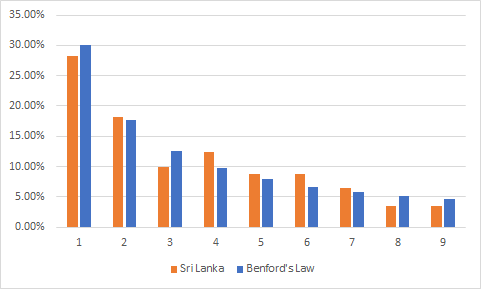
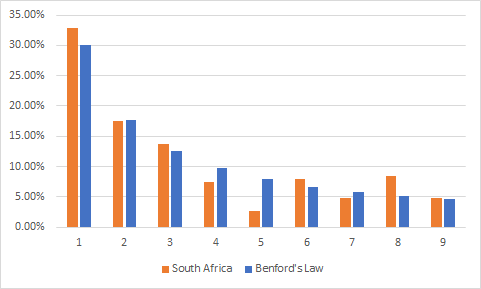
We can see stunningly precise first-digit frequency distribution with small deviations here and there. Now let’s look on the BOTTOM 3:
我们可以看到非常精确的第一位数频率分布,在这里和那里都有很小的偏差。 现在让我们看一下底部3:
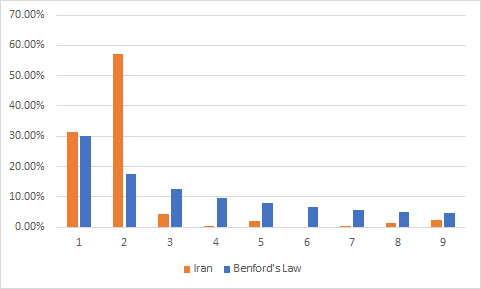
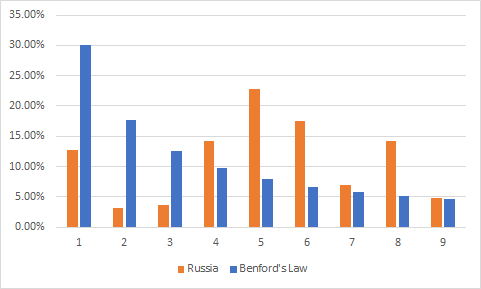
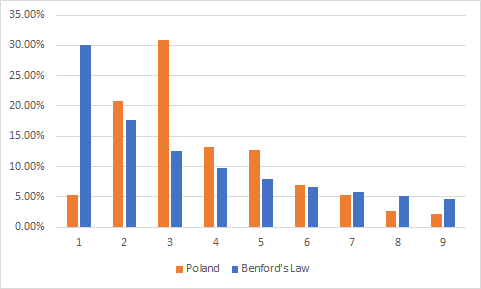
Here we can see high deviations from Benford’s Law pattern, which assuming that Benford’s Law is true would make me conclude that statistics of these countries are not precise and data is incomplete and shouldn’t be trusted.
在这里,我们可以看到与本福德定律模式的高度偏差,后者假设本福德定律是正确的,这使我得出以下结论:这些国家的统计数据不准确,数据不完整,因此不值得信任。
As the final part of my research I decided to combine TOP20 countries data to expand the data set and see what is the correlation with Benford’s Law if I take countries with the highest trust indexes, i.e. countries with most complete data sets. Here is the chart:
作为研究的最后一部分,我决定合并TOP20国家的数据以扩展数据集,并查看如果我选择信任指数最高的国家(即数据集最完整的国家)与本福德定律有什么关系。 图表如下:
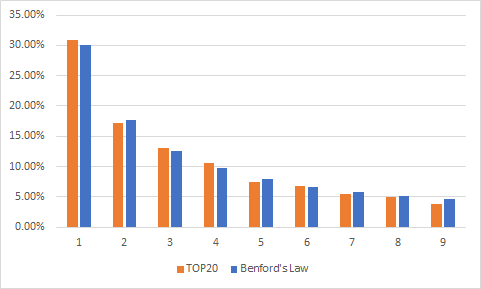
Amazingly by combining these data sets I got trust index of 95.53% which is almost perfect pattern of first-digits as per Benford’s Law (eureka moment). So it means that the bigger the data set the more likely it should fully conform with Benford’s Law.
令人惊讶的是,通过组合这些数据集,我得到了95.53%的信任指数,根据本福德定律(尤里卡矩),这几乎是完美的第一位数字模式。 因此,这意味着数据集越大,就越有可能完全符合本福德定律。
In conclusion I would like to return to hypothesis that if the countries are doing Covid-19 statistics properly, then firsts digits of statistics should follow frequency distribution as per Benford’s Law. We see that there are countries which statistics follow frequency distribution pattern as per Benford’s Law with high trust index, but still unanswered is the question how can we be sure that the top countries by trust index are doing statistics properly? As citizen of European Union I would trust to such countries as Estonia, Switzerland, Latvia and Italy by their reputation that they are doing their best to collect qualitative data sets of Daily New Cases, but that could be also biased assumption. So I would like to conclude that - yes, Benford’s Law works for natural sets of data, but with this research it is hard to prove that it can be considered as fraud detection method, because we don’t have the proof that the countries with the lowest trust index are not doing statistics properly. But if we assume that Benford’s Law is true, then we can do some conclusion about precision of statistics of the countries.
总而言之,我想回到一个假设,即如果这些国家正确地进行了Covid-19统计,那么根据本福德定律,统计的首位数应遵循频率分布。 我们看到有些国家/地区的统计数据遵循本福德定律的频率分布模式,并且具有较高的信任指数,但仍未得到解答的问题是,我们如何才能确保信任指数排名靠前的国家/地区进行正确的统计呢? 作为欧洲联盟的公民,我会以爱沙尼亚,瑞士,拉脱维亚和意大利等国家的声誉而相信他们正在尽力收集每日新病例的定性数据集,但这也可能是有偏见的假设。 因此,我想得出一个结论-是的,本福德定律适用于自然数据集,但是通过这项研究,我们很难证明它可以被视为欺诈检测方法,因为我们没有证据表明存在欺诈行为的国家/地区最低信任指数未正确进行统计。 但是,如果我们假设本福德定律是正确的,那么我们可以得出有关国家统计精度的结论。
Another conclusion is that countries with most Covid-19 cases actually are collecting qualitative statistics, because from selected 42 countries only 7 countries were below worldwide trust index of 47.40%. It means that the countries with fewer cases are the ones ruining overall worldwide statistics. That could be basis for another research if there would be interest for it.
另一个结论是,实际上有Covid-19病例最多的国家正在收集定性统计数据,因为从选定的42个国家中,只有7个国家的信任度低于全球信任指数的47.40%。 这意味着案件少的国家就是破坏全球总体统计的国家。 如果有兴趣的话,这可能是另一项研究的基础。
Last but not least, it was fun to check that frequency distribution of first-digits of natural set of numerical data actually conforms with Benford’s Law.
最后但并非最不重要的一点是,检查自然数字数据的第一位数字的频率分布是否确实符合本福德定律很有趣。
P.S. If you would like to get trust index of other countries not listed in this research, let me know in comments.
PS:如果您想获得本研究未列出的其他国家的信任指数,请在评论中让我知道。
P.S.S. For this research 13th September, 2020 data is used.
PSS对于此研究,使用了2020年9月13日的数据。
翻译自: https://medium.com/@nauris.bloks/how-much-can-we-trust-to-covid-19-statistics-9dbc92d25b3c


 被折叠的 条评论
为什么被折叠?
被折叠的 条评论
为什么被折叠?
 到【灌水乐园】发言


