


 本文介绍了如何利用Pyspark数据框和AWS EMR进行Google Analytics的大数据分析。通过AWS EMR服务,可以高效地处理和分析来自Google Analytics的大量数据,为业务洞察提供支持。
aws emr 大数据分析
By Yan Yang, Data Scientist @ Chewy
数据科学家Yan Yang @ Chewy
One of the biggest challenges for an e-commerce company is processing customer-generated session data. Here at Chewy’s Recommendations and Personalization Management team, we are constantly exploring ways to process session data to improve our website and better our customers’ shopping experience.
电子商务公司面临的最大挑战之一是处理客户生成的会话数据。 在Chewy的“建议和个性化管理”团队中,我们一直在探索处理会话数据的方法,以改善我们的网站并改善客户的购物体验。
PySpark running on Amazon Web Services’s Elastic Map Reduce (AWS EMR) is one tool I use often for this kind of high-volume data processing. In this blog post, I will walk through a step-by-step example from a past project to showcase this tool and discuss how to use it effectively. This blog post is for people who are already familiar with PySpark and basic AWS services such as S3, but who want to explore more about using EMR for PySpark and learn more about a useful feature in PySpark, DataFrames.
在Amazon Web Services的Elastic Map Reduce(AWS EMR)上运行的PySpark是我经常用于这种大容量数据处理的一种工具。 在这篇博客文章中,我将通过一个过去项目的分步示例来展示此工具,并讨论如何有效使用它。 本博客文章适用于已经熟悉PySpark和基本AWS服务(例如S3)但希望探索有关将EMR用于PySpark的更多信息并了解有关PySpark DataFrames中有用功能的人员的信息。
问题是什么? (What is the problem?)
In this example, I am faced with processing a year’s worth of Google Analytics session data. The processed data is for training a machine learning model that predicts whether a customer is going to make a purchase by the end of her session. The purpose of making this prediction is to proactively help the customer. If the probability of making a purchase is low, perhaps the customer is having trouble finding the products she needs and Chewy can make more helpful recommendations; if the probability is high, Chewy can make sure the user can access a shortcut to checkout. In this blog post, I am going to focus on the data processing part (I won’t be talking about the model itself). But interested readers can look at a paper by Baumann A. et al. for a general introduction to the problem of predicting purchase probability.
在此示例中,我面临着处理一年的Google Analytics(分析)会话数据的问题。 处理后的数据用于训练机器学习模型,该模型预测客户在会话结束之前是否要进行购买。 做出此预测的目的是积极帮助客户。 如果购买的可能性较低,则可能是客户无法找到所需的产品,而Chewy可以提出更有用的建议; 如果可能性很高,Chewy可以确保用户可以访问用于结帐的快捷方式。 在这篇博客文章中,我将专注于数据处理部分(我不会谈论模型本身)。 但是,有兴趣的读者可以看看一纸由鲍曼A.等。 关于预测购买可能性的问题的一般介绍。
My hypothesis for the model is that three types of features are important to the model: the query part of the URL, event actions, and user browsing patterns. Whenever a customer inputs a search term into a query, I hypothesize that she has a strong inclination to purchase a particular product. If she also looks at the second and the third pages of the returned results, this inclination is even stronger. Event actions are also informative regarding the customer’s intention. Two of the most revealing actions are adding a product to the shopping cart and removing a product from the shopping cart. User browsing patterns are the way a customer browses the webpages. Is she browsing the pages linearly and never going back to a previous page, or is she browsing between two products repeatedly? The paper by Baumann A. et al. indicates that there is a strong association between the type of behaviors and a user’s intention to buy.
我对该模型的假设是,三种类型的功能对该模型很重要:URL的查询部分,事件操作和用户浏览模式。 每当客户在查询中输入搜索字词时,我都会假设她有购买特定产品的强烈意愿。 如果她还查看返回结果的第二页和第三页,则这种倾向会更大。 事件操作也可以提供有关客户意图的信息。 最具启发性的两个动作是将产品添加到购物车和从购物车中移除产品。 用户浏览模式是客户浏览网页的方式。 她是线性地浏览页面并且从不退回到上一页,还是她在两种产品之间反复浏览? 该纸通过鲍曼A.等人。 表示行为类型与用户的购买意愿之间存在很强的关联。
These three types of features correspond to three processing tasks. For the query part of URL, I extract three features: 1) whether the URL contains queries, 2) how many equal signs are in the query and 3) how many numbers are in the query. For example, in the URL (not an actual url, just for demonstration purposes):
这三种类型的特征对应于三个处理任务。 对于URL的查询部分,我提取了三个功能:1)URL是否包含查询,2)查询中有多少个等号,以及3)查询中的数目。 例如,在URL中(不是实际的URL,仅用于演示目的):
url="/s?rh=number288anothernumber335thirdnumber1539equal=3"The query part of this example is `rh=number288anothernumber335thirdnumber1539equal=3`. This first processing task would return three features:
此示例的查询部分是“ rh = number288另一个数字335thirdnumber1539等于= 3”。 第一个处理任务将返回三个功能:
‘is_query’ = 1 — Because this URL contains a query
'is_query'= 1-因为此URL包含查询
‘num_equals’ = 2 — There are two equal signs in the query string
'num_equals'= 2-查询字符串中有两个等号
‘num_numbers’ = 4 — there are four numbers in the query string. These numbers are 288, 335, 1539 and 3.
'num_numbers'= 4-查询字符串中有四个数字。 这些数字是288、335、1539和3。
The second processing task is to create a boolean list of event actions that happened on this page. The event actions are defined in an event action list. This list contains events such as `add_to_cart` event, for which a customer clicked the “Add to Cart” button on this page. There are five events in the list, and this processing task is to return a boolean list in which a one means an event has happened and a zero otherwise. For example, if the customer added a product to the cart on this page but then subsequently removed it, then there are two events `add_to_cart` and `remove_from_cart`. Suppose no other events happened on this page, then the second processing task would produce a boolean list of `[1, 1, 0, 0, 0]`, where the two ones correspond to the two events that happened and zeros are the events that didn’t happen.
第二个处理任务是创建此页面上发生的事件操作的布尔列表。 事件动作在事件动作列表中定义。 此列表包含诸如“ add_to_cart”事件之类的事件,客户为此单击了此页面上的“添加到购物车”按钮。 列表中有五个事件,此处理任务是返回一个布尔列表,其中一个表示事件已发生,否则为零。 例如,如果客户在此页面上将产品添加到购物车,但随后又将其删除,则将发生两个事件“ add_to_cart”和“ remove_from_cart”。 假设此页面上没有其他事件发生,那么第二个处理任务将生成布尔值[1,1,0,0,0]的布尔列表,其中两个对应于发生的两个事件,零为事件那没有发生。
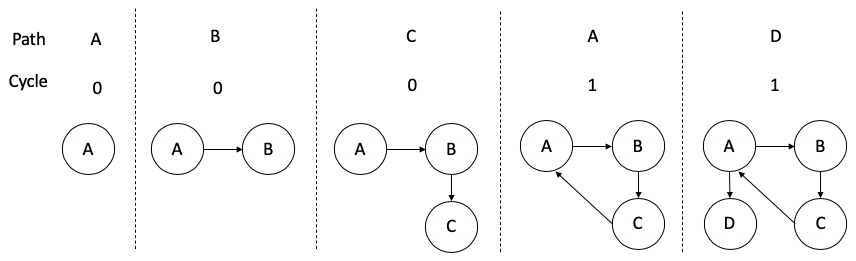
The third processing task is more involved. For each sequence of web pages in a single session, this task is to create a graph and calculate the graphic metrics, such as the number of simple cycles, at each step of the sequence. These graph metrics summarize the browsing patterns in a numerical way. For example, a customer visited site A → site C → site D → site A → site B. I represent this session sequence in a graph in Figure 1. Each node represents a site the customer visited during this session, and each directed edge represents the visiting direction. Figure 1 also labeled one of the graph metrics called “cycle”. This metric counts the number of simple cycles so far in the sequence. The simple cycle happened at the fourth step in the example, when the customer revisited site A, so the cycle is A to B to C to A.
第三项处理任务涉及更多。 对于单个会话中的每个网页序列,此任务是在该序列的每个步骤中创建一个图形并计算图形指标,例如简单循环数。 这些图形指标以数字方式总结了浏览模式。 例如,一个客户访问了站点A→站点C→站点D→站点A→站点B。我在图1的图中表示此会话序列。每个节点代表该会话期间客户访问的站点,每个有向边表示访问方向。 图1还标记了一种称为“周期”的图形指标。 该指标计算到目前为止序列中的简单循环数。 简单的周期发生在示例中的第四步,当客户再次访问站点A时,因此周期是从A到B到C到A。
原始数据是什么样的? (What does the raw data look like?)
I stored raw data in compressed CSV files in a S3 bucket named “s3://my_bucket/raw-data”. There are several million rows in total, stored into multiple S3 keys. Each row has five columns, including session ID, page URL, page title, the sequence of the page in the session, and all event actions on this page. The table below describes in details what these columns look like and it also gives an example of each column.
我将原始数据存储在名为“ s3:// my_bucket / raw-data”的S3存储桶中的压缩CSV文件中。 总共有几百万行,存储在多个S3键中。 每行有五列,包括会话ID,页面URL,页面标题,会话中页面的顺序以及此页面上的所有事件操作。 下表详细描述了这些列的外观,并给出了每个列的示例。
Since the data I have to process is over several million rows, PySpark is useful to speed up the processing tasks. I chose an AWS EMR cluster for executing PySpark, because it is optimized to be 3x faster than the standard Apache PySpark. EMR also has the added benefit of the AWS ecosystem, including direct access to S3 buckets that can make organizing your data much easier. AWS EMR jobs can be launched through either console, AWS CLI or AWS Python SDK, the Boto3 Python library. I usually prefer launching jobs through Boto3, because this is the easiest way to automate a job pipeline. Boto3 has detailed documentations on EMR client, including methods to launch jobs and terminate jobs. The overall steps to launch EMR jobs via Boto3 are in the following sections.
由于我必须处理的数据超过几百万行,因此PySpark对于加快处理任务很有用。 我选择了一个AWS EMR集群来执行PySpark,因为它的优化速度比标准Apache PySpark快3倍。 EMR还具有AWS生态系统的额外好处,包括直接访问S3存储桶,可以使组织数据变得更加容易。 可以通过控制台,AWS CLI或AWS Python SDK( Boto3 Python库)启动AWS EMR作业。 我通常更喜欢通过Boto3启动作业,因为这是自动化作业流程的最简单方法。 Boto3具有有关EMR客户端的详细文档,包括启动作业和终止作业的方法。 以下各节介绍了通过Boto3启动EMR作业的总体步骤。
步骤1.在自包含文件夹中模块化PySpark代码 (Step 1. Modularize PySpark code in a self-contained folder)
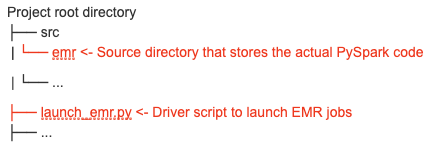
Each EMR job uses the PySpark code stored in a specific S3 bucket to process data. I have to upload my PySpark code in the project root folder to my project S3 bucket in order for this process to happen. My common practice is to modularize all PySpark related scripts in a self-contained folder named `src/emr` directory under my project root directory. Figure 2 shows my typical project structure. By separating my launch script from my PySpark script, I can automate the S3 upload easily without effecting the rest of my code in the project directory. File upload is handled through Boto3 upload_file method.
每个EMR作业都使用存储在特定S3存储桶中的PySpark代码来处理数据。 我必须将项目根文件夹中的PySpark代码上载到我的项目S3存储桶中,以便此过程能够发生。 我的常规做法是将所有PySpark相关的脚本模块化在我的项目根目录下一个名为`src / emr`的自包含文件夹中。 图2显示了我的典型项目结构。 通过将启动脚本与PySpark脚本分离,我可以轻松地自动执行S3上传操作,而不会影响项目目录中的其余代码。 文件上传通过Boto3 upload_file方法处理。
Version 5.29.0 of EMR supports Python version 3.4. My PySpark code usually requires additional python libraries to install on worker nodes. To install additional libraries, I add a `requirements.sh` file in my `src/emr` folder and upload along with other PySpark scripts to the aforementioned S3 bucket. This `requirements.sh` file is for bootstrap installation of additional Python modules used by the PySpark code. In the example described in this blog post, the `requirement.sh` looks like the following in Figure 3.
EMR的5.29.0版支持Python 3.4版。 我的PySpark代码通常需要其他python库才能安装在工作程序节点上。 要安装其他库,我在`src / emr`文件夹中添加一个`requirements.sh`文件,并将其与其他PySpark脚本一起上传到上述S3存储桶中。 这个`requirements.sh`文件是用于PySpark代码使用的其他Python模块的引导安装。 在此博客文章中描述的示例中,`requirement.sh`看起来如图3所示。
#!/bin/bash -xe


sudo easy_install-3.6 pip
# Python modules:
sudo /usr/local/bin/pip3 install  \
  numpy            \
  scipy            \
  statsmodels      \
  matplotlib       \
  boto3            \
  argparse         \
  networkx
The shell script first installs pip and then uses pip to install all Python libraries I need to the worker node for this project.
Shell脚本首先安装pip,然后使用pip将我需要的所有Python库安装到该项目的worker节点。
步骤2.设置工作启动环境并编写工作启动代码 (Step 2. Set up job launch environment and compose job launch code)
Boto3 provides comprehensive documentation on the job launch method. The procedure is to first create an EMR service client through boto3 Session object:
Boto3提供了有关作业启动方法的全面文档。 该过程是首先通过boto3 Session对象创建一个EMR服务客户端:
emr_client = boto3.session.Session(aws_access_key_id="your access key", aws_secret_access_key="your secrete key",
                                   region_name="your region").client("emr")
AWS access key ID and AWS secret access key can be created through AWS IAM. I followed the procedures outlines in AWS documentation to obtain them. I recommend not writing these keys in the code directly, so that they are not accidentally revealed through code commit. One practice I follow is to store my keys in a local, password protected file and access them through file read or environmental variables. In the above code, I also need to provide my region, for example, “us-east-1”.
可以通过AWS IAM创建AWS访问密钥ID和AWS秘密访问密钥。 我遵循了AWS文档中的过程概述来获取它们。 我建议不要直接在代码中编写这些键,以免被代码提交意外地泄露出来。 我遵循的一种做法是将密钥存储在受密码保护的本地文件中,并通过读取文件或环境变量来访问它们。 在上面的代码中,我还需要提供我的区域,例如“ us-east-1”。
The second part of the driver script is to create job flow through the client:
驱动程序脚本的第二部分是通过客户端创建作业流:
cluster_id = emr_client.run_job_flow(...)The code above kicks off an EMR job. I have omitted the parameters with “…”. Boto3 documentation lists all possible parameters. I will mention three parameters in this blog post. The first one `Instance=` describes the Amazon EC2 instances of the job flow. It takes a dictionary and one of the keys for the dictionary is “InstanceGroups”. It defines details about the instance groups in a cluster. Figure 4 displays an example.
上面的代码启动了EMR作业。 我用“…”省略了参数。 Boto3文档列出了所有可能的参数。 我将在此博客文章中提及三个参数。 第一个“ Instance =”描述了作业流程的Amazon EC2实例。 它需要一个字典,字典的键之一是“ InstanceGroups”。 它定义有关集群中实例组的详细信息。 图4显示了一个示例。
"InstanceGroups": [
	{
		"Name": "Master nodes",
        	"Market": "ON_DEMAND",
        	"InstanceRole": "MASTER",
        	"InstanceType": "m4.2xlarge",
        	"InstanceCount": 1,
    	},
    	{
		"Name": "Worker nodes",
        	"Market": "ON_DEMAND",
        	"InstanceRole": "CORE",
        	"InstanceType": "m4.2xlarge",
        	"InstanceCount": 16,
    	},
],
The second parameter I want to mention is “Steps=”. It is a list of StepConfig to be executed by the job flow. Figure 5 shows an example. In this example, “Args” in “HadoopJarStep” is where I specify the spark submit command line in a list format. The example submit is equivalent to “spark-submit — deploy-mode cluster s3://my_bucket/src/process_data.py”, where the S3 key “s3://my_bucket/src/process_data.py” contains the PySpark code I uploaded in step 1.
我要提及的第二个参数是“ Steps =”。 它是作业流程要执行的StepConfig的列表。 图5显示了一个示例。 在此示例中,我以“列表格式”指定“ spark提交”命令行中的“ HadoopJarStep”中的“ Args”。 示例提交等同于“ spark-submit-部署模式群集s3://my_bucket/src/process_data.py”,其中S3键“ s3://my_bucket/src/process_data.py”包含PySpark代码I在步骤1中上传。
Steps=[
    {
        "Name": "run_spark",
        "ActionOnFailure": "TERMINATE_CLUSTER",
        "HadoopJarStep": {
            "Properties": [{"Key": "string", "Value": "string"}],
            "Jar": "command-runner.jar",
            "MainClass": "",
            "Args": ["spark-submit", "--deploy-mode", "cluster", "s3://my_bucket/src/process_data.py"],
        },
    }
],
The third parameter is “BootstrapActions=”. This parameter specifies the location of “requirement.sh” script from Step 1 to install all necessary libraries. Figure 6 displays an example. In this example, the `requirement.sh` file is first uploaded to a S3 bucket named “my_bucket” with a prefix “src” and then during the job launch, `requirement.sh` file executes first and installs all necessary libraries shown in Figure 3.
第三个参数是“ BootstrapActions =”。 此参数指定步骤1中“ requirement.sh”脚本的位置,以安装所有必需的库。 图6显示了一个示例。 在此示例中,`requirement.sh`文件首先被上载到名为“ my_bucket”的带有前缀“ src”的S3存储桶,然后在作业启动期间,`requirement.sh`文件首先执行并安装如图所示的所有必需的库。图3。
BootstrapActions=[
    {
        "Name": "install_libraries",
        "ScriptBootstrapAction": {"Path": "s3://my_bucket/src/requirement.sh"},
    }
],
After the EMR client performs `run_job_flow` (reproduced in Line 1 of Figure 7), cluster ID can be obtained by get(“JobFlowId”). In Line 2, I use this cluster ID to find the pending step in the cluster. This pending step is the PySpark code I just submitted. Line 4 returns the status of the job and Line 5 to Line 9 force the command window to wait before the submitted job is completed if the status is not terminated. The wait is often necessary in an automated data pipeline so that the next step in the pipeline can only execute after the data processing step completes. The last line terminates the cluster. Once the script is launched, an EMR job is created and accessible in the AWS EMR console.
在EMR客户端执行“ run_job_flow”(在图7的第1行中复制)之后,可以通过get(“ JobFlowId”)获得群集ID。 在第2行中,我使用此集群ID在集群中查找挂起的步骤。 这个未完成的步骤是我刚提交的PySpark代码。 第4行返回作业的状态,第5行到第9行强制命令窗口等待提交的作业完成(如果状态未终止)。 通常在自动数据管道中需要等待,以便只有在数据处理步骤完成后才能执行管道中的下一步。 最后一行终止集群。 启动脚本后,将创建一个EMR作业,并可在AWS EMR控制台中对其进行访问。
cluster_id = emr_client.run_job_flow(...).get("JobFlowId")
step_id = emr_client.list_steps(ClusterId=cluster_id, StepStates=["PENDING"]).get("Steps")[0].get("Id")

step_status = emr_client.describe_step(ClusterId=cluster_id, StepId=step_id).get("Step").get("Status")
if (step_status.get("State") == "TERMINATED_WITH_ERRORS") | (step_status.get("State") == "TERMINATED"):
    raise RuntimeError(step_status.get("StateChangeReason").get("Code"))
else:
    waiter = emr_client.get_waiter("step_complete")
    waiter.waiter(ClusterID=cluster_id, StepId=step_id, WaiterConfig={"Delay": 300, "MaxAttempts": 40}

emr_client.terminate_job_flows(JobFlowIds=[cluster_id])示例PySpark代码(Example PySpark code)
In the previous section, I showed the process of submitting a PySpark job to EMR. One thing I omitted is the PySpark code itself. In Figure 5 from the previous section, the PySpark code is the script at the location “s3://my_bucket/src/process_data.py”. In this section, I am going to walk through the three processing tasks in this script: 1) three query features, 2) event actions, and 3) graph metrics. The entire processing procedure is done with PySpark DataFrames.
在上一节中,我展示了向EMR提交PySpark作业的过程。 我忽略的一件事是PySpark代码本身。 在上一节的图5中,PySpark代码是位于“ s3://my_bucket/src/process_data.py”位置的脚本。 在本节中,我将逐步完成此脚本中的三个处理任务:1)三个查询功能,2)事件操作和3)图形指标。 整个处理过程是通过PySpark DataFrames完成的。
PySpark数据框 (PySpark DataFrames)
PySpark DataFrames are introduced in Spark 1.6. The concept is analogous to Python’s Pandas DataFrame, but it provides the benefits of RDDs with its strong typing and lambda functions. PySpark DataFrames inherit Spark SQL’s optimized execution engine. They are conceptually equivalent to tables in a relational database, and they can be created from a wide array of sources such as structured data files, tables in Hive, external databases, or existing RDD. A DataFrame object is organized into named columns. In addition, a DataFrame shares characteristics with a RDD in that it is immutable in nature; its task is lazily evaluated; and it is distributed. As such, a DataFrame can handle petabytes of data.
PySpark DataFrames在Spark 1.6中引入。 该概念类似于Python的Pandas DataFrame,但它具有强大的键入和lambda函数,从而提供了RDD的优点。 PySpark DataFrames继承了Spark SQL的优化执行引擎。 从概念上讲,它们等效于关系数据库中的表,并且可以从大量来源中创建它们,例如结构化数据文件,Hive中的表,外部数据库或现有的RDD。 DataFrame对象被组织到命名列中。 另外,DataFrame与RDD具有相同的特性,因为它本质上是不可变的。 它的任务被懒惰地评估; 它是分布式的。 这样,DataFrame可以处理PB级的数据。
Spark会话设置和数据输入 (Spark session setup and data input)
from pyspark.sql import SparkSession, DataFrame

spark_session = SparkSession.builder.getOrCreate()
delete_data(s3_bucket_name="my_bucket", s3_prefix="processed-data")
input_dataframe = spark_session.read.csv("s3://my_bucket/raw-data", inferSchema=False, header=True, sep=",", schema=DATA_SCHEMA, encoding="UTF-8", multiLine=True, enforceSchema=False, mode="DROPMALFORMED")
I am using PySpark version 2.4.5. This version supports `SparkSession`, a part of a handy DataFrame APIs that supports issuing Spark SQL queries without explicitly creating a SparkContext or SQLContext . The session builder in Line 3 calls `getOrCreate()`. This call instantiates a SparkSession object if one does not already exist. The benefit of using this call, instead of creating SparkSession, is that we can only have one active SQLContext per JVM and this command is useful when Spark applications may wish to share a context. Line 4 is a method that I created to delete previously processed data if they exist. Figure 8 below defines this method. The method mainly uses Boto3’s list_objects and delete_object to delete all keys in a bucket. Line 5 creates an input PySpark DataFrame from compressed CSV files. The CSV files are read from “s3://my_bucket/raw-data”. The schema is not inferred but specified. The specified schema is in Figure 9.
我正在使用PySpark 2.4.5版本。 这个版本支持`SparkSession`,这是方便的DataFrame API的一部分,该API支持发出Spark SQL查询而无需显式创建SparkContext或SQLContext。 第3行中的会话构建器调用`getOrCreate()`。 如果尚不存在,则此调用实例化一个SparkSession对象。 使用此调用而不是创建SparkSession的好处是,每个JVM我们只能有一个活动SQLContext,当Spark应用程序可能希望共享上下文时,此命令很有用。 第4行是我创建的一种方法,用于删除先前处理过的数据(如果存在)。 下面的图8定义了此方法。 该方法主要使用Boto3的list_objects和delete_object删除存储桶中的所有键。 第5行从压缩的CSV文件创建输入PySpark DataFrame。 从“ s3:// my_bucket / raw-data”中读取CSV文件。 该架构不是推断的而是指定的。 指定的架构如图9所示。
def delete_data(s3_bucket_name, s3_prefix) -> None:
    """
    This method delete objects from a given buckets and prefix.

    :param s3_bucket_name: the name of the bucket to delete
    :type s3_bucket_name: str
    :param s3_prefix: the name of the bucket prefix the files to delete
    :type s3_prefix: str
    """
    # delete existing files
    s3 = boto3.client("s3")
    all_objects = s3.list_objects(Bucket=s3_bucket_name, Prefix=s3_prefix)
    if "Contents" in all_objects:
        for v in all_objects["Contents"]:
            s3.delete_object(Bucket=s3_bucket_name, Key=v["Key"])
from pyspark.sql.types import (
StringType,
StructType,
StructField,
)
DATA_SCHEMA = StructType(
[
StructField("UNIQUE_VISIT_ID", StringType(), True),
StructField("PAGE_PATH", StringType(), True),
StructField("PAGE_TITLE", StringType(), True),
StructField("EVENT_ACTIONS", StringType(), True),
StructField("PAGE_SEQUENCE", StringType(), True),
]
)处理任务1:URL功能(Processing task 1: URL features)
The goal for the processing task 1 is to extract three features from the URL: 1) whether the URL contains queries, 2) how many equal signs are in the query and 3) how many numbers are in the query. Figure 10 displays the `process_url` method that takes the original DataFrame, the spark session and the URL column name to output the three extracted features. Line 7 to Line 11 define and register a user defined function that extracts the three features. A user defined function turns a regular Python function into a DataFrame function. Line 9 specifies the return type of the function, which is an array of integers. Line 13 to Line 20 define the regular Python function for feature extraction. It first uses a URL parser to get the query part of the URL and then returns the three features by checking if the query exists, how many equal signs were found, and how many numbers were matched. In Line 23, `.withColumn` creates a column in the DataFrame called “all_features”, containing tuples of three features, via the user defined function. Line 24 caches the “all_features”, because DataFrame functions are lazily executed, any task failure would restart the calculation all over again for “all_features”. By caching the results before proceed, any restart would continue using the “all_features” already cached. Line 25 to Line 27 create a column for each feature.
处理任务1的目标是从URL中提取三个特征:1)URL是否包含查询; 2)查询中有多少个等号; 3)查询中的数目。 图10显示`process_url`方法,该方法采用原始DataFrame,spark会话和URL列名称来输出三个提取的功能。 第7行到第11行定义并注册了一个提取三个功能的用户定义函数。 用户定义的函数将常规的Python函数转换为DataFrame函数。 第9行指定函数的返回类型,它是整数数组。 第13至20行定义了用于特征提取的常规Python函数。 它首先使用URL解析器来获取URL的查询部分,然后通过检查查询是否存在,找到了多少个等号以及匹配了多少个数字来返回这三个功能。 在第23行中,`.withColumn`通过用户定义的函数在DataFrame中创建一个名为“ all_features”的列,其中包含三个要素的元组。 第24行缓存了“ all_features”,因为DataFrame函数是延迟执行的,所以任何任务失败都会重新为“ all_features”重新开始计算。 通过在继续进行之前缓存结果,任何重新启动将继续使用已缓存的“ all_features”。 第25行至第27行为每个功能创建一列。
from pyspark.sql.types import ArrayType, IntegerType
from urllib.parse import urlparse
import re


def process_url(dataframe, spark_session, url_column) -> DataFrame:


   create_features = udf(
       f=lambda url: create_query_based_featuers(url),
       returnType=ArrayType(elementType=IntegerType()),
   )
   spark_session.udf.register("create_features", create_features)


   def create_query_based_featuers(url):
       query = urlparse(url).query
       # check if there is a query in the string; count how many '='; count how many numbers
       return (
           int(bool(query)),
           len(re.findall("=", query)),
           len(re.findall("\d+", query)),
       )


   dataframe = (
       dataframe.withColumn("all_features", create_features(url_column))
       .cache()
       .withColumn("is_query", col("all_features").getItem(0))
       .withColumn("num_equals", col("all_features").getItem(1))
       .withColumn("num_numbers", col("all_features").getItem(2))
       .drop("all_features")
   )


return dataframe处理任务2:事件动作功能(Processing task 2: event action features)
Event actions are converted to boolean columns. For example, if the events “add to cart” and “remove from cart” happened on a page and no other events happened, then the boolean columns have ones for these two events and zeros for all other events. In Figure 11, Line 8 defines a list of all event action booleans. Line 9 uses the col object to specify the event column and Line 10 to match one of the event types in the event_actions. Line 11 gives the result the column name of “event_{event_type}”. Line 14 applies the matched columns to the DataFrame and return the results. For example, if the customer added a product to the cart on this page but then subsequently removed it, then there are two events `add_to_cart` and `remove_from_cart`. Suppose no other events happened on this page, then the method could create five columns for which only event_add_to_cart and event_remove_from_cart have ones and all other columns have zeros.
事件操作将转换为布尔列。 例如,如果某个事件“添加到购物车”和“从购物车中删除”事件发生在页面上,而没有其他事件发生,则布尔值列中的这两个事件为1,其他所有事件为零。 在图11中,第8行定义了所有事件操作布尔值的列表。 第9行使用col对象指定事件列,第10行使用event_actions中的事件类型之一进行匹配。 第11行的结果列名称为“ event_ {event_type}”。 第14行将匹配的列应用于DataFrame并返回结果。 例如,如果客户在此页面上将产品添加到购物车,但随后又将其删除,则将发生两个事件“ add_to_cart”和“ remove_from_cart”。 假设此页面上没有其他事件发生,则该方法可以创建五列,其中event_add_to_cart和event_remove_from_cart只有一列,其他所有列都为零。
from pyspark.sql.functions import col


def add_event_action_features(
   dataframe,
   event_action_col,
   event_actions,
   ) -> DataFrame:
   match_cols = [
       col(event_action_col)
       .rlike(event_type)
       .alias(f"event_{event_type}")
       for event_type in event_actions.keys()
   ]
return dataframe.select(col("*"), *match_cols)处理任务3:图形特征(Processing task 3: Graph features)
The graph features is the most complicated processing task out of all three tasks. It consists of two parts. The first part is to create Python functions that convert a page visiting sequence into graphs and calculate graph metrics. And the second part is to convert and apply these functions to a PySpark DataFrame.
图形特征是所有三个任务中最复杂的处理任务。 它由两部分组成。 第一部分是创建Python函数,该函数将页面访问序列转换为图形并计算图形度量。 第二部分是将这些功能转换并应用于PySpark DataFrame。
Part I. Convert a page visiting sequence into graphs and calculate graph metricsThe `create_graph_for_each_step` method in Figure 12, constructs a directed graph for each step in a sequence. For example, if the page sequence is [“page1”, “page2”, “page3”], then the method creates a graph for “page1”, “page1” -> “page2”, and “page1” -> “page2” -> “page3”. For each graph, the method then uses `calculate_graph_measures` to get a dictionary of graph metrics. To construct a directed graph in `build_digraph` method on line 26, I used Python networkx library.
第一部分:将页面访问序列转换为图形并计算图形指标图12中的create_graph_for_each_step方法为序列中的每个步骤构造一个有向图。 例如,如果页面顺序为[“ page1”,“ page2”,“ page3”],则该方法将为“ page1”,“ page1”->“ page2”和“ page1”->“ page2”创建图形”->“第3页”。 然后,对于每个图形,该方法使用“ calculate_graph_measures”来获取图形指标的字典。 为了在第26行的`build_digraph`方法中构造一个有向图,我使用了Python networkx库。
from networkx import nx

def create_graph_for_each_step(list_of_pages) -> list:
   """
   This methods takes a list of pages and calculate graph measures for each step of the list.  For example, if the list
   of pages is
       ["page1", "page2", "page3"]
   then this list represents the steps of this session "page1" -> "page2" -> "page3".  This method calculate a
   graph measure dictionary for each step, i.e. the graph for the first step is "page1"; the second step, "page1" ->
   "page2" and so on.

   :param list_of_pages: a list of page names indicates the sequence of visits.
   :type list_of_pages: list
   :return: a list of dictionaries.  Each dictionary contains the graph measures for a step.
   :rtype: list
   """
   list_of_dicts = []
   for visit_step in range(len(list_of_pages)):
       # the list of all the pages before this step
       current_step_list = list_of_pages[0 : visit_step + 1]
       graph = build_digraph(current_step_list)
       list_of_dicts.append(calculate_graph_measures(graph))


   return list_of_dicts


def build_digraph(list_of_pages) -> nx.DiGraph:
   """
   This method takes an ordered list of page names and creates a directed graph object.  The list is the sequence of
   pages a customer visited.  For example: ["page1", "page2", "page3"].  The method returns a graph object with the
   edges:
       [("page1", "page2"), ("page2", "page3")]

   :param list_of_pages: a list of page names
   :type list_of_pages: list(str)
   :return: a directed graph object created from the list of pages
   :rtype: nx.DiGraph
   """
   graph = nx.DiGraph()
   if not list_of_pages:
       return graph


   # add the only node if there is only 1 page in the list
   graph.add_node(list_of_pages[0]) if len(list_of_pages) == 1 else None
   if len(list_of_pages) > 1:
       pair_list = [(head, tail) for head, tail in zip(list_of_pages, list_of_pages[1:])]
       graph.add_edges_from(pair_list)


   return graph
Figure 13 displays `calculate_graph_measures` method. I originally calculated thirteen different graph metrics. However, for the sake of brevity, I only listed “simple cycles” calculation here. The interested readers can look at the paper by Baumann A. et al. for the other metrics.
图13显示了calculate_graph_measures方法。 我最初计算了十三种不同的图形指标。 但是,为了简洁起见,我仅在此处列出“简单周期”计算。 有兴趣的读者可以阅读Baumann A.等人的论文。 其他指标。
def calculate_graph_measures(a_graph) -> dict:
    """
    This method takes a graph object and calculate graph measures to store in a dictionary.  The graph measures are
    summarized in
        Baumann, Annika, et al. "Changing perspectives: Using graph metrics to predict purchase probabilities."
        Expert Systems with Applications 94 (2018): 137-148.

    :param a_graph: a directed graph object
    :type a_graph: nx.DiGraph
    :return: a dictionary containing 13 graph measures
    :rtype: dict
    """
    list_name_graph_func = [
        ("simple_cycles", lambda graph: len(list(simple_cycles(graph)))),
        ...
    ]
    # check if the measures agree with the pre-defined configuration
    assert set([name_func[0] for name_func in list_name_graph_func]) == GRAPH_MEASURE_SET
    graph_measure_dict = dict()
    for measure_name, func in list_name_graph_func:
        try:
            value = float(func(a_graph))
            graph_measure_dict[measure_name] = value if not isnan(value) else float(0.0)
        except Exception:
            graph_measure_dict[measure_name] = float(0.0)


    return graph_measure_dict
Part II Convert and apply graph metrics to a PySpark DataFrame
第二部分转换图形度量并将其应用于PySpark DataFrame
In the original input DataFrame, each page is a row. I need to apply the graph methods in Part I to a session, instead of a page, so I need to aggregate all pages belonging to the same session in the DataFrame into one row. For example, if the original DataFrame looks like this:
在原始输入DataFrame中,每个页面都是一行。 我需要将第I部分中的graph方法应用于会话,而不是页面,因此我需要将DataFrame中属于同一会话的所有页面聚合到一行。 例如,如果原始DataFrame如下所示:
session id      page sequence       page name
           1               1                   a
           1               2                   b
I need to convert it into this:
我需要将其转换为:
session id      page name
           1              [a, b]
I accomplish this by the method `create_session_based_sequence` defined in Figure 14. Line 14 and 15 demonstrate how to use SQL-like command in DataFrame. In Line 14, the DataFrame selects the columns of session ID, sequence and page name. Line 15 groups the rows by session ID and Line 16 aggregates rows with the same session ID into a list of (sequence, page name)-tuples and stores the list into a column called “seq_and_page_name_tuple”. The method then invokes `create_sort_by_first_udf` method also shown in Figure 14 to sort the tuples in the list by sequence numbers from the lowest to the highest and return the page name. This step orders the page name in the correct visit sequence in the session.
我通过图14中定义的`create_session_based_sequence`方法完成此操作。第14和15行演示了如何在DataFrame中使用类似SQL的命令。 在第14行中,DataFrame选择会话ID,序列和页面名称的列。 第15行按会话ID对行进行分组,第16行将具有相同会话ID的行聚合到(序列,页面名称)元组列表中,并将该列表存储到称为“ seq_and_page_name_tuple”的列中。 然后该方法调用图14中所示的create_sort_by_first_udf方法,以按从最低到最高的顺序号对列表中的元组进行排序,并返回页面名称。 此步骤按会话中正确的访问顺序对页面名称进行排序。
from pyspark.sql.functions import collect_list


def create_session_based_sequence(
   dataframe,
   spark_session,
   session_id_col,
   seq_col,
   page_name,
   output_col,
   ) -> DataFrame:
   # aggregate the dataframe to create a list for every session, containing (page sequence, page id) pairs for that
   # session
   session_dataframe = (
       dataframe.select([session_id_col] + [seq_col, page_name])
       .groupBy(session_id_col)
       .agg(collect_list(struct(seq_col, page_name)).alias("seq_and_page_name_tuple"))
   )


   # sort the list by page sequence column and output the page_id
   sort_by_first_udf = create_sort_by_first_udf(spark_session=spark_session)
   return session_dataframe.select(
       col(session_id_col),
       sort_by_first_udf("seq_and_page_name_tuple").alias(output_col),
   )


def create_sort_by_first_udf(spark_session) -> udf:
   """
   This method create a user-define function that sorts a tuples according to the first element of the tuple,
   return a list containing the second element.  For example, if the list of tuples is:
       [(3, 'a'), (2, 'b'), (1, 'c')]
   The udf would return
       ['c', 'b', 'a']
   This is because the order of the first index is 1, 2, 3

   :param spark_session: the current spark session
   :type spark_session: SparkSession
   :return: the sort_by_first udf
   :rtype: udf
   """


   def sort_by_first(a_tuple):
       sorted_tuple = sorted(a_tuple, key=operator.itemgetter(0))
       return [item[1] for item in sorted_tuple]


   sort_by_first_udf = udf(
       f=sort_by_first, returnType=ArrayType(elementType=StringType())
   )
   spark_session.udf.register("sort_by_first_udf", sort_by_first_udf)
   return sort_by_first_udf
Finally in Figure 15, the graph measures are calculated for the DataFrame.
最后在图15中,为DataFrame计算了图形度量。
def calculate_graph_measure(
    page_list_dataframe,
    spark_session,
    id_col=SESSION_ID_COL,
    page_list_col=PAGE_LIST_COL,
    page_seq_col=PAGE_SEQ_COL,
    ) -> DataFrame:
    """
    This method takes the page list dataframe in the format shown below and create 13 graph measures (for example, the
    number of self-loops) for each step of the session.  For example, in the page list dataframe below:
            session id      page id
            1              ['page1', 'page2']
    the method would create 13 graph measures for 'page1' then for 'page1' and 'page2'.  The output is in the format:
            session id      page sequence   graph measure 1     graph measure 2     ...     graph measure 13
            1               1               ...
            1               2               ...

   :param page_list_dataframe: a page list dataframe, in the fomrat
        session id      page id
        1              ['page1', 'page2']
    :type page_list_dataframe: DataFrame
    :param spark_session: a spark session
    :type spark_session: SparkSession
    :param id_col: the name of the column with session ID. Defaults to SESSION_ID_COL
    :type id_col: str
    :param page_list_col: the name of the column that contains the list of pages. Defaults to PAGE_LIST_COL
    :type page_list_col: str
    :param page_seq_col: the name of the new column that indicates the sequence of this page in this session.
        Defaults to PAGE_SEQ_COL
    :type page_seq_col: str
    :return: a dataframe breaks down into each page sequence and calculate the graph measures for each page
    :rtype: DataFrame
    """
    create_graph_measure_udf = udf(
        f=create_graph_for_each_step,
        returnType=ArrayType(elementType=MapType(StringType(), DoubleType())),
    )
    add_one_udf = udf(f=lambda pos: pos + 1, returnType=IntegerType())
    spark_session.udf.register("create_graph_measure_udf", create_graph_measure_udf)
    spark_session.udf.register("add_one_udf", add_one_udf)


    # 1) create graph measure for each step of the session 2) then create one row per step (posexplode), for example,
    #       graph measures
    #       [{dict1},  {dict2}]
    #   becomes
    #       pos     col
    #        0      {dict1}
    #        1      {dict2}
    # 3) adjust the position column starting at 1, instead of 0 and rename the column with a pre-specified page
    # sequence column name
    # page_list_dataframe.show(truncate=False)
    output_dataframe = (
        page_list_dataframe.withColumn(
            "graph_measures", create_graph_measure_udf(page_list_col)
        )
        .select(id_col, posexplode("graph_measures"))
        .withColumn(page_seq_col, add_one_udf("pos"))
        .drop("pos")
    )


    # convert the dictionary in 'graph measures' column into multiple other columns, one key per column.  For example,
    #   page sequence       graph measures
    #       1                   {'key1': "value1", 'key2': "value2"}
    # becomes
    #   page sequence       key1        key2
    #       1               value1      value2
    measure_cols = [
        col("col").getItem(measure_name).alias(measure_name)
        for measure_name in GRAPH_MEASURE_SET
    ] + [col(id_col), col(page_seq_col)]
    output_dataframe = output_dataframe.select(*measure_cols).drop("col")
    return output_dataframe
准备在AWS EMR上尝试PySpark吗?(Ready to try PySpark on AWS EMR?)
Running PySpark on AWS EMR costs less than half of the cost for traditional on-premises solutions and over 3 times faster than the standard Apache Spark. In this blog post, I shared with you one of my data processing examples using PySpark’s DataFrame. If you want to use AWS EMR in your project, Amazon EMR FAQs is a good place to start. Follow the information and tips in this post to add another tool in your data processing toolbox today.
在AWS EMR上运行PySpark的成本不到传统本地解决方案成本的一半,比标准Apache Spark快3倍以上。 在此博客文章中,我与您分享了使用PySpark的DataFrame进行数据处理的示例之一。 如果您想在项目中使用AWS EMR,那么Amazon EMR常见问题解答是一个不错的起点。 请按照本文中的信息和提示,在您的数据处理工具箱中添加另一个工具。
严扬 (by Yan Yang)
Data Scientist@ Chewy
数据科学家@耐嚼
If you have any questions about careers at Chewy, please visit https://www.chewy.com/jobs
如果您对Chewy的职业有任何疑问,请访问https://www.chewy.com/jobs
aws emr 大数据分析


 7514
7514

 被折叠的 条评论
为什么被折叠?
被折叠的 条评论
为什么被折叠?
 到【灌水乐园】发言


