


程式设计(Programming)
Disclaim The sole purpose of this post is to show data manipulation skills in R; it shall not serve as an investment recommendation or endorsement of any sort. Investment comes with risk!
免责声明这篇文章的唯一目的是展示R中的数据操作技巧; 不得作为任何投资建议或认可。 投资带来风险!
Finally, sports are back!
终于,运动又回来了!
So as online betting sites like DraftKings. Placing aside a few bucks with friends while watching your favorite players winning the game is the way to go!
像DraftKings这样的在线博彩网站。 观看比赛您最喜欢的玩家时,与朋友们一起花几块钱是必经之路!
My lineup strategy is to analyze players’ recent performance and pick the one with hot hands to place a bet. However, it is impossible to just select the hottest players, like LeBron James, Anthony Davis, Nikola Jokic, etc., who come with high salaries. As a restriction, DraftKings has a $50,000 salary cap. It won’t be a winning lineup strategy if you pick three top players and stuff the rest with bench players with no low salaries but no playtime.
我的阵容策略是分析球员的最近表现,并用双手热选一个下注。 但是,不可能只选择薪水高的最热门球员,例如勒布朗·詹姆斯,安东尼·戴维斯,尼古拉·乔基奇等。 作为限制, DraftKings的工资上限为50,000美元。 如果您选择三名顶级球员,而其余球员则换成低薪但没有上场时间的替补球员,那将不是一个成功的阵容策略。
To find the players with hot hands and reasonable salaries, I find the dplyr library in R handy. In this post, we learn a few tricks of data analysis and lineup buildup.
为了找到热手和合理薪水的球员,我在R handy中找到了dplyr库。 在本文中,我们学习了一些数据分析和阵容构建的技巧。
The recommended way of learning programming is via practicing!
推荐的编程学习方法是通过练习!
The fun way of coding is to make a few bucks out of it!
编码的有趣方法是从中赚钱!

Lets’ get started. We are going to come up with a lineup for Game 2 after analyzing players’ performance on September 18 between LA Lakers VS Denver Nuggets and cross-check with the actual performance on September 20.
让我们开始吧。 在分析了9月18日洛杉矶湖人队对丹佛掘金队之间的球员表现并交叉核对了9月20日的实际表现之后,我们将提出第2场比赛的阵容。
数据集 (Datasets)
There are two datasets: Basic_Infor_Game_1 and Actual_point_Game_1). I’d strongly recommend downloading these two datasets and replicate the code as we go on.
有两个数据集: Basic_Infor_Game_1和Actual_point_Game_1 )。 我强烈建议下载这两个数据集并在继续进行时复制代码。
#1 data preparation # load the dataset 1
Basic_Infor_Game_1 <- read.csv('Basic_Infor_Game_1.csv')# load the dataset 2
Actual_point_Game_1 <- read.csv('Actual_point_Game_1.csv')# merge the two datasets according to players' names
game_one_9.18 <- merge(Basic_Infor_Game_1,Actual_point_Game_1,by.x= 'Name', by.y ="Player")head(game_one_9.18)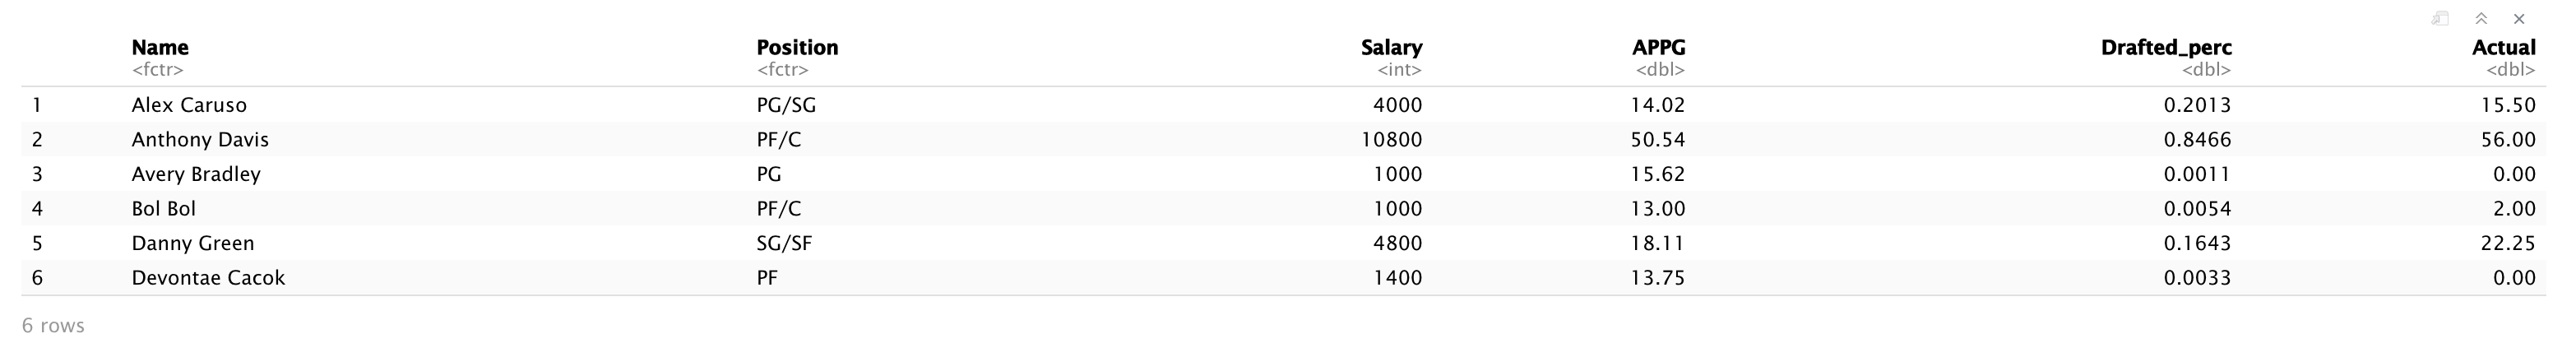
Notes
笔记
Name: players’ names Position: what position they playSalary: the salary assigned to the playerAPPG: average points per game Drafted_perc: the percentage of users drafted this playerActual: the actual points scored for Game 1As you can see above, there are too many reductant variables that we don’t need. To begin with, we can only select the key variables.
如您在上面看到的,我们不需要太多的还原变量。 首先,我们只能选择关键变量。
#2 load the library: dplyr
library(dplyr)merged_9.18 %>%
  select(Name, APPG, Actual)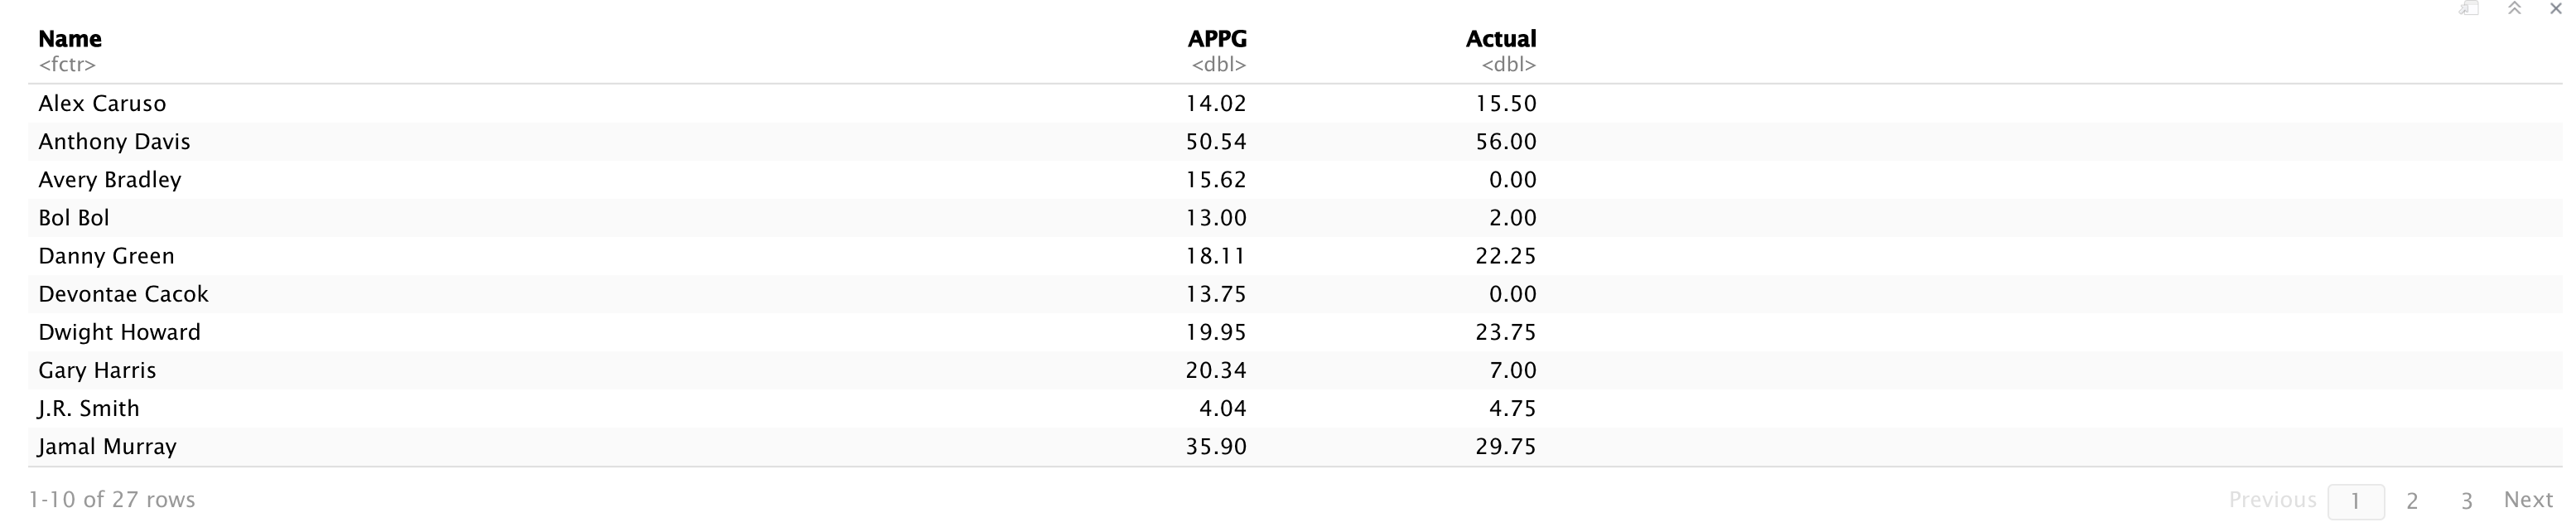
Much better and cleaner!
更好,更清洁!
Better players score more with higher salaries. The question is how to evaluate their performance vis-a-vis their salaries? In other words, do top players offer the same point-to-salary value as the bench players?
更好的球员得分更高,薪水更高。 问题是如何评估他们的薪水表现? 换句话说,顶尖球员是否提供与替补球员相同的薪水价值?
To answer these questions, we create a new variable called actual_predicted_ratio, calculated by the division between the actual points scored (Actual) and the average points predicted (APPG). This ratio is a good indicator of players’ delivery or deviation from the average performance.
为了回答这些问题,我们创建了一个称为Actual_predicted_ratio的新变量,该变量是通过对实际得分( Actual )和预测的平均得分( APPG )进行除法计算得出的。 这个比率是球员表现或偏离平均表现的良好指标。
Rearrange the outcomes in a descending manner and only show the first 10 cases.
以降序方式重新排列结果,仅显示前10例。
merged_9.18 %>%
  select(Name, APPG, Actual) %>%
  mutate(actual_predicted_ratio = Actual/APPG) %>%
  arrange(desc(actual_predicted_ratio)) %>%
  head(10)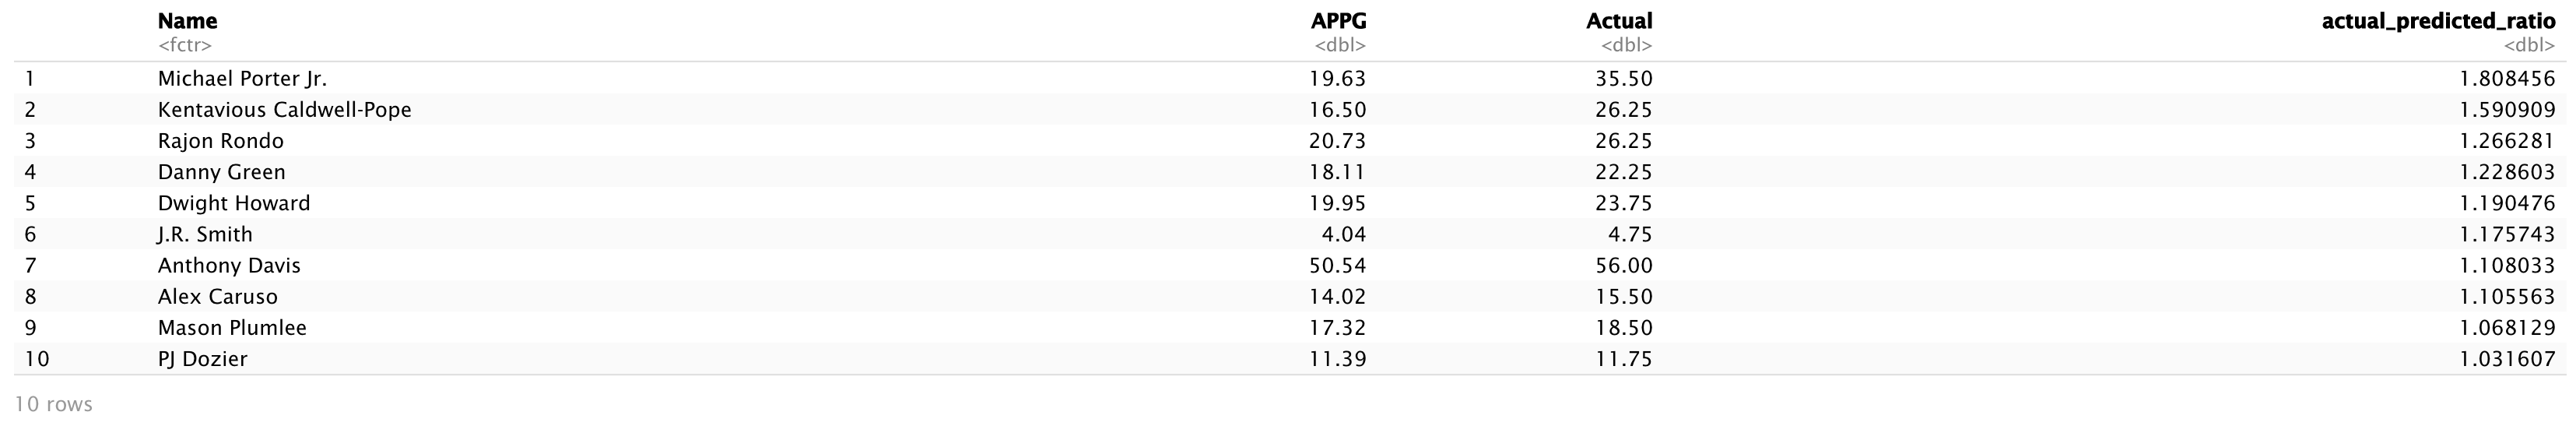
The last column, actual_predicted_ratio, is ranked in descending order. On the top, Michael Porter is the player with the highest point ratio of 1.808456, which means MP scored almost 1.8 times more than his average point per game.
最后一列Actual_predicted_ratio降序排列。 最重要的是,迈克尔·波特(Michael Porter)是最高得分比为1.808456的球员,这意味着MP得分比他每场比赛的平均得分高出近1.8倍。
Bravo!
太棒了!
Kentavious Caldwell-Pope and Rajon Rondo are the second and third, respectively.
Kentavious的Caldwell-Pope和Rajon Rondo分别排名第二和第三。
However, this is not super helpful since DraftKings only allow 6 players for their showtime games. If we pick the top 6 players according to the actual_predicted_ratio, we won’t be able to draft players like Anthony Davis, Lebron James.
但是,这并不是超级有帮助,因为DraftKings仅允许6位玩家参加比赛。 如果我们根据actual_predicted_ratio选出前6名球员,我们将无法选拔Anthony Davis,Lebron James等球员。
We rank players according to their scores and pick the top 10 players in Game 1.
我们根据得分对玩家进行排名,并在第1场比赛中挑选前10名玩家。
## Top 10 players who scored the most
top_10_scored_players <- game_one_9.18 %>%
  select(Name,Salary, APPG, Actual) %>%
  arrange(desc(Actual)) %>%
  head(10)
top_10_scored_players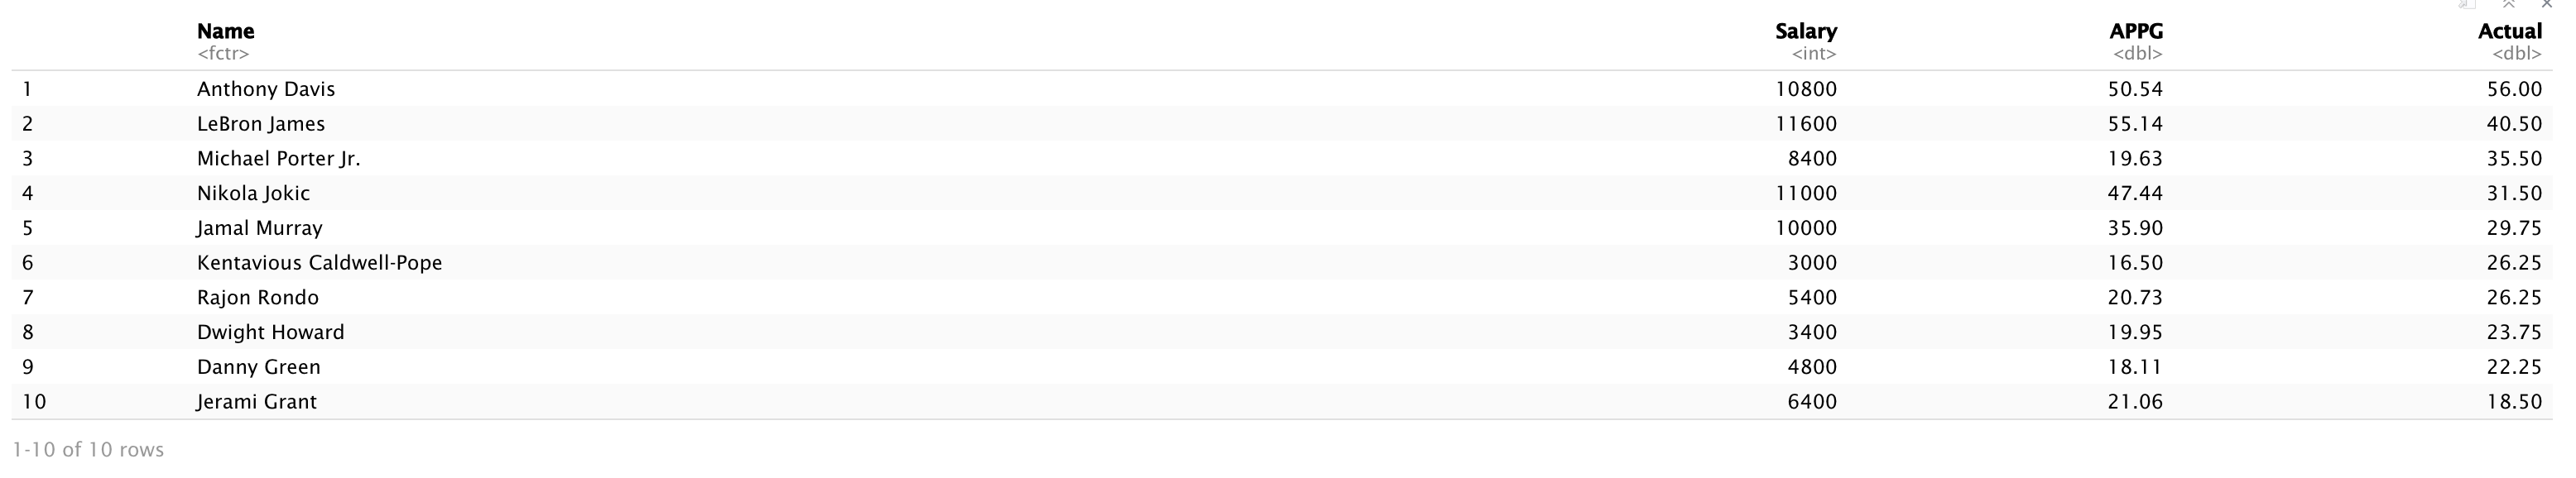
Anthony Davis and Lebron James top the list!
安东尼·戴维斯和勒布朗·詹姆斯位居榜首!
Similarly, I’m wondering who are the most drafted players.
同样,我想知道谁是最受选拔的球员。
## Top 10 most drafted players
game_one_9.18 %>%
  select(Name,Salary, APPG, Drafted_perc) %>%
  arrange(desc(Drafted_perc)) %>%
  head(10)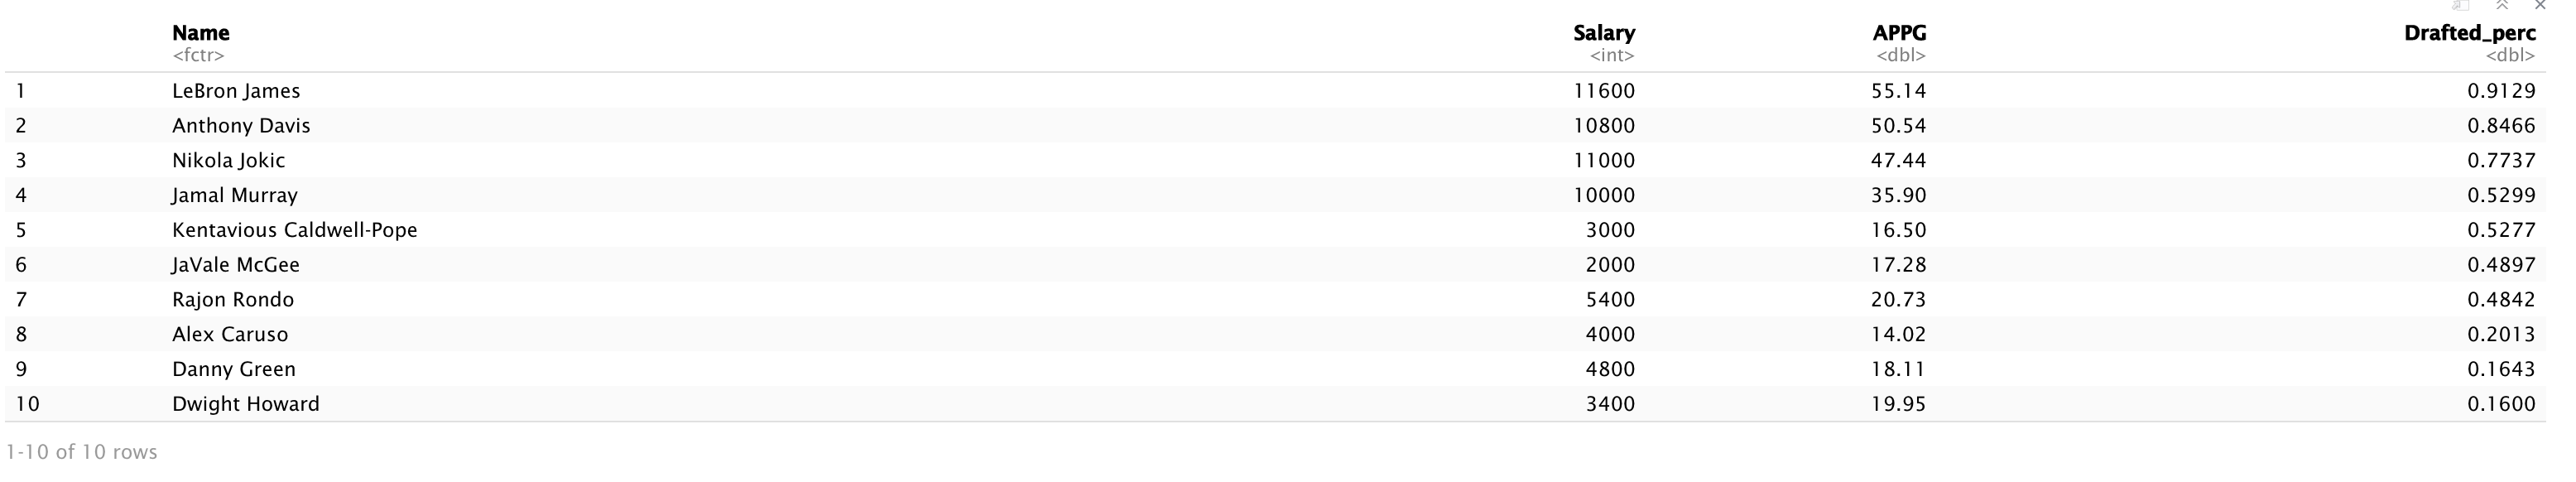
High-flying players have higher salaries, restraining the number of top players we can have in the lineups. So, we can choose players in each salary range using filter.
表现出色的球员的薪水更高,限制了我们在阵容中可以拥有的顶级球员的数量。 因此,我们可以使用filter选择每个薪水范围内的球员。
I define top players as those who have $8,000 or above salaries and still beat expectations.
我将顶级球员定义为薪水为8,000美元或以上但仍超过预期的人。
## Top players with high salary cap (>=8k) and still beat expectation game_one_9.18 %>%
  select(Name,Salary, APPG, Actual, Drafted_perc) %>%
  mutate(actual_predicted_ratio = Actual/APPG) %>%
  filter(actual_predicted_ratio>=1 & Salary>=8000) %>%
  arrange(desc(actual_predicted_ratio))
Only Michael Porter and Anthony Davis have such performance in Game 1. In particular, Davis has a high salary of $10800 and still be able to beat the expectation with 1.1 times more than the average points scored. It shows his excellent performance that makes him a definite pick.
在第一场比赛中,只有迈克尔·波特和安东尼·戴维斯有这种表现。特别是,戴维斯的年薪为10800美元,仍然可以超过平均得分1.1倍的期望值。 它显示了他的出色表现,使他成为确定的选秀权。
Though Porter has a significant outperformance, he scored most of his points in the last quarter with a lot of junk time. Data tells you he may be a suspicious pick if the game is tight.
尽管波特表现出色,但他在上个季度的大部分时间里都浪费了很多时间得分。 数据告诉您,如果比赛紧张,他可能是一个可疑的选择。
For our value plays, let’s check players within the $3,000 to $8,000 range.
对于我们的价值游戏,让我们检查一下$ 3,000到$ 8,000之间的玩家。
## Good value players (3k-8k) and still beat expectationgame_one_9.18 %>%
  select(Name,Salary, APPG, Actual, Drafted_perc) %>%
  mutate(actual_predicted_ratio = Actual/APPG) %>%# new variable: actual_predicted_ratio
  filter(actual_predicted_ratio>=1 & Salary>=3000 & Salary<8000) %>%
  arrange(desc(actual_predicted_ratio))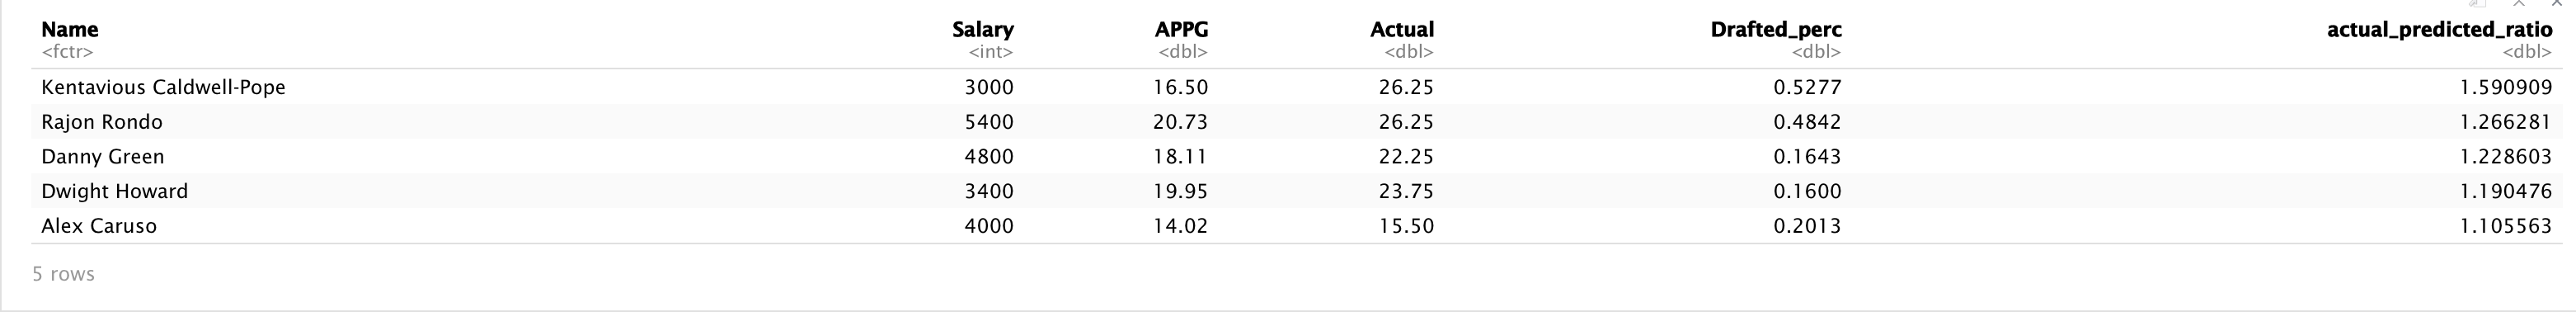
These five players have good value, and we may want to consider draft them again in Game 2.
这五个球员都具有很高的价值,我们可能要考虑在第二场比赛中再次选拔他们。
阵容建设 (Lineup Construction)
Core Players: Anthony Davis → Lebron James→Nikola Jokic→Jamal Murray
核心球员:安东尼·戴维斯(Anthony Davis)→勒布朗·詹姆斯(Lebron James)→尼古拉·约基奇(Nikola Jokic)→贾马尔·默里(Jamal Murray)
Value Players: Kentavious Caldwell-Pope → Rajon Rondo→Danny Green → Dwight Howard → Alex Caruso
富豪:Kentavious Caldwell-Pope→Rajon Rondo→Danny Green→Dwight Howard→Alex Caruso
I’d include two core players (Davis is my fav) and two or three value players with the last position from other cheap players.
我将包括两名核心球员(戴维斯是我的最爱)和两名或三名有价值球员,而其他廉价球员的最后位置。
Post-season NBA games are competitive, and players tend to fluctuate from one game to another. Uncertainty is inevitable. My coping strategy is to incorporate the uncertainty and risks involved by mixing and matching core VS. value players.
季后赛NBA比赛具有竞争性,并且玩家往往会从一种游戏波动到另一种游戏。 不确定性是不可避免的。 我的应对策略是融合混合和匹配核心VS所涉及的不确定性和风险。 价值玩家。
As it turns out, these players are winning in Game 2.
事实证明,这些球员在第二场比赛中获胜。
(I promise I didn’t cherry-pick the players with any reference to their Game 2 performance while writing the post).
(我保证在写这篇文章时,我不会轻易提及玩家在第二场比赛中的表现)。
Disclaim The sole purpose of this post is to show data manipulation skills in R; it shall not serve as an investment recommendation or endorsement of any sort. Investment comes with risk!
免责声明这篇文章的唯一目的是展示R中的数据操作技巧; 不得作为任何投资建议或认可。 投资带来风险!


 2908
2908

 被折叠的 条评论
为什么被折叠?
被折叠的 条评论
为什么被折叠?
 到【灌水乐园】发言


