增强您在机器学习项目中的研究的4种技术

In my post Research guidelines for Machine Learning project, I explained how to split any Machine Learning projects into two stages (Research and Development) and some tricks to boost the Research stage.

在我的机器学习项目研究指南中,我解释了如何将任何机器学习项目分为两个阶段(研究和开发),以及一些提高研究阶段的技巧。

在本文中,我将深入研究一些技术和工具,以帮助您精通研究。 在此阶段工作时,您应该努力做到简单和专注。 (In this post, I will delve into some techniques and tools that will help you out mastering your Research. While working in this stage, you should strive for simplicity and focus.)

项目布局 (Project layout)

This is the folder layout I tend to use at the beginning of any ML project. This layout is open to extension (such as adding a tests folder, deploy folder, etc) as soon as the project needs to grow up.

这是我在任何ML项目开始时都倾向于使用的文件夹布局。 项目需要长大后,此布局便可以扩展(例如添加tests文件夹, deploy文件夹等)。

project          # project root
├── data # data files
├── models # machine learning models
├── notebooks # notebook files
└── src # helper functions

Unlike regular software development projects, ML projects have 3 foundational stones: the source code (notebooks and src), the data consumed/produced by the code, and the model built/consumed by the code and the data.

与常规软件开发项目不同,机器学习项目具有3个基础:源代码(笔记本和src),代码消耗/产生的数据以及代码和数据建立/使用的模型

📁数据 (📁 data)

After ingesting the data, my recommendation is to process the data in stages, where each stage has its own folder. For example:

摄取数据后,我的建议是分阶段处理数据,每个阶段都有自己的文件夹。 例如:

data
├── raw # original files
├── interim # preprocessed files
└── processed # result files

From this layout, you can follow the flow of the data, as in a pipeline: from raw to interim, and then to processed.

通过这种布局,您可以像在管道中那样跟踪数据流:从rawinterim ,再到已processed

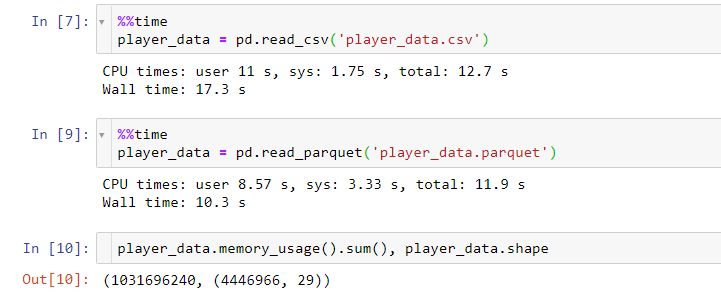
Firstly, the 📁 raw folder stores the data in its original format. In case you can work with offline data, it is very handy to keep always a frozen (read-only) copy of your data. Second, the 📁 interim folder is meant to store data resulting from the data transformations. Probably, these transformations might end up enlarging your dataset. This is the reason I tend to use binary formats, which gain better performance around serialization/deserialization tasks. One of the most used binary formats is parquet (check out how to read/save parquet data using pandas).

首先,📁 raw文件夹存储原始格式的数据。 如果可以使用脱机数据,则始终保持数据的冻结(只读)副本非常方便。 其次,📁 interim文件夹用于存储由数据转换产生的数据。 这些转换可能最终会扩大您的数据集。 这就是我倾向于使用二进制格式的原因,该格式在序列化/反序列化任务方面获得更好的性能。 实木复合地板是最常用的二进制格式之一(查看如何使用pandas读取/保存实木复合地板数据)。

Image for post
time to load a .csv file vs time to load a parquet file
加载.csv文件的时间与加载木地板文件的时间

Lastly, the 📁 processed folder is used to store the results of the machine learning model.

最后,已processed文件夹用于存储机器学习模型的结果。

Even though the raw folder can store files in many formats (.csv, .json, .xls, etc), my recommendation is to use some a common format in the interim folder (for example: binary formats such as .parquet, .feather, or raw formats such as .csv, .png) and use a customer-friendly format in the processed folder (for example: .csv or excel file allows stakeholders to review the results of your model). Sometimes makes sense to include summary plots about the results of your model (for example: when building a recommender system, does the distribution of your recommendations follows a similar pattern than your sales distribution?)

即使raw文件夹可以存储多种格式的文件( .csv.json.xls等),我的建议还是在interim文件夹中使用一些通用格式(例如: .parquet.feather等二进制格式)或原始格式(如.csv.png ),并在processed文件夹中使用客户友好的格式(例如: .csv或excel文件允许涉众查看模型的结果)。 有时包含有关模型结果的摘要图是有意义的(例如:在构建推荐系统时,您的推荐分布是否遵循与销售分布类似的模式?)

📁笔记本 (📁 notebooks)

While working in the Research stage, I use Jupyter Notebooks as my execution platform/IDE. This is the reason most of the code that supports the Machine Learning Lifecycle is hosted in Jupyter Notebooks

在研究阶段工作时,我将Jupyter Notebooks作为执行平台/ IDE。 这就是大多数支持机器学习生命周期的代码托管在Jupyter Notebooks中的原因

Image for post
Machine Learning (simplified) lifecycle
机器学习(简化)的生命周期

So, the notebooks folder resembles (up to some degree) the ML lifecycle:

因此,笔记本文件夹类似于ML生命周期(在某种程度上):

notebooks
├── 1__ingestion # |-> data/raw
├── 1_1__eda
├── 2__preprocessing # |<- data/raw
│ |-> data/interim
├── 2_1__eda
├── 3_1__model_fit_variant_1 # |-> model/variant_1.pkl
├── 3_2__model_fit_variant_2 # |-> model/variant_2.pkl
├── 3_3__models_validation
└── 4__model_predict # |<- data/interim, model/*.pkl
|-> data/processed

I won’t delve into detail into what is every notebook responsible, as I think most of you should be related to the Machine Learning lifecycle.

我不会深入研究每个笔记本的责任,因为我认为你们大多数人都应该与机器学习生命周期有关。

And in any case, you should apply the layout and naming conventions that fit your way of working (or use more complex layout templates if you wish). Maybe you will need a couple or more of iterations to find your own blueprint but take it as part of the learning process. For example, I like to split the EDA into two parts, the first one uses only raw data and the second one focuses on the “new data” produced after the pre-processing stage. But if you like doing a single EDA, this is fine also. These project layouts shown here are meant to make you do things with a purpose and do not act following your free will. This will be important once you hand over the project to the next stage (Development), as your teammates will be able to recognize the shape and the components of your project.

在任何情况下,您都应应用适合您工作方式的布局和命名约定(或根据需要使用更复杂的布局模板)。 也许您需要几次或多次迭代才能找到您自己的蓝图,但将其作为学习过程的一部分。 例如,我想将EDA分为两部分,第一部分仅使用原始数据,第二部分集中于预处理阶段之后生成的“新数据”。 但是,如果您喜欢执行一个EDA,那也可以。 此处显示的这些项目布局旨在使您有目的地做事,并且不要遵循您的自由意志行事。 一旦将项目移至下一阶段(开发),这将很重要,因为您的队友将能够识别项目的形状和组件。

📁型号 (📁 model)

The result of the modeling notebooks (the ML model after training) can be stored in this folder. Most of ML frameworks (like scikit-learn, spacy, PyTorch) have built-in support for model serialization (.pkl, .h5, etc); otherwise, check out the magnificent cloudpickle package.

建模笔记本的结果(训练后的ML模型)可以存储在此文件夹中。 大多数ML框架(如scikit-learn,spacy,PyTorch)都具有对模型序列化的内置支持( .pkl.h5等); 否则,请检查宏伟的Cloudpickle包装。

📁src (📁 src)

One of the differences between the Research and Development stages is that during the former the src will be pretty slim (containing helper and other common functions used by notebooks) whilst during the latter this folder will be filled with other folders and .py files (code ready for production deployment).

研究与开发阶段之间的区别之一是,在前一个阶段, src会非常苗条(包含笔记本使用的辅助功能和其他常用功能),而在后一个阶段,此文件夹将充满其他文件夹和.py文件(代码准备进行生产部署)。

WSL2 (WSL2)

Windows Subsystem for Linux (v2) is the new kid in the block. If you are already using Linux or MacOS, you can skip this section. Otherwise, if you fall into the Windows user category, you should keep reading. Most of the python packages are compatible with Windows systems; but you never know when you will face adversity of non-compatible OS packages (for example: apache airflow doesn’t run in Windows environment). During these times, you will learn to love WSL, because it behaves as a fully-fledged Linux system without ever leaving your Windows environment. The performance is quite decent, and most IDE’s are compatible with WSL.

适用于Linux的Windows子系统(v2)是新手。 如果您已经在使用Linux或MacOS,则可以跳过本节。 否则,如果您属于Windows用户类别,则应继续阅读。 大多数python软件包都与Windows系统兼容。 但是您永远不知道何时会遇到不兼容的OS软件包的灾难(例如:apache airflow无法在Windows环境中运行)。 在这段时间里,您将学习到爱上WSL,因为它的功能就像一个成熟Linux系统,而无需离开Windows环境。 性能相当不错,大多数IDE与WSL兼容。

Image for post
Windows Terminal running WSL
Windows终端运行WSL

For example, Visual Studio Code has native support for WSL. This means loading any python project/folder, using your regular plugins and execute or debug code. Because WSL mounts the host drive in the /mnt folder, you will still have access to the windows host folders. If you end up using the same project both in Windows and WSL, consider you might hit some inter-operability issues. For example, git might inaccurately detect files as changed due to file permissions or CRLF line endings. To fix these issues, you can execute the following commands in WSL:

例如, Visual Studio Code具有WSL的本机支持。 这意味着使用常规插件加载任何python项目/文件夹,并执行或调试代码。 由于WSL将主机驱动器安装在/mnt文件夹中,因此您仍然可以访问Windows主机文件夹。 如果最终在Windows和WSL中都使用同一项目,请考虑可能会遇到一些互操作性问题。 例如,由于文件权限或CRLF行尾,git可能会错误地将文件检测为已更改。 要解决这些问题,可以在WSL中执行以下命令:

git config --global core.filemode false
git config --global core.autocrlf true

The future ahead of WSL is promising: native access to GPU (= train deep learning models using the GPU) and Linux GUI (= support not only for terminal applications but for GUI applications as well). Finally, don’t miss your chance to use the amazing Windows Terminal altogether with WSL.

WSL的前途是光明的:对GPU的本地访问(=使用GPU训练深度学习模型)和Linux GUI (不仅支持终端应用程序,还支持GUI应用程序)。 最后,不要错过与WSL一起使用出色的Windows Terminal的机会。

Jupyter笔记本 (Jupyter Notebook)

Without a doubt, Jupyter Notebooks is my preferred tool for doing exploration and research. But at the same time, Jupyter Notebooks is not the best tool suited for taking your model to production. Between these opposite terms (Research/Development), there is a common ground where you can enhance how you use Jupyter Notebooks.

毫无疑问,Jupyter Notebooks是我进行探索和研究的首选工具。 但是同时,Jupyter Notebooks并不是最适合将模型投入生产的最佳工具。 在这两个相反的术语(研究/开发)之间,有一个共同点可以增强您使用Jupyter笔记本的方式。

安装 (Installation)

I recommend installing Jupyter Notebook using Anaconda and Conda environments. But you can use any other package management tool (such as virtualenv, pipenv, etc). But you must use someone, and therefore, used it in your projects too.

我建议使用Anaconda和Conda环境安装Jupyter Notebook。 但是您可以使用任何其他软件包管理工具(例如virtualenvpipenv等)。 但是您必须使用某个人,因此也要在您的项目中使用它。

How to install Jupyter Notebook (or rather, how I installed it in my machine):

如何安装Jupyter Notebook(或者更确切地说,我如何在计算机中安装它):

Install Jupyter Notebook using Anaconda (therefore, you first need to install Anaconda); then install Jupyter Notebook in the base/default (conda) environment executing the following commands:

使用Anaconda安装Jupyter Notebook(因此,您首先需要安装Anaconda ); 然后在基本/默认(conda)环境中安装Jupyter Notebook,执行以下命令:

conda activate base
conda install -c conda-forge notebook

This sounds against all good practices (Jupyter Notebook should be a project dependency), but I consider that as Visual Studio Code (or name-your-preferred-IDE-here) itself, Jupyter Notebook should be a dependency at the machine level, not at the project level. This makes posterior customizations much easier to manage: for example, in case of using Jupyter Extensions (more on this in the next section), you will configure the Extensions only once, and then they will be available for all kernels/projects.

这听起来不符合所有好的做法(Jupyter Notebook应该是项目依赖项),但是我认为,作为Visual Studio代码(或名称为您首选的IDE-here )本身,Jupyter Notebook应该是计算机级别的依赖项,而不是在项目级别。 这使得后验定制更易于管理:例如,在使用Jupyter Extensions的情况下(下一节将对此进行详细介绍),您只需配置一次Extensions,然后它们就可用于所有内核/项目。

After installing Jupyter Notebook, is the turn for Jupyter Notebook extensions; run the following commands in your console:

安装Jupyter Notebook之后,就可以使用Jupyter Notebook扩展了。 在控制台中运行以下命令:

conda install -c conda-forge jupyter_contrib_nbextensions
jupyter contrib nbextension install --user
conda install -c conda-forge jupyter_nbextensions_configurator

Then, each time you create a new conda environment (you should create a new environment every time you start a new project), you need to make it available as Jupyter kernel, executing the following command:

然后,每次创建新的conda环境(每次启动新项目时都应创建一个新环境)时,需要将其作为Jupyter内核使用,执行以下命令:

python -m ipykernel install --user --name retail --display-name "Python (retail)"

Finally, to launch Jupyter Notebook, you should be in the base environment, and then execute:

最后,要启动Jupyter Notebook,您应该在基本环境中,然后执行:

project          # project root (launch jupyter notebook from here,
│ # using the base/default conda environment)
├── data
├── models
├── notebooks
└── srcconda activate base
jupyter notebook

Once Jupyter Notebook is launched into your web browser, you can select the required environment (kernel) for your notebook:

将Jupyter Notebook启动到Web浏览器后,您可以为笔记本选择所需的环境(内核):

Image for post
Jupyter Notebook — Change Kernel
Jupyter笔记本—更改内核

The first time you set the Kernel in your notebook, it will be recorded in the notebook metadata and you won’t need to set it up every time you launch the notebook.

首次在笔记本中设置内核时,它将被记录在笔记本元数据中,并且您无需在每次启动笔记本时都进行设置。

笔记本扩展 (Notebook Extensions)

Use Jupyter Notebook Extensions. Just for the sake of enabling the Collapsing headers extension. When you are working with large notebooks, this is extremely helpful for organizing the information into your notebook, and not losing your mind paging back and forth inside the notebook. I consider it a must. PERIOD.

使用Jupyter Notebook扩展。 只是为了启用Collapsing headers扩展名。 当您使用大型笔记本电脑时,这对于将信息组织到笔记本电脑中,而又不会让您在笔记本电脑内部来回调皮的想法非常有用。 我认为这是必须的。 期。

One of the most important things you should provide when delivering a notebook is executability (once the dependencies — kernel and source files — are set, the notebook must be runnable from top to bottom) and reproducibility (when the notebook is executed should return always the same results).

交付笔记本时应提供的最重要的内容之一是可执行性(一旦设置了依赖项(内核和源文件),则笔记本必须从上到下均可运行)和再现性(执行笔记本时应始终返回相同的结果)。

But as we are in the Research stage, we can allow some degrees of uncertainty. A great tool that can support this is the Freeze text extension, allowing us to literally preserve the results of your past experiments. Using the toolbar, you can turn a cell read-only (it can be executed, but its input cannot be changed) or frozen (It cannot be either altered or executed). So in case you can't enforce reproducibility, at least you can keep some base results to compare your current execution with.

但是,正如我们处于研究阶段一样,我们可以允许一定程度的不确定性。 Freeze text扩展名是支持此功能的一个很好的工具,它使我们能够从字面上保留您过去实验的结果。 使用工具栏,您可以将单元格设置为只读(可以执行,但不能更改其输入)或冻结(不能更改或执行)。 因此,如果您无法强制执行可重复性,至少可以保留一些基本结果来与您当前的执行结果进行比较。

Image for post
Freeze text Jupyter Notebook Extension Freeze text Jupyter Notebook扩展

For example, in the above figure, you can compare the accuracy of the last epoch and the execution time. Also, consider that for the sake of logging/tracking your experiments, there are much better tools like mlFlow and wandb (although I consider these tools more relevant in the Development stage).

例如,在上图中,您可以比较最后一个时期的准确性和执行时间。 另外,考虑到为了记录/跟踪实验,还有更好的工具,例如mlFlowwandb (尽管我认为这些工具在开发阶段更重要)。

Finally, I encourage you to check out other available extensions (such as scratchpad, autopep, code folding, …). If you followed my installation setup, there should be a tab named Nbextensions available to you to configure Notebook extensions:

最后,我建议您检查其他可用的扩展(例如便笺本,自动pep,代码折叠等)。 如果您遵循我的安装设置,应该有一个名为Nbextensions的选项卡可用于配置Notebook扩展:

Image for post
Jupyter Notebook Extensions manager
Jupyter笔记本扩展管理器

Otherwise, you can enable extensions via the command line.

否则,您可以通过命令行启用扩展

笔记本测试和源代码控制 (Notebook Testing and Source Control)

Jupyter Notebooks play nicely neither with testing nor with source control. In the case of testing, there is some help using papermill and nbdev. Also, I highly recommend using the old school tricks as the assert command to verify your code assumptions. For example, after every pd.merge, it is always a good practice to check the cardinality of the resulting dataframe (initial number rows == final number rows):

Jupyter Notebooks不能很好地与测试或源代码控制一起玩。 在测试的情况下,存在利用一些帮助造纸厂nbdev 。 另外,我强烈建议使用老式的技巧作为assert命令来验证您的代码假设。 例如,在每个pd.merge ,始终最好检查一下结果数据帧的基数(初始编号行==最终编号行):

nrows_initial = df.shape[0]
df = pd.merge(df, df_sub, how="left")
assert nrows_initial == df.shape[0]

In the case of source control, you can check nbdime, for diff-ing and merging notebooks. Usually git offers a poor diff-ing experience for detecting changes in notebook files, but in contrast nbdime is a powerful tool, that you can use from the command line (integration with git, bash, and PowerShell is provided) or from a web interface, which provides a much richer experience (integration with Jupyter Notebook is provided as well). I really appreciated the fact that nbdime classifies updates by changes in input cells, changes in output cells and changes to cell's metadata.

源控制的情况下,你可以检查nbdime ,对于DIFF-ING合并的笔记本电脑。 通常, git在检测笔记本文件中的更改方面提供了较差的差异体验,但是相比之下, nbdime是一个功能强大的工具,可以从命令行(提供了与git,bash和PowerShell的集成)或从Web界面使用,它提供了更加丰富的体验(还提供了与Jupyter Notebook的集成)。 我真的很欣赏nbdime通过输入单元格的更改,输出单元格的更改以及单元格元数据的更改对更新进行分类的事实。

Image for post
nbdime — diffing and merging of Jupyter Notebooks nbdime — Jupyter Notebooks的差异和合并

笔记本魔术命令(Notebook magic commands)

Another recommendation when using Jupyter Notebooks is to leverage the use of built-in %magic commands. My favorite magic commands are:

使用Jupyter Notebook时的另一项建议是利用内置的%magic命令。 我最喜欢的魔术命令是:

%load_ext autoreload
%autoreload 2
%matplotlib inline

The %autoreload magic command turns very handy when re-loading modules and packages in memory without restarting the kernel. For example, if you're working with code that is stored in a classic .py file, when the source file is updated, as soon as you execute a cell in the notebook, the new source file will be re-loaded in the current kernel and the changes will be available to use. Another plus of this technique is that you can install new packages on the notebook's environment and (most of the time) it will get available for importing in the current notebook (again, without restarting the kernel). On the other hand, the magic command %matplotlib is used for redirecting matplotlib output to the current canvas notebook.

当在不重新启动内核的情况下重新加载内存中的模块和软件包时, %autoreload magic命令变得非常方便。 例如,如果您正在使用存储在经典.py文件中的代码,则在更新源文件时,一旦在笔记本中执行单元格,新的源文件将重新加载到当前文件中。内核和更改将可供使用。 这种技术的另一个优点是,您可以在笔记本的环境中安装新软件包,并且(大多数情况下)可以将其导入当前的笔记本中(同样,无需重新启动内核)。 另一方面,魔术命令%matplotlib用于将matplotlib输出重定向到当前的画布笔记本。

Another lesser-known magic commands are:

另一个鲜为人知的魔术命令是:

%%time when you need to profile the time spent executing a cell in a notebook. I like to use this command with complex cells that require long execution times, as I have an idea of how much is going to take to finish the execution. If you want more information on this, you can read the excellent Profiling and Timing Code - Python Data Science Handbook chapter.

您需要分析在笔记本中执行单元所花费的%%time时的%%time 。 我喜欢将此命令与需要较长执行时间的复杂单元一起使用,因为我已经知道要完成执行将花费多少。 如果您想了解更多信息,可以阅读出色的“性能分析和计时代码-Python数据科学手册”一章。

Image for post
profiling execution time using %%time
使用 %%time分析执行 %%time

Another way to profile your code is by using tqdm, which shows a nice progress bar when executing “batches of code”. The output adapts nicely depending on the execution context (python, interactive or Jupyter Notebook).

配置代码的另一种方法是使用tqdm ,它在执行“一批代码”时显示一个不错的进度条。 根据执行上下文(python,交互式或Jupyter Notebook),输出可以很好地适应。

Image for post
tqdm tqdm

In case you need to execute “batches of code” in parallel and show their progression, there you can use pqdm.

如果您需要并行执行“代码段”并显示其进度,可以在此处使用pqdm

%debug (yes you can debug), after a cell fails to execute due to an error, execute the %%debug magic command in the next cell. After this, you will get access to the (magnificent [sarcasm intended] ) pdb debugging interface; bear in mind, no fancy UI for setting breakpoints, just "old fashioned" commands alas 's' for step, 'q' for quit, etc; you can check the rest of pdb commands for your own amusement.

%debug (是的,您可以调试),由于错误而导致单元执行失败后,在下一个单元中执行%%debug magic命令。 之后,您将可以访问(宏伟的[sarcasm预期]) pdb调试界面; 请记住,没有用于设置断点的精美UI,只是“老式”命令,步长为“ s”,退出为“ q”,等等。 您可以根据自己的需要检查其余的pdb命令

前处理 (Pre-processing)

数据管道(Data pipelines)

In my last projects, I’ve got a strong inspiration from this post A framework for feature engineering and machine learning pipelines which explains how to build a machine learning pre-processing pipelines. The most important idea is to NOT postpone what can be done previously, and transform the data following this order:

在我的上一个项目中,我从这篇针对特征工程和机器学习管道的框架这个帖子中获得了很大的启发,该框架解释了如何构建机器学习预处理管道。 最重要的想法是不要推迟之前可以完成的操作,并按照以下顺序转换数据:

  1. Pre-process: column-wise operations (i.e. map transformations)

    预处理:逐列操作(即, map转换)

  2. Feature engineering: row-wise operations (i.e. group by transformations)

    特征工程:逐行操作(即group by变换group by )

  3. Merge: dataframe wise operations (i.e. merge transformations)

    合并:数据框明智的操作(即merge转换)

  4. Contextual: cross-dataframe operations (i.e. map operations with cross-context)

    上下文:跨数据框操作(即具有跨上下文的map操作)

剖析 (Profiling)

Start doing EDA from scratch is laborious because you need to query the data beforehand in order to know what to show (or what to look for). This situation ends up authoring repetitive queries to show the histogram of a numerical variable, check missing values in a column, validate the type of a column, etc. Another option is to generate this information automatically, using packages like pandas-profiling , which reports all sorts of information.

从头开始进行EDA十分麻烦,因为您需要事先查询数据才能知道显示的内容(或要查找的内容)。 这种情况最终导致编写重复查询以显示数字变量的直方图,检查列中的缺失值,验证列的类型等。另一种选择是使用pandas-profiling之类的包自动生成此信息,该报告各种信息。

Image for post
pandas-profiling 熊猫分析

The classic way for checking for missing data is using the pandas API as in df.isna().sum(); in the same way, you can query data frequencies executing df.species.value_counts(). But the output of these commands is "incomplete", as only returns absolute figures. Welcome sidetable, which enriches past queries in a nice tabular way:

检查缺失数据的经典方法是使用df.isna().sum()pandas API; 以相同的方式,您可以查询执行df.species.value_counts()数据频率。 但是这些命令的输出是“不完整的”,因为仅返回绝对数字。 Welcome sidetable ,以一种很好的表格形式丰富了过去的查询:

Image for post
value_counts() vs sidetable value_counts() vs边桌 freq() freq()

The sidetable and pandas-profiling API are totally integrated into the pandas DataFrame API, and have support for Jupyter Notebooks.

sidetablepandas-profiling API已完全集成到pandas DataFrame API中,并支持Jupyter Notebooks。

PS: this area is “hot” at the current moment, so expect more packages to come in the future (klib)

PS:目前该领域很“热门”,因此希望将来会有更多软件包( klib )

可视化 (Visualizations)

Seaborn is an old companion for many of us. The next version (0.11) is going to bring something I’ve been expecting for a while: stacked bar charts.

Seaborn是我们许多人的老朋友。 下一个版本(0.11)将带来我期待已久的东西:堆积的条形图

Image for post
stacked bar charts 堆积条形图

If you read this while the feature is still not published, remember you can install “development” packages directly from GitHub, using the following command:

如果您在该功能尚未发布时阅读了此内容,请记住您可以使用以下命令直接从GitHub安装“开发”包:

pip install  https://github.com/mwaskom/seaborn.git@4375cd8f636e49226bf88ac05c32ada9baab34a8#egg=seaborn

You can also use this kind of URLs in your requirements.txt or environment.yml file, although I recommend to pin down the commit hash of the repository (as shown in the latter snippet). Otherwise, you will install "the last repository version which is available at installation time". Also, be wary of installing "beta" or "development" versions in production. You are warned

您也可以在requirements.txtenvironment.yml文件中使用这种URL,尽管我建议固定存储库的提交哈希(如后面的代码片段所示)。 否则,您将安装“安装时可用的最新存储库版本”。 另外,请警惕在生产中安装“ beta”或“ development”版本。 警告您

[updated] Seaborn version 0.11 is currently available, so you don’t need to install the development version from GitHub. Nevertheless, I will leave the notes about installing development versions for the sake of the knowledge.

[更新] Seaborn版本0.11当前可用,因此您无需从GitHub安装开发版本。 尽管如此,为了了解这一点,我将保留有关安装开发版本的说明。

During my last project, I got to know a really handy package for visualizing maps alongside statistical information: kepler.gl, an original node.js module that recently was ported to Python, and also got a friendly extension to load maps into Jupyter notebooks.

在上一个项目中,我了解了一个非常方便的软件包,用于可视化地图和统计信息: kepler.gl ,这是一个原始的node.js模块,最近已移植到Python,并且得到了友好的扩展,可以将地图加载到Jupyter笔记本中

The most important features that I love about kepler.gl are:

我喜欢kepler.gl的最重要功能是:

  1. Tightly integrated with pandas API.

    pandas API紧密集成。

  2. I was able to make an impressive 3D map visualization including a dynamic timeline that was automatically animated in a short amount of time.

    我能够做出令人印象深刻的3D地图可视化效果,其中包括动态时间轴,该时间轴可在短时间内自动进行动画处理。
  3. The UI has many GIS features (layers and such), so the maps are highly interactive and customizable. But the best part is that you can save these UI settings and export them as a python object (a python dictionary to be precise); next time you load the map, you can pass this python object and avoid to set the map up again from scratch.

    UI具有许多GIS功能(图层等),因此地图具有高度的交互性和可自定义性。 但是最好的部分是您可以保存这些UI设置,并将其导出为python对象(准确地说是python字典); 下次加载地图时,您可以传递此python对象,避免再次从头开始设置地图。
from keplergl import KeplerGl
sales_map = KeplerGl(height=900,
data={"company sales" : df,
"box info" : df.drop_duplicates(subset=["product_id"]),
"kid_info" : df.drop_duplicates(subset=["user_id"]) },
config=config # configuration dictionary
)
sales_map

​​Thanks for your time in reading this post.

感谢您花时间阅读这篇文章。

  • Most of the issues I explained in this post are based on my work experience in ML projects. But they don’t necessarily might fit in your working environment, but at least, I hope they can provide you some food for thought.

    我在这篇文章中解释的大多数问题都基于我在ML项目中的工作经验。 但是它们不一定适合您的工作环境,但至少,我希望它们可以为您提供一些思考的机会。
  • Keep in mind this post focuses on experiments during the Research stage, so I permit some licenses around that I won’t permit myself in a final product. At the same time, I tried to enforce areas that are easily covered using the right tools (for example: simple testing using assert, good practices for pipelines, etc).

    请记住,这篇文章侧重于研究阶段的实验,因此我允许一些许可,而我不会允许自己进入最终产品。 同时,我尝试使用适当的工具(例如:使用assert简单测试,管道的良好实践等)来强制执行容易覆盖的领域。

  • It seems counterproductive that I don’t describe machine learning models issues (training, validation and deployment). But in the beginning, you will spend much more time planning your project, transforming your data and dealing with software related nuisances than executing fit/predict methods.

    我没有描述机器学习模型的问题(培训,验证和部署)似乎适得其反。 但是从一开始,与执行拟合/预测方法相比,您将花费更多的时间来计划项目,转换数据以及处理与软件相关的麻烦。
  • Please share your notes or your experiences in the comments. As I said before, I left multiple areas without further detail, but if you are interested in any of them, please say so. This will help to advance this amazing community.

    请在评论中分享您的笔记或经验。 就像我之前说过的,我离开了多个领域,没有进一步的细节,但是如果您对其中任何一个感兴趣,请这么说。 这将有助于发展这个惊人的社区。

翻译自: https://towardsdatascience.com/4-techniques-to-enhance-your-research-in-machine-learning-projects-c691892ab9dd

  • 0
    点赞
  • 0
    收藏
    觉得还不错? 一键收藏
  • 0
    评论

“相关推荐”对你有帮助么?

  • 非常没帮助
  • 没帮助
  • 一般
  • 有帮助
  • 非常有帮助
提交
评论
添加红包

请填写红包祝福语或标题

红包个数最小为10个

红包金额最低5元

当前余额3.43前往充值 >
需支付:10.00
成就一亿技术人!
领取后你会自动成为博主和红包主的粉丝 规则
hope_wisdom
发出的红包
实付
使用余额支付
点击重新获取
扫码支付
钱包余额 0

抵扣说明:

1.余额是钱包充值的虚拟货币,按照1:1的比例进行支付金额的抵扣。
2.余额无法直接购买下载,可以购买VIP、付费专栏及课程。

余额充值