


如何编写数据库可视化界面
什么是替代文字 (What is Alt Text)
Alt text (sometimes called Alt tags or alternative text) are written descriptions added to images that convey the meaning of the visual. Good alt text helps more people understand the content. Assistive technology like screen readers reads the alt text out loud so users can hear and understand the visual content. People who use screen readers often have a vision impairment. This includes people who are totally blind, but also people with low or impaired vision.
Alt文本 (有时称为Alt标记或替代文本)是添加到图像的书面说明,传达了视觉的含义。 优质的替代文字可帮助更多的人理解其内容。 诸如屏幕阅读器之类的辅助技术会大声朗读alt文本,以便用户可以听到和理解视觉内容。 使用屏幕阅读器的人经常有视力障碍。 这包括完全失明的人,也包括视力低下或受损的人。
Not writing alt text means that people miss out on content that is necessary, just because it’s visual. It means it’s not accessible.
不写替代文本意味着人们会因为视觉内容而错过必要的内容。 这意味着它不可访问。
从Webaim定义的替代文字: (Alt Text defined from Webaim:)
It is read by screen readers in place of images allowing the content and function of the image to be accessible to those with visual or certain cognitive disabilities.
屏幕阅读器代替图像来读取它,从而使视觉或某些认知障碍者可以访问图像的内容和功能 。
It is displayed in place of the image in browsers if the image file is not loaded or when the user has chosen not to view images.
如果未加载图像文件或当用户选择不查看图像时,它将在浏览器中代替图像显示。
It provides a semantic meaning and description to images which can be read by search engines or be used to later determine the content of the image from page context alone.
它为图像提供了语义含义和描述,可以被搜索引擎读取或用于以后仅从页面上下文确定图像的内容。
There are many resources for how to write alt text generally (I list more at the end of this piece), but few that provide guidance for how to write descriptions for data viz.
通常有很多 资源来编写替代文本(我在本文的结尾列出了更多),但是很少有资源为如何编写数据说明提供指导。
如何为数据可视化编写替代文本 (How to write for alt text for data visualization)
So how do you write something short that conveys the whole meaning of a visualization? You probably can’t. That doesn’t mean that you shouldn’t try.
那么,如何编写简短的内容来传达可视化的全部含义呢? 你可能做不到。 这并不意味着您不应该尝试。
- Adding alt text is better than not doing anything at all if there’s meaningful information in the image. 如果图像中包含有意义的信息,则添加替代文本总比不执行任何操作更好。
Add a long description if you can add HTML, to more fully convey the meaning.
如果可以添加HTML,请添加长说明 ,以更全面地传达其含义。
- Supplement with a link to the raw data, so curious readers can access the data in their own preferred program. 补充原始数据的链接,以便好奇的读者可以在自己的首选程序中访问数据。
- Keep your alt text short. Alt text is read linearly by screen readers, which means that people can’t go back a word if they missed something. For SEO purposes, Google cuts off after a certain amount of characters. 保持替代文字简短。 屏幕阅读器会线性读取Alt文本,这意味着人们如果错过了某些内容就无法退缩一个单词。 出于搜索引擎优化的目的,Google会在输入一定数量的字符后将其截断。
The World Wide Web Consortium (W3C), an international Web standards setting community, offers guidelines for alt text for complex images, but it can be difficult to interpret how to apply these to data visualization. Below, I interpret these guidelines to apply to charts and graphs. Refer to the W3C guidelines for nuance and compliance.
万维网联盟(W3C)是一个国际Web标准制定社区,它为复杂图像提供替代文本准则 ,但是很难解释如何将其应用于数据可视化。 在下文中,我解释了这些指导原则以适用于图表。 有关细微差别和合规性,请参阅W3C准则 。
Here’s a simple formula for writing alt text for data visualization:
这是编写用于数据可视化的替代文本的简单公式:
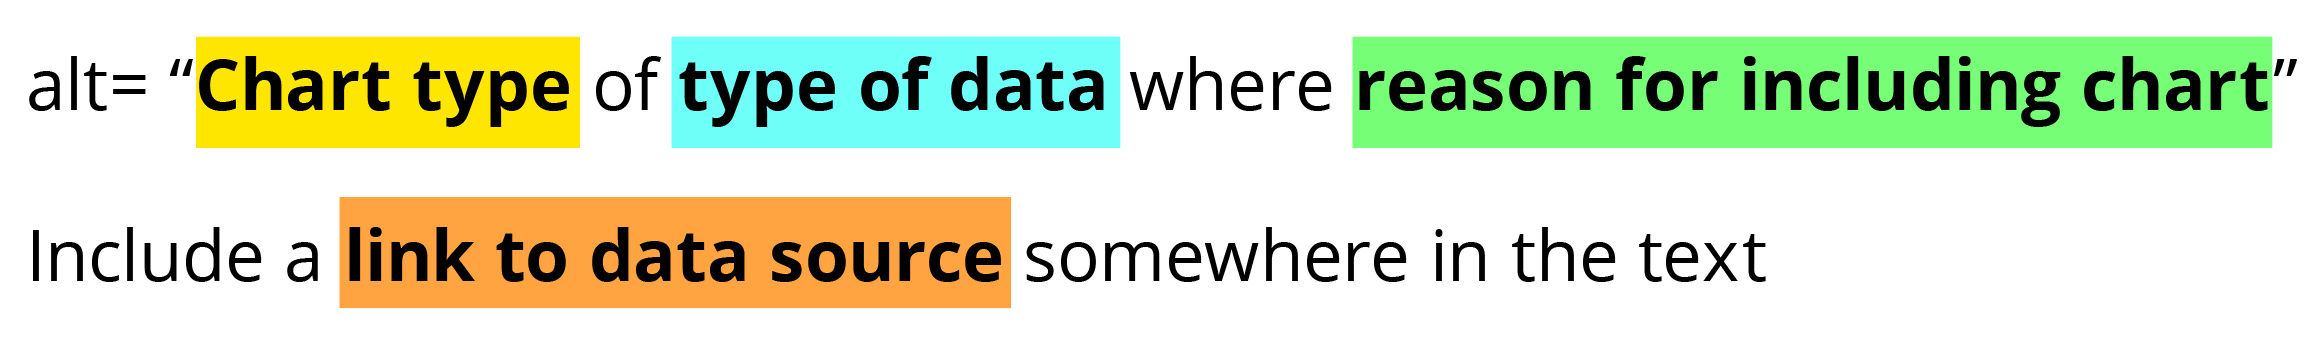
图表类型 (Chart type)
It’s helpful for people with partial sight to know what chart type it is and gives context for understanding the rest of the visual. Example: Line graph
对于视力不佳的人来说,了解它是什么图表类型并为理解其余视觉内容提供上下文很有帮助。 示例:折线图
资料类型 (Type of data)
What data is included in the chart? The x and y axis labels may help you figure this out. Example: number of bananas sold per day in the last year
图表中包含哪些数据? x和y轴标签可以帮助您解决这一问题。 示例:去年每天出售的香蕉数量
包含图表的原因 (Reason for including the chart)
Think about why you’re including this visual. What does it show that’s meaningful. There should be a point to every visual and you should tell people what to look for. Example: the winter months have more banana sales
考虑一下为什么要包含此视觉效果。 它表明什么是有意义的。 每个视觉效果都应该有重点,您应该告诉人们要寻找的东西。 示例:冬季的香蕉销量增加
链接到数据或源 (Link to data or source)
Don’t include this in your alt text, but it should be included somewhere in the surrounding text. People should be able to click on a link to view the source data or dig further into the visual. This provides transparency about your source and lets people explore the data. Example: Data from the USDA
不要在替代文字中包含此内容,但应将其包含在周围的文字中。 人们应该能够单击链接来查看源数据或进一步挖掘视觉效果。 这提供了有关您来源的透明性,并允许人们浏览数据。 示例:来自 USDA的 数据
简单图表替代文字示例 (Simple chart alt text example)
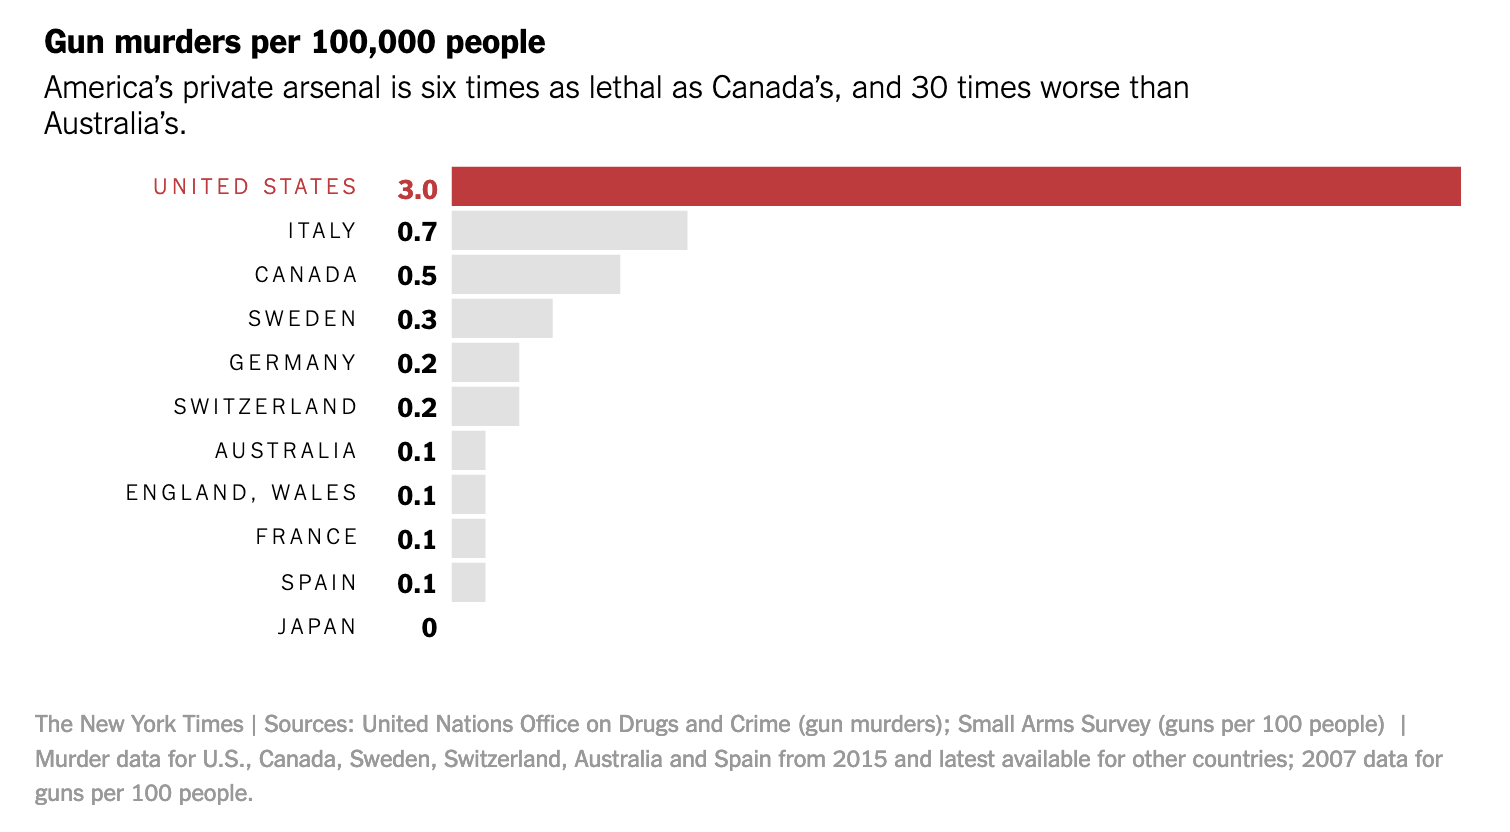
If I was posting this chart from the New York Times article “How to Reduce Shootings” on social media I would include a link to the article and write this alt text:
如果我是在社交媒体上发布《纽约时报》文章“ 如何减少枪击事件 ”中的图表,则将包括该文章的链接并撰写以下替代文字:

复杂图表替代文字示例 (Complex chart alt text example)
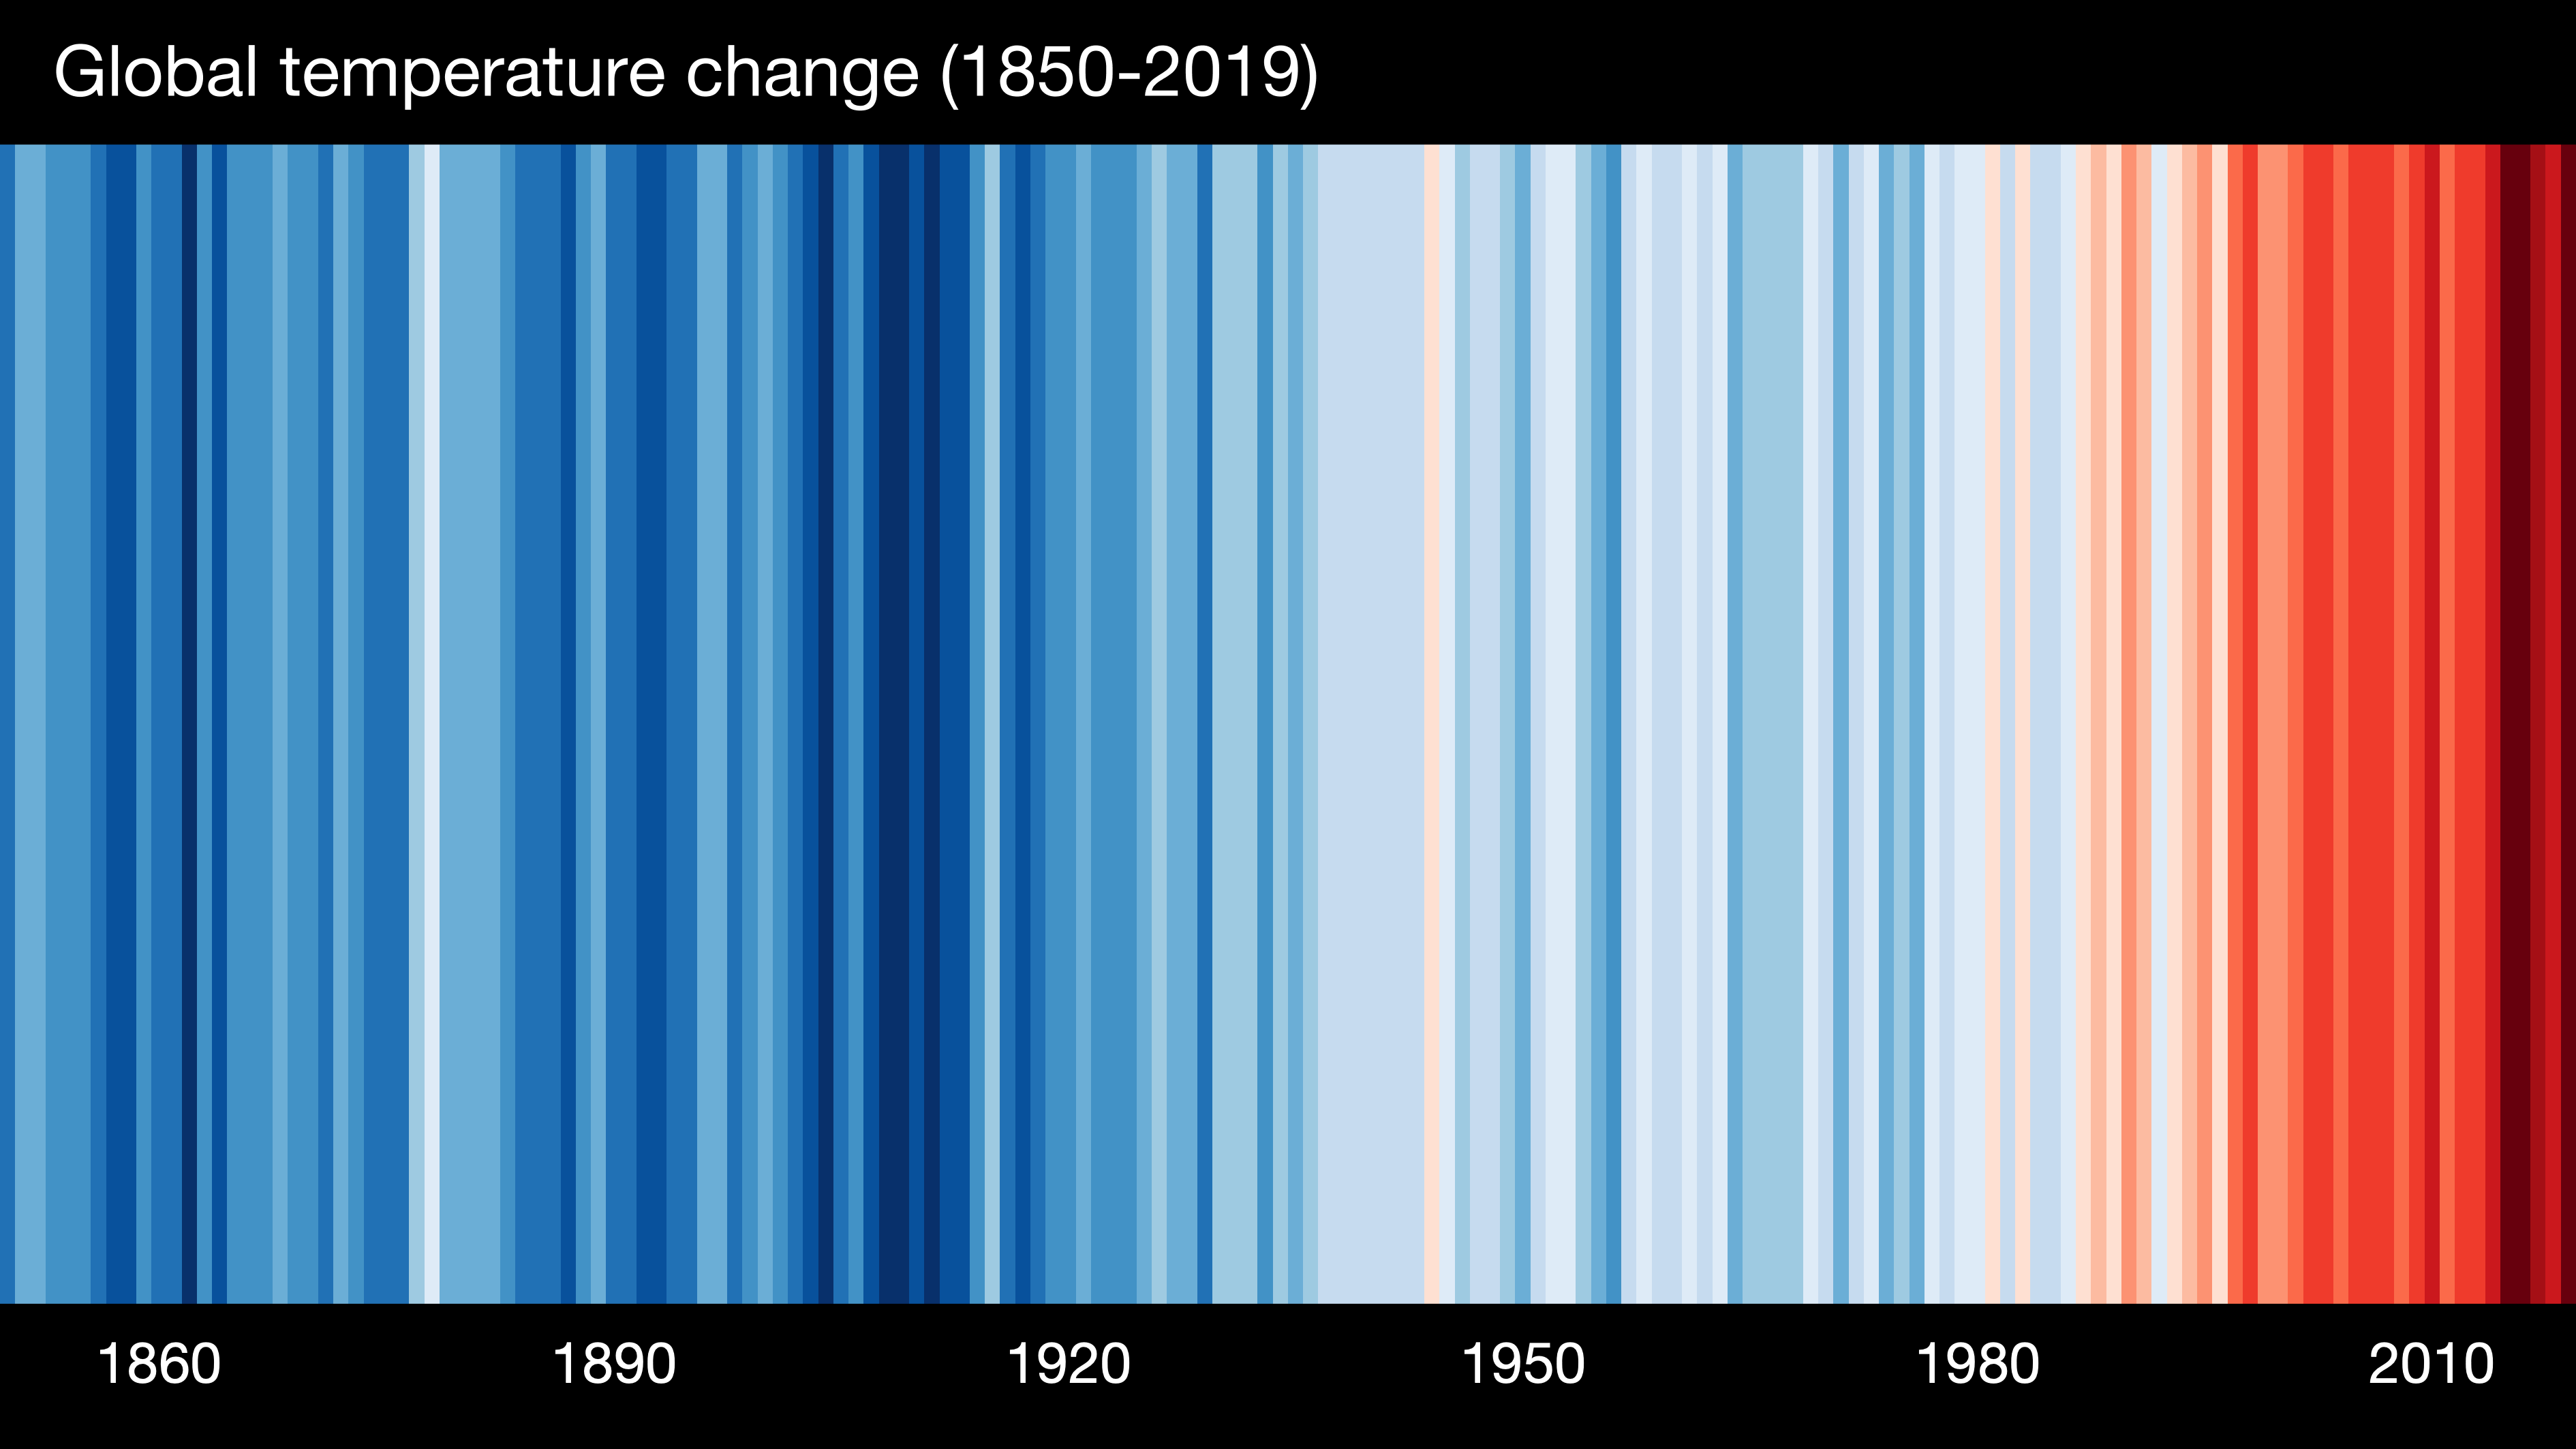
If I was posting a less typical chart type like the Warming Stripes from Ed Hawkins, I would include a link to the source and focus on the meaning behind them for the alt text:
如果我发布的是不太典型的图表类型,例如Ed Hawkins的Waring Stripes ,那么我将包括指向源的链接,并着重关注alt文本背后的含义:

如何添加替代文字 (How to add alt text)
在HTML代码中 (In HTML code)
Add alt text alt="" to any image that adds meaning inside the image tag <img>. Add a long description longdesc="" when possible.
将alt文本 alt=""添加到任何在图像标签<img>内添加含义的图像。 如果可能,添加长描述 longdesc="" 。
在推特上 (On Twitter)
When you add an image, use the add description button or +alt. Twitter has full instructions.
添加图像时,请使用添加描述按钮或+ alt 。 Twitter有完整的说明 。


在Instagram上 (On Instagram)
Instagram hides the alt text functionality, but there is documentation on how to add alt text.
Instagram隐藏了替代文本功能,但是有关于如何添加替代文本的文档 。
Choose a filter and edit the image, then tap Next.
选择一个过滤器并编辑图像,然后点击下一步 。
Tap Advanced Settings at the bottom of the screen.
点击屏幕底部的高级设置 。
Tap Write Alt Text.
点击写替代文本 。
在Microsoft Office产品中 (In Microsoft Office Products)
Microsoft Office has a variety of ways that you can add alt text depending on which program and what version you are using. However, they have extensive documentation on how to add alt text.
Microsoft Office有多种方式,您可以根据所使用的程序和所使用的版本来添加替代文本。 但是,他们有大量有关如何添加替代文本的文档 。
在中等 (On Medium)
Click on the image in the post. Use the “Alt text” label to write your text.
点击帖子中的图片。 使用“替代文字”标签来写您的文字 。

By writing effective alternative text or alt text and including it when you publish data visualization you provide a way for people who cannot see the image to understand the content so they are not missing out on critical information. Having alt text is necessary in order for the visual content to be accessible.
通过编写有效的替代文本或替代文本,并在发布数据可视化时将其包括在内,可以为看不见图像的人提供一种理解内容的方式,从而使他们不会错过重要信息。 为了使视觉内容可访问,必须具有替代文本。
其他阅读 (Other reading)
替代文字 (Alt text)
Web Accessibility Tutorials: Complex images| W3C
Web无障碍教程:复杂图像 | W3C
Alt Text & Accessibility | Web Aim
替代文字和辅助功能 | 网络目标
How to Write Great Image Alt Text | Catherine McNally
如何编写出色的图像替代文字 凯瑟琳·麦克纳利
The Right Way to Write Alt Text | Natalie Gotko
写替代文本的正确方法 娜塔莉(Natalie Gotko)
数据可视化的可访问性 (Accessibility for Data Viz)
Data Visualization Accessibility: Where Are We Now, and What’s Next? | Melanie Mazanec
数据可视化可访问性:我们现在在哪里,下一步是什么? | 梅兰妮·马扎内克(Melanie Mazanec)
Why Accessibility Is at the Heart of Data Visualization | Doug Schepers
为什么可访问性是数据可视化的核心 道格·谢珀斯(Doug Schepers)
An intro to designing accessible data visualizations | Sarah L. Fossheim
设计可访问数据可视化的简介 | 莎拉·福斯海姆(Sarah L.Fossheim)
5 easy ways to make your data visualization more accessible | Amy Cesal
Thank you to Doug Schepers and Zander Furnas for reviewing
感谢 Doug Schepers 和 Zander Furnas 的评论
Correction: The article previously stated that screen readers cut off reading alt text at 125 characters. This is outdated information and has been revised. Thanks to Zoë Bijl and Kevin White for the update.
改正 :先前文章指出 屏幕阅读器截断了125个字符的替代文本 。 这是 过时的信息 ,已经过修订。 感谢 ZoëBijl 和Kevin White的更新。
Amy Cesal is a designer specializing in data visualization. She is a co-founder of the Data Visualization Society and currently serves on the board. Amy is passionate about building style guidelines for data visualization, trying to make everything, including charts, accessible, creating bespoke data visualization and experimenting with the boundaries between data and art. She holds a masters in Information Visualization from MICA.
艾米·塞萨尔 ( Amy Cesal) 是一位专门从事数据可视化的设计师。 她是数据可视化协会的联合创始人,目前担任董事会成员。 艾米(Amy)对建立数据可视化样式指南充满热情,力求使包括图表在内的所有内容都可访问,创建定制的数据可视化并尝试数据与艺术之间的界限。 她拥有MICA的信息可视化硕士学位。

翻译自: https://medium.com/nightingale/writing-alt-text-for-data-visualization-2a218ef43f81
如何编写数据库可视化界面


 5169
5169

 被折叠的 条评论
为什么被折叠?
被折叠的 条评论
为什么被折叠?
 到【灌水乐园】发言


