


By Analiz Cabrera & Sindhu Srinath
由Analiz Cabrera和Sindhu Srinath
“No two leaves are alike, and yet there is no antagonism between them or between the branches on which they grow” — Gandhi
“没有两片叶子是相似的,但是它们之间或它们生长的树枝之间没有拮抗作用” –甘地
United States, one of the most powerful countries in the world, has a diverse group of people from different races, ethnicities, gender and class since decades. The legend of America to us has been the land where dreams come true, where working hard will let you rise with endless possibilities.
几十年来,美国是世界上最强大的国家之一,拥有不同种族,不同种族,不同性别和不同阶层的人。 美国的传奇故事一直是梦想成真的地方,在这里努力工作将使您拥有无限的可能。
We are two immigrants who came to the United States full of hope, strongly believing in education to aim higher and for better opportunities. Having recently graduated with a Master’s degree in Supply Chain from MIT, we had a different view of the social dynamics in this country and it was not close to what we envisioned when we immigrated.
我们是两个满怀希望地来到美国的移民,他们坚信教育要以更高的目标和更好的机会为目标。 最近从麻省理工学院获得了供应链硕士学位后,我们对这个国家的社会动态有了不同的看法,这与我们移民时的设想并不相符。
If the United Stated is one of the strongest economies in the world, why there are large disparities in income across the population? According to the World Bank and American Census data, the United States has the highest income inequality among the G7 countries. With this in mind and with our engineering lenses on, we decided to dig into the data and apply the skills of machine learning we learnt at MIT to identify the features that could predict income inequality in the United States at the state and county level.
如果美国是世界上最强大的经济体之一,为什么整个人口的收入差距很大? 根据世界银行和美国人口普查数据,在七大工业国中,美国的收入不平等程度最高。 考虑到这一点并考虑到我们的工程学观点,我们决定对数据进行挖掘,并运用在麻省理工学院学到的机器学习技能,以确定可以预测美国州和县级收入不平等的特征。
To measure and compare income inequality, we used the gini index. The index ranges from 0 to 1, where 1 indicates that one person makes all the income within a group and 0 indicates perfect equality. While we think that aiming for perfect equality is not necessarily the target, the United States has potential to reduce its current index (0.47) when compared to the average index (0.33) among the G7 countries.
为了测量和比较收入不平等,我们使用了基尼系数。 索引范围是0到1,其中1表示一个人在一个组中获得所有收入,0表示完全平等。 尽管我们认为追求完全平等不一定是目标,但与七国集团国家的平均指数(0.33)相比,美国有潜力降低其当前指数(0.47)。
For our modeling, we hypothesized that factors such as demographics, race, education, and federal & state spend in education would have the potential in being predictors of income inequality in the United States. Why? Because we started with a personal premise that education helps to overcome income inequality. The amount the Federal government and States spend on education contributes to increasing the number of people with higher education, and the diversity of races in the United States makes the social system more complex.
对于我们的模型,我们假设人口统计,种族,教育以及联邦和州在教育方面的支出等因素有可能成为美国收入不平等的预测因素。 为什么? 因为我们从个人前提开始,认为教育有助于克服收入不平等。 联邦政府和各州在教育上的支出有助于增加接受高等教育的人数,并且美国种族的多样化使社会制度更加复杂。
With our modeling, we wanted to understand income inequality by analyzing the data to identify the most accurate predictors among those stated above. We did not aim to answer why income inequality exists, suggest measures on how to fix it or critic the current situation. We are conscious that the answers to “why” and “how” of it would involve a more complex approach and giving a critic would require profound knowledge on the subject beyond digging data and running algorithms.
通过我们的建模,我们希望通过分析数据以找出上述预测中最准确的预测因素来理解收入不平等。 我们的目的不是要回答为什么收入不平等存在,没有提出解决该问题的措施,也没有批评当前的状况。 我们意识到,对“为什么”和“如何”的答案将涉及更复杂的方法,而给予批评家不仅需要挖掘数据和运行算法,还需要对该主题的深入了解。
Ahead of us sharing all the details, let us reveal our main finding: Race features predict income inequality with higher accuracy than education level, federal and state spending or other demographic elements. Specifically, we found that based on the proportion of black and white population within a state, the machine learning model could predict if the state is above the median of income inequality or below with an accuracy of 96%.
在我们共享所有细节之前,让我们揭示一下我们的主要发现:种族特征比收入水平,联邦和州支出或其他人口统计要素具有更高的预测收入不平等的准确性。 具体来说,我们发现,基于一个州内的黑人和白人人口比例,机器学习模型可以预测该州是否高于收入不平等的中位数或低于收入不平等的中位数,准确度为96%。
Our utopian view was proven wrong by our model — we over estimated education as the main predictor of inequality in the United States.
我们的模型证明了我们的乌托邦主义观点是错误的-我们过度估计教育是美国不平等的主要预测因素。
Before we move into the prediction model and results, we want to share with you some insights about the population characteristics in the country. We really hope you learn as much as we did but most importantly we expect these facts increase awareness and ideally lead to informed action.
在进入预测模型和结果之前,我们想与您分享有关该国人口特征的一些见解。 我们确实希望您能像我们一样学到很多东西,但是最重要的是,我们希望这些事实能够提高人们的意识,并理想地采取明智的行动。
我们通过分析数据学到了什么 (What we learned by analyzing the data)
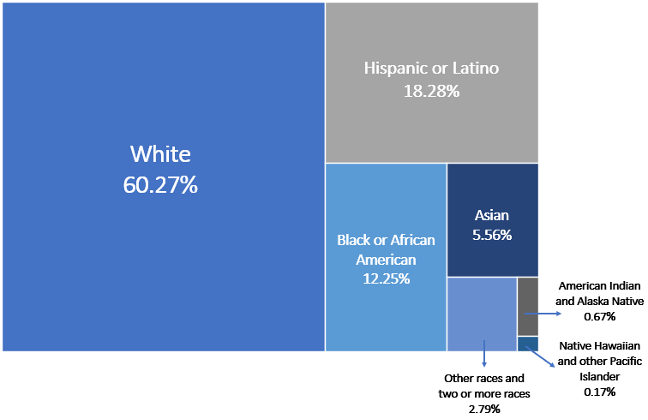
1. Hispanic or Latinos are the largest minority in the United States, representing 18% of the total population. They are also one of the minorities with lower percentage of population with higher education[1].
1.西班牙裔或拉丁美洲裔是美国最大的少数民族,占总人口的18%。 他们也是受高等教育程度较低的少数群体之一[1] 。
[1] Population with Bachelor’s degree or higher
[1]本科以上学历的人口
According to the Census data, in 2018, the United States had ~330M inhabitants in which the Hispanic and/or Latino constituted 18.3% with Black population not far behind with ~40M people. ~5% of the population were Asians and the remaining ~4% were other races, American Indians & Alaska natives, and Native Hawaiian & other Pacific Islanders (Figure 1).
根据人口普查数据,2018年,美国有约3.3亿居民,其中西班牙裔和/或拉丁裔占18.3%,黑人人口约有4000万,紧随其后。 约5%的人口是亚洲人,其余约4%是其他种族,美洲印第安人和阿拉斯加人,以及夏威夷土著人和其他太平洋岛民(图1)。
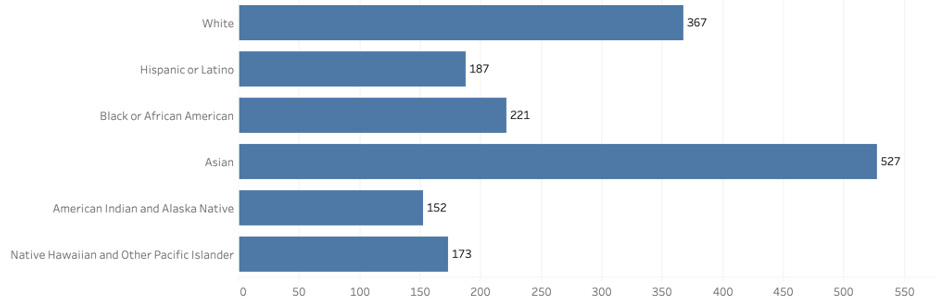
2. Asians[2] have the highest percentage of population with higher education within their race
2.亚洲人[2]在其种族中受过高等教育的人口比例最高
[2] Includes Far East, Southeast Asia, and the Indian subcontinent
[2]包括远东,东南亚和印度次大陆
We divided the number of people with higher education[1] by the total population of age 25 or over per race and further extracted this number per 1,000 (Figure 2).
我们将受高等教育的人数[1]除以每个种族的25岁或以上的总人口,并进一步从每千人中提取该人数(图2)。
We noted that Asians, although constituted only a ~5% of the share in the population, were the most educated[1] with 527 per 1000 people. Furthermore, they represented 10% of the total educated population[1].
我们注意到,尽管亚洲人只占总人口的5%,但受教育程度最高[1] ,每千人中有527人。 此外,他们占总受教育人口的10% [1] 。
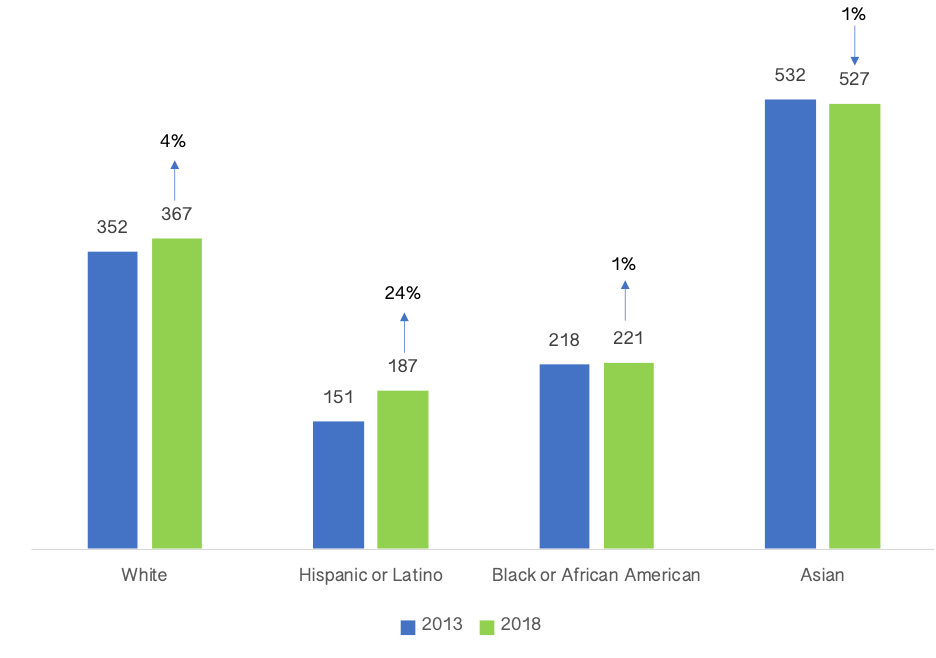
After Asians, the Black population was the second most educated[1] minority (Figure 3), representing 9% of the total educated population; However, for every 1,000 educated White there were only~600 educated black.
仅次于亚洲人,黑人人口是受教育程度第二高的少数群体[1] (图3),占总受教育人口的9%; 但是,每千名受过教育的白人中,只有约600名受过教育的黑人。
For Hispanic and Latinos, the number of educated people was lower, with only 187 per 1,000. They represented 10% of the total educated people and compared to the White population, there were only ~500 Latinos educated per 1,000 White. Although, in the last 5 years, it is this very section of race that has shown highest growth in number of educated people with an increase of 24% between 2013 and 2018 (Figure 3).
对于西班牙裔和拉丁裔,受教育的人数较少,每千人中只有187人。 他们占受过教育的总人数的10%,与白人人口相比,每千名白人中只有约500名拉丁裔受过教育。 尽管在过去的五年中,种族的这一部分显示了受教育人数的最高增长,在2013年至2018年之间增长了24%(图3)。
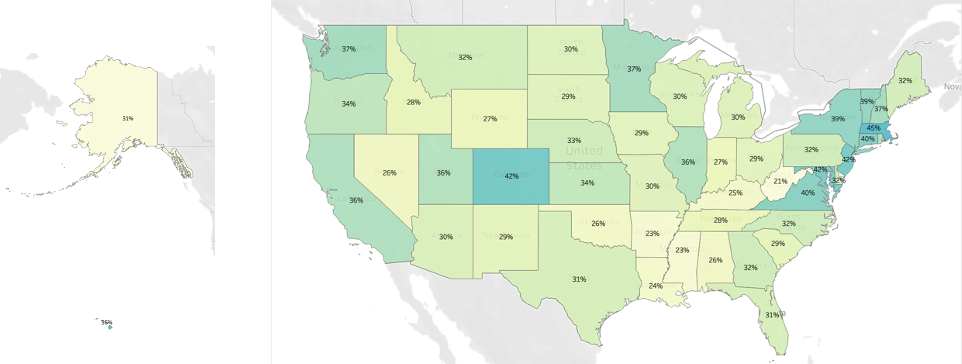
3. Massachusetts has the largest percentage of population with higher education (45%) and West Virginia the lowest (21%); both states are above the median of income inequality
3.马萨诸塞州受高等教育的人口比例最高(45%),而西弗吉尼亚州最低(21%); 两个州都高于收入不平等的中位数
Based on data from 2018, 33% of the US population over the age of 25 are educated with a bachelor’s degree or higher. Between 2013 and 2018, this increased around 4% in total. However, the spread of population with higher education is not even across the United States.
根据2018年的数据,美国25岁以上的人口中,有33%受过本科以上学历。 在2013年至2018年期间,这一数字总计增长了约4%。 但是,受过高等教育的人口甚至不在美国各地传播。
The Northeast region was above the national average of population, while 70% of the southern states were below average. The graph below shows the spread of population with higher education between states.
东北地区高于全国人口平均水平,而南部各州的70%低于平均水平。 下图显示了各州之间受高等教育程度的人口分布。
In addition, Federal and state education spend per student has increased 23% in the last 5 years but inequality has remained almost constant.
此外,在过去的5年中,联邦和州每名学生的教育支出增加了23%,但不平等现象几乎保持不变。
预测模型和结果 (Prediction model and results)
To create the prediction model, we used supervised machine learning algorithms in Python, therefore the algorithms learned from a pre-labeled training dataset.
为了创建预测模型,我们在Python中使用了监督式机器学习算法,因此该算法是从预先标记的训练数据集中学习的。
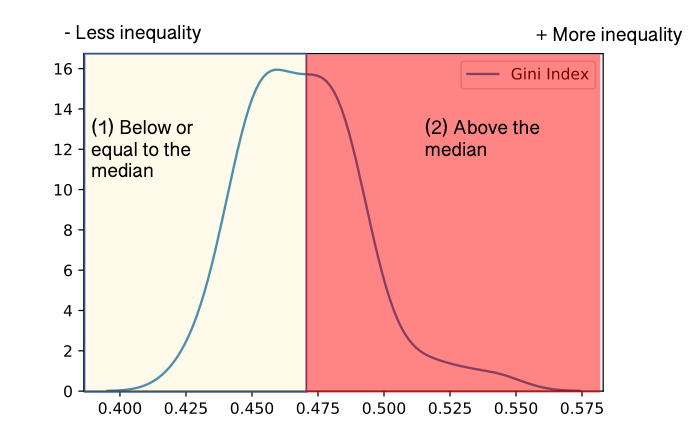
We input data of every feature from 2015 to 2018 at the state & county level and defined two categorical targets (Figure 5):
我们输入了2015年至2018年各州和县级地图项的数据,并定义了两个分类目标(图5):
(1) Below or equal to the median: States or counties are classified in this category, if their Gini index is below or equal to the national median
(1)低于或等于中位数:如果州或县的基尼系数低于或等于全国中位数,则归为此类
(2) Above the median: States or counties are classified in this category, if their Gini index is above the national median
(2)高于中位数:如果州或县的基尼系数高于全国中位数,则归为此类
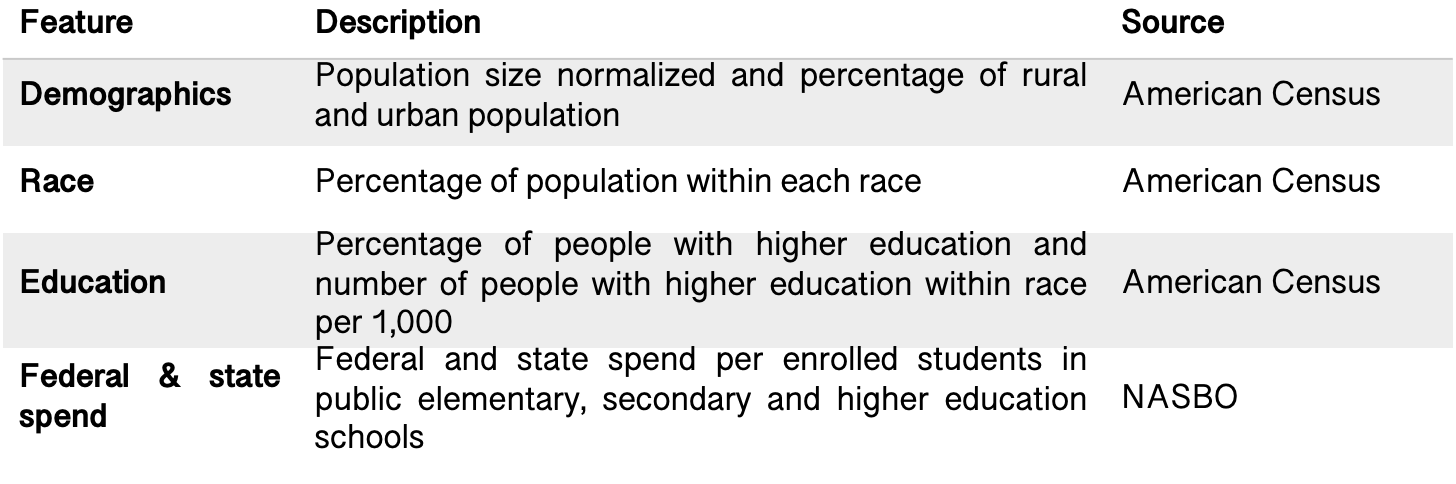
As mentioned before, the features considered were related to demographics, race, education, and federal & state spend in education (Table 1).
如前所述,考虑的功能与人口统计,种族,教育以及联邦和州在教育方面的支出有关(表1)。
We randomly split the dataset into training & testing data to run the algorithms with different combinations of features. We compared the performance among them based on the testing accuracy.
我们将数据集随机分为训练和测试数据,以运行具有不同特征组合的算法。 我们根据测试准确性比较了其中的性能。
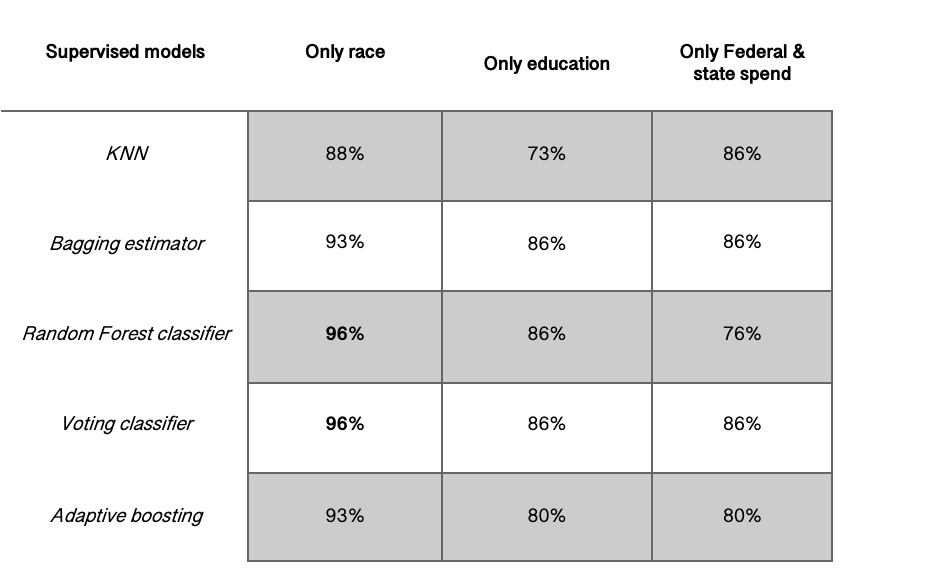
The accuracy of the models (Table 2) showed that a voting or random forest classifier considering only race features, predicted income inequality with the highest test accuracy — 96%.
模型的准确性(表2)表明,仅考虑种族特征的投票或随机森林分类器,预测的收入不平等性最高,测试准确性为96%。
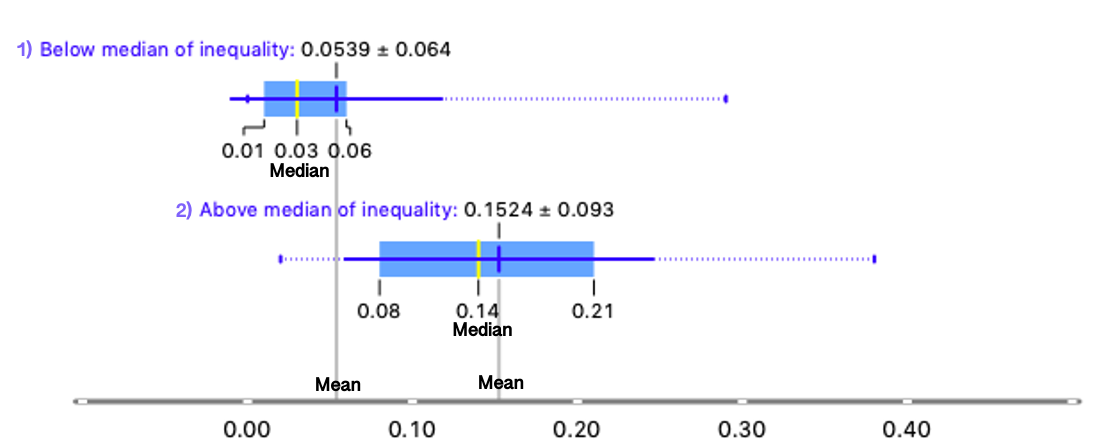
We reviewed in more detail the effect of the distinct races on the prediction. We identified the percentage of black and white population as the races that impacted the most on the classification of the states.
我们更详细地回顾了不同种族对预测的影响。 我们将黑人和白人人口百分比确定为对州分类影响最大的种族。
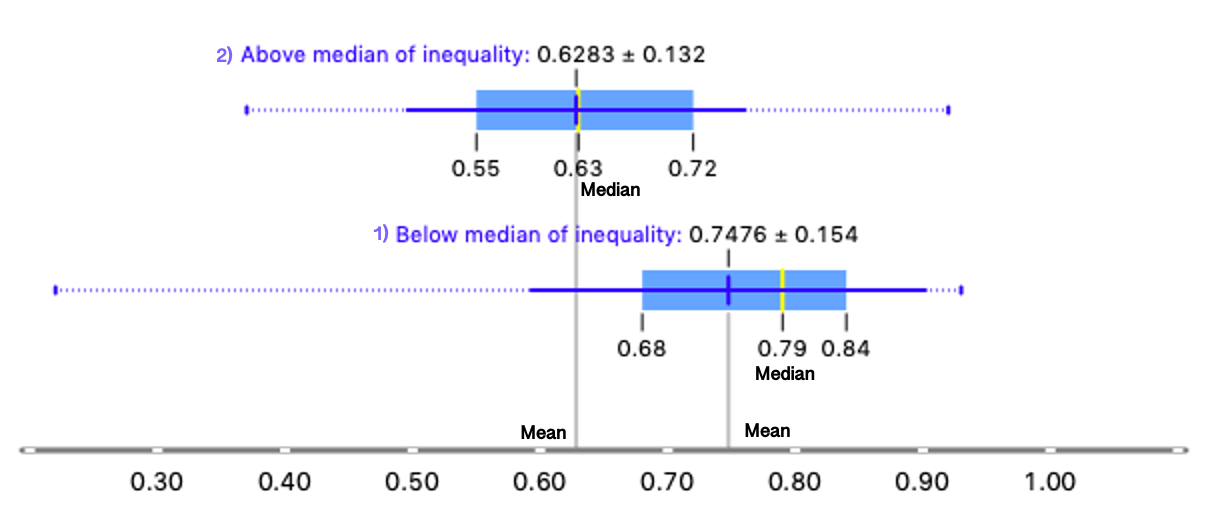
As seen in Figure 6, the states with more inequality — (2) Above the median of inequality — had a higher percentage of black population, with at least 8%.
如图6所示,不平等程度更高的州(2)在不平等的中位数以上,黑人人口比例更高,至少为8%。
The opposite happened if the states had a higher percentage of white population (Figure 7). The higher the percentage of white population, the lower the probability for inequality.
如果各州的白人人口比例较高,则情况恰恰相反(图7)。 白人人口百分比越高,发生不平等的可能性越低。
The results we gathered are consistent to the current social concerns in the United States and even while we were aware of it, by reading the news, and through conversations with our friends and professional circles, having the data depicting reality was a wake-up call.
我们收集的结果与美国当前的社会关注点保持一致,即使我们知道了这一点,通过阅读新闻以及与我们的朋友和专业圈子的对话,拥有描述现实的数据也是一个警钟。 。
We know governments, corporations, educational institutions and other social entities are working to transform for the better. We hope the actions they are taking focus on bringing tangible solutions, however we believe that is also on us to take a stance, to contribute in a way that matters, to look beyond ourselves, and work towards the country we dream it to be.
我们知道政府,公司,教育机构和其他社会实体正在努力使自己变得更好。 我们希望他们采取的行动集中于提供切实的解决方案,但是我们也相信,我们也必须采取立场,以重要的方式做出贡献,超越自我,朝着我们梦想中的国家努力。


 被折叠的 条评论
为什么被折叠?
被折叠的 条评论
为什么被折叠?
 到【灌水乐园】发言


