


python中的sma
In one of my previous posts, I talked about the SMA strategy and its application to the stock market. I showed the reader how to create the strategy in python, graph the results, as well as see the date of the price of the buy or sell option.
在我以前的一篇文章中,我谈到了SMA策略及其在股市中的应用。 我向读者展示了如何在python中创建策略,绘制结果图形以及查看买入或卖出期权价格的日期。
Today, I’ll show you how I implemented the SMA strategy with web scraping to save new information to our pre-existing file and graph the new data.
今天,我将向您展示如何通过网络抓取实施SMA策略,以将新信息保存到我们现有的文件中并以图形方式绘制新数据。
DISCLAIMER: Stocks can be risky and it is very possible to lose money. I have not used this strategy to make any financial gains, investments, or purchases. I do not recommend you read this article and use the strategy for your own investment purposes and/or financial gain. I am not responsible for your losses if you choose to use this. The strategy below is only an experiment.
免责声明:股票可能具有风险,很可能会亏损。 我没有使用这种策略来获得任何财务收益,投资或购买。 我不建议您阅读本文,并出于自己的投资目的和/或财务收益而使用该策略。 如果您选择使用此方式,我对您的损失不承担任何责任。 以下策略只是一个实验。
I combined the graphing and SMA strategy into one cell that takes in the csv information and creates new SMA30 and SMA100 information. The function works with any stock no matter the price.
我将制图和SMA策略合并到一个单元中,该单元接收csv信息并创建新的SMA30和SMA100信息。 该功能适用于任何库存,无论价格如何。

The strategy is a nested function inside the graphing function.
该策略是图形函数内部的嵌套函数。

We store all the information into variables just like before.
我们像以前一样将所有信息存储到变量中。

Now we graph it again. These lines of code are all in one cell so it is easier to run and saves time when in the notebook.
现在,我们再次对其进行绘图。 这些代码行全部集中在一个单元中,因此在笔记本电脑中更易于运行并节省时间。

The web scraping process is tedious and repetitive, but necessary so you do not have to re-download new csv files every day. The function will scrape 5 days of past information, so if you miss the sixth day, your table will be missing a day’s information and throw off your graph. I realize this is very important to prevent and a future goal is to run the web scraping code for the stocks every hour on the hour to prevent any missing data.
Web抓取过程繁琐且重复,但是有必要,因此您不必每天重新下载新的csv文件。 该函数将抓取5天的过去信息,因此,如果您错过了第六天,则表格将丢失某天的信息,从而使图表丢失。 我意识到这非常重要,并且未来的目标是每小时每小时对库存运行一次网络抓取代码,以防止丢失任何数据。
The web scraping function is named new_data and takes in the argument stock_name. The stock name must be the abbreviation for the company, not the company name. Example: AAPL is Apple, WMT is Walmart Inc, and TSLA is Tesla. The page requests the historical data from the desired stocks page and after some filtering, finds the row of the desired prices. There are patterns in the formatting of the dates and prices, so identifying these and using them to our advantage made scraping much easier.
Web抓取函数名为new_data,并接受参数stock_name。 股票名称必须是公司的缩写,而不是公司名称。 示例:AAPL是Apple,WMT是Walmart Inc,TSLA是Tesla。 该页面从所需的股票页面请求历史数据,经过一些过滤后,找到所需价格的行。 日期和价格的格式中有多种模式,因此识别它们并利用它们对我们有利便使抓取变得容易得多。
I scraped five dates, but will show you two, as the only differences are the variable names and indexes.
我抓取了五个日期,但将向您展示两个日期,因为唯一的区别是变量名称和索引。

The date in the column index always went up by 7, the open_price column index went up by 7, and adj_close_price index also went up by 7. the quoted numbers in red next to open_price and adj_close_price always went up by 15.
列索引中的日期始终增加7,open_price列索引中的日期增加7,而adj_close_price索引中的日期也增加7。open_price和adj_close_price旁边的红色引号始终增加15。

Extracting the price proved more challenging than expected because it did not have a title. I used string manipulation and regular expression manipulation to exclude characters that were undesirable. I excluded more characters than needed sometimes because a stock like Tesla has more characters than a stock like Pfizer. The third, fourth, and fifth date information followed the same pattern as the first and second date’s information.
由于没有标题,因此提取价格比预期的更具挑战性。 我使用字符串操作和正则表达式操作来排除不需要的字符。 有时我排除了多余的字符,因为特斯拉这样的股票比辉瑞这样的股票要多。 第三,第四和第五日期信息遵循与第一和第二日期信息相同的模式。
Now that I have the five dates of information, I can create a new dataframe that we can soon concat to our preexisting data.
现在,我已经掌握了五个日期的信息,我可以创建一个新的数据框,以便我们可以很快将其与现有数据结合起来。

For easier access, I created an input function so it is easier to access the stocks you want to see.
为了更轻松地访问,我创建了一个输入功能,以便更轻松地访问您要查看的股票。

After inputing the stock name, the web scraping function pulls the information.
输入股票名称后,网络抓取功能将提取信息。

We change the datetime format because scraping grabs the time. We do not want the time because the csv file does not download with the time.
由于抓取会占用时间,因此我们更改了日期时间格式。 我们不需要时间,因为csv文件不会随时间下载。

We change the ‘Date’ type to datetime so it can concatenate with the preexisting csv file.
我们将“日期”类型更改为日期时间,以便它可以与先前存在的csv文件连接。

Next we read in our csv file and make sure its ‘Date’ type is in datetime.
接下来,我们读取csv文件并确保其“日期”类型为datetime。


We combine our newly web scraped data with our previous data to get a new table.
我们将新的Web抓取的数据与以前的数据结合起来以得到一个新表。
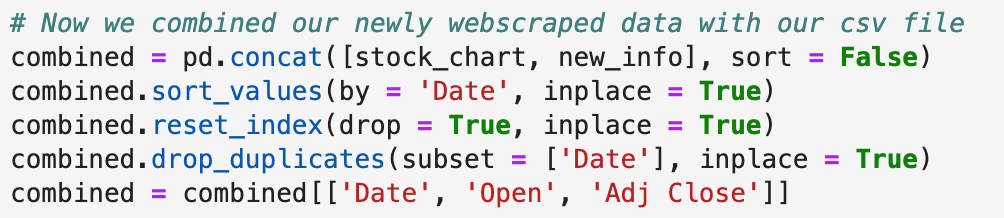
Now that we have new information, we want to save it for when we graph. We’re going to save the file as the stock name we entered in the beginning as a csv file.
现在我们有了新的信息,我们希望在绘制图形时将其保存。 我们将把该文件另存为我们在开头输入的csv文件的股票名称。

Now that we saved our new file it’s time to graph.
现在我们保存了新文件,是时候绘制图表了。


So in one cell it looks like this:
因此,在一个单元格中,它看起来像这样:

When you run this it prompts a text box where you enter the stock name. As long as you have the stock downloaded where you are running your notebook, it will run.
运行此命令时,将提示您在其中输入股票名称的文本框。 只要将股票下载到了运行笔记本的位置,它就会运行。
This is a continuation of my previous post and have more future goals for this project. I combined a lot of information in the beginning of this post from the previous one, so if something is confusing, you can find the post here https://medium.com/analytics-vidhya/sma-short-moving-average-in-python-c656956a08f8
这是我以前的文章的延续,并且对该项目有更多的未来目标。 在上一篇文章的开头,我结合了很多信息,因此,如果有什么令人困惑的地方,您可以在这里找到该文章https://medium.com/analytics-vidhya/sma-short-moving-average-in -python-c656956a08f8
Again, the strategy used here is not 100% correct and that is important information going into any trade. This is only an experiment and should be looked at as such.
同样,此处使用的策略并非100%正确,这是进入任何交易的重要信息。 这只是一个实验,应该这样看。
翻译自: https://medium.com/swlh/sma-short-moving-average-in-python-continued-802b4902b76b
python中的sma


 5832
5832

 被折叠的 条评论
为什么被折叠?
被折叠的 条评论
为什么被折叠?
 到【灌水乐园】发言


