


 本文探讨了微服务架构下的可观察性概念,利用Zipkin和Spring Cloud Sleuth实现服务间跟踪,展示如何通过trace ID和span ID监测系统性能及异常,确保应用健壮性。
Ever since microservices are increasing in demand and every organization focuses on a microservices architecture.
自从微服务需求增长以来,每个组织都致力于微服务架构。
什么是微服务可观察性? (What is Microservice Observability?)
In general terms, it is the ability to observe all the behaviors be it a success, failure, or exception. If we have observed all the behaviors, then we can act accordingly to solve those issues and make the application more robust and fault-tolerant.
一般而言,它是观察所有行为的能力,无论是成功,失败还是异常。 如果我们观察到了所有行为,那么我们可以采取相应措施解决这些问题,并使应用程序更加健壮和容错。
For Ex: Security Cameras record all the activities of a day. When there is an unusual activity, security cameras are thoroughly observed and we will come to a conclusion on suspicious activity on a particular period of time.
例如:安全摄像机记录一天的所有活动。 当发生异常活动时,将对安全摄像机进行彻底观察,我们将得出在特定时间段内可疑活动的结论。
Key Concepts of Observability
可观察性的关键概念
- Metrics:- Stats around the microservices to understand what happened around it over a period of time. 指标:-微服务周围的统计信息,以了解一段时间内发生的事情。
- Logging:- They help in analyzing what is happing around the system whether the requests are successful, failure, or exception. 日志记录:-它们有助于分析请求成功,失败还是异常时围绕系统的内容。
- Tracing:- In a microservice ecosystem, a workflow/request can talk to multiple services. So tracing helps us to track the workflow in a productive way. 跟踪:-在微服务生态系统中,工作流/请求可以与多个服务对话。 因此,跟踪有助于我们高效地跟踪工作流程。
如何在微服务生态系统中实现所有这些目标? (How to achieve all these in micro-service ecosystem?)
I am going to explain in spring boot how to achieve observability using Zipkin and spring cloud sleuth. For this, we go over a use case spread across different microservices.
我将在Spring Boot中解释如何使用Zipkin和Spring Cloud Sleuth实现可观察性。 为此,我们遍历了跨不同微服务的用例。
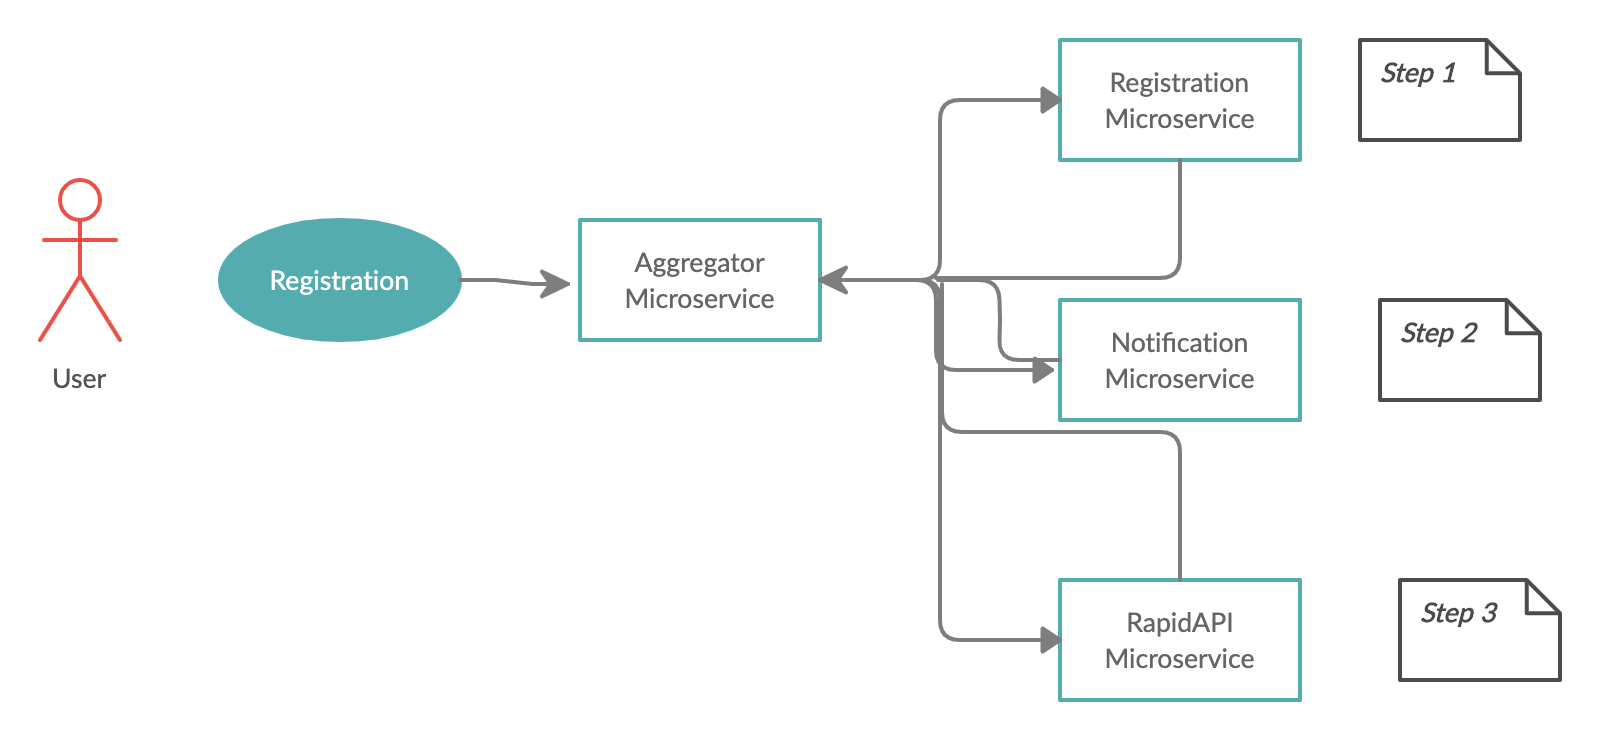
I have created a simple use case in aggregator mode. In the above diagram, we have a user registration use case spread across different service calls.
我已经在聚合器模式下创建了一个简单的用例。 在上图中,我们有一个用户注册用例,分布在不同的服务调用中。
This might be a simple use case but I have made it look complex so that we can trace the workflow/request.
这可能是一个简单的用例,但我使它看起来很复杂,因此我们可以跟踪工作流/请求。
Aggregator Service:- This service will make multiple service calls and aggregate the response to the caller.
聚合服务 :-此服务将进行多个服务调用,并将响应聚合到调用方。
Registration Service:- This service will register the user to the backend system and return the response to the caller here it is an aggregator service.
注册服务:-此服务将用户注册到后端系统,并将响应返回给调用方,此处是聚合服务。
Notification Service:- This service will trigger either an email or SMS after successful registration for the user.
通知服务:-为用户成功注册后,此服务将触发电子邮件或SMS。
RapidAPI Service:- This service will call some additional information after successful registration like tips, a fortune of the day. I am using RapidAPI for the same.
RapidAPI服务:-成功注册后,此服务将调用一些其他信息,例如提示,这是当下的财富。 我也使用RapidAPI。
使用Zipkin (Use of Zipkin)
Zipkin was originally developed at Twitter, based on a concept of a Google paper that described Google’s internally-built distributed app debugger dapper. It manages both the collection and lookup of this data. To use Zipkin, applications are instrumented to report timing data to it.
Zipkin最初是在Twitter上开发的,基于Google论文的概念,该论文描述了Google内部构建的分布式应用程序调试器dapper。 它管理此数据的收集和查找。 要使用Zipkin,将对应用程序进行检测以向其报告计时数据。
It helps in monitoring application latency by checking the traces of application logs. These traces backed by chronology order will help in analyzing the overall system performance and helps in identifying the piece which has latency.
它通过检查应用程序日志的跟踪来帮助监视应用程序延迟。 这些按时间顺序排列的迹线将有助于分析整体系统性能,并有助于识别具有延迟的部分。
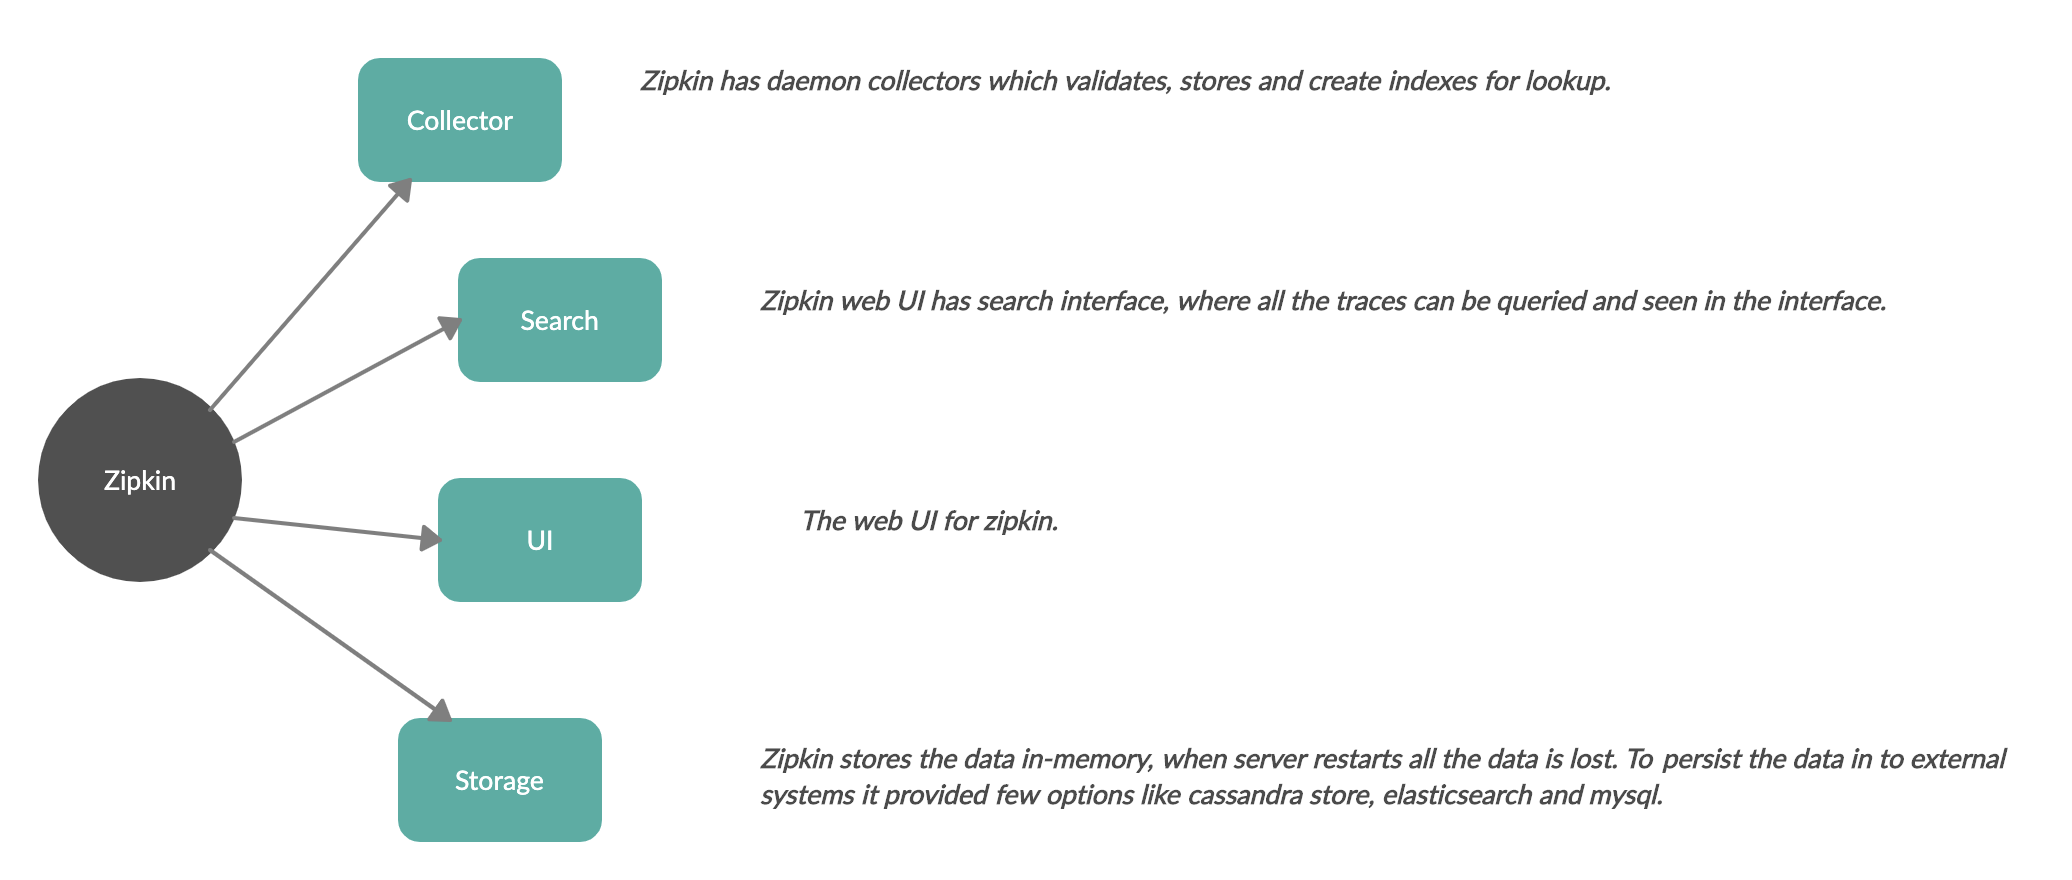
Zipkin has four components.
Zipkin具有四个组成部分。
How to install Zipkin?
如何安装Zipkin?
Zipkin can be installed in a standalone way or through a docker container. Please see the details here.
Zipkin可以独立安装,也可以通过docker容器安装。 请在这里查看详细信息。
For the demo purpose, I have chosen a standalone way to download the jar and start as a java process. The jar here is a spring boot application.
出于演示目的,我选择了一种独立的方式来下载jar并将其作为Java进程启动。 这里的jar是Spring Boot应用程序。
java -jar <zipkin-jar-version>After executing the above command, the Zipkin should start.
执行上述命令后,Zipkin应该启动。
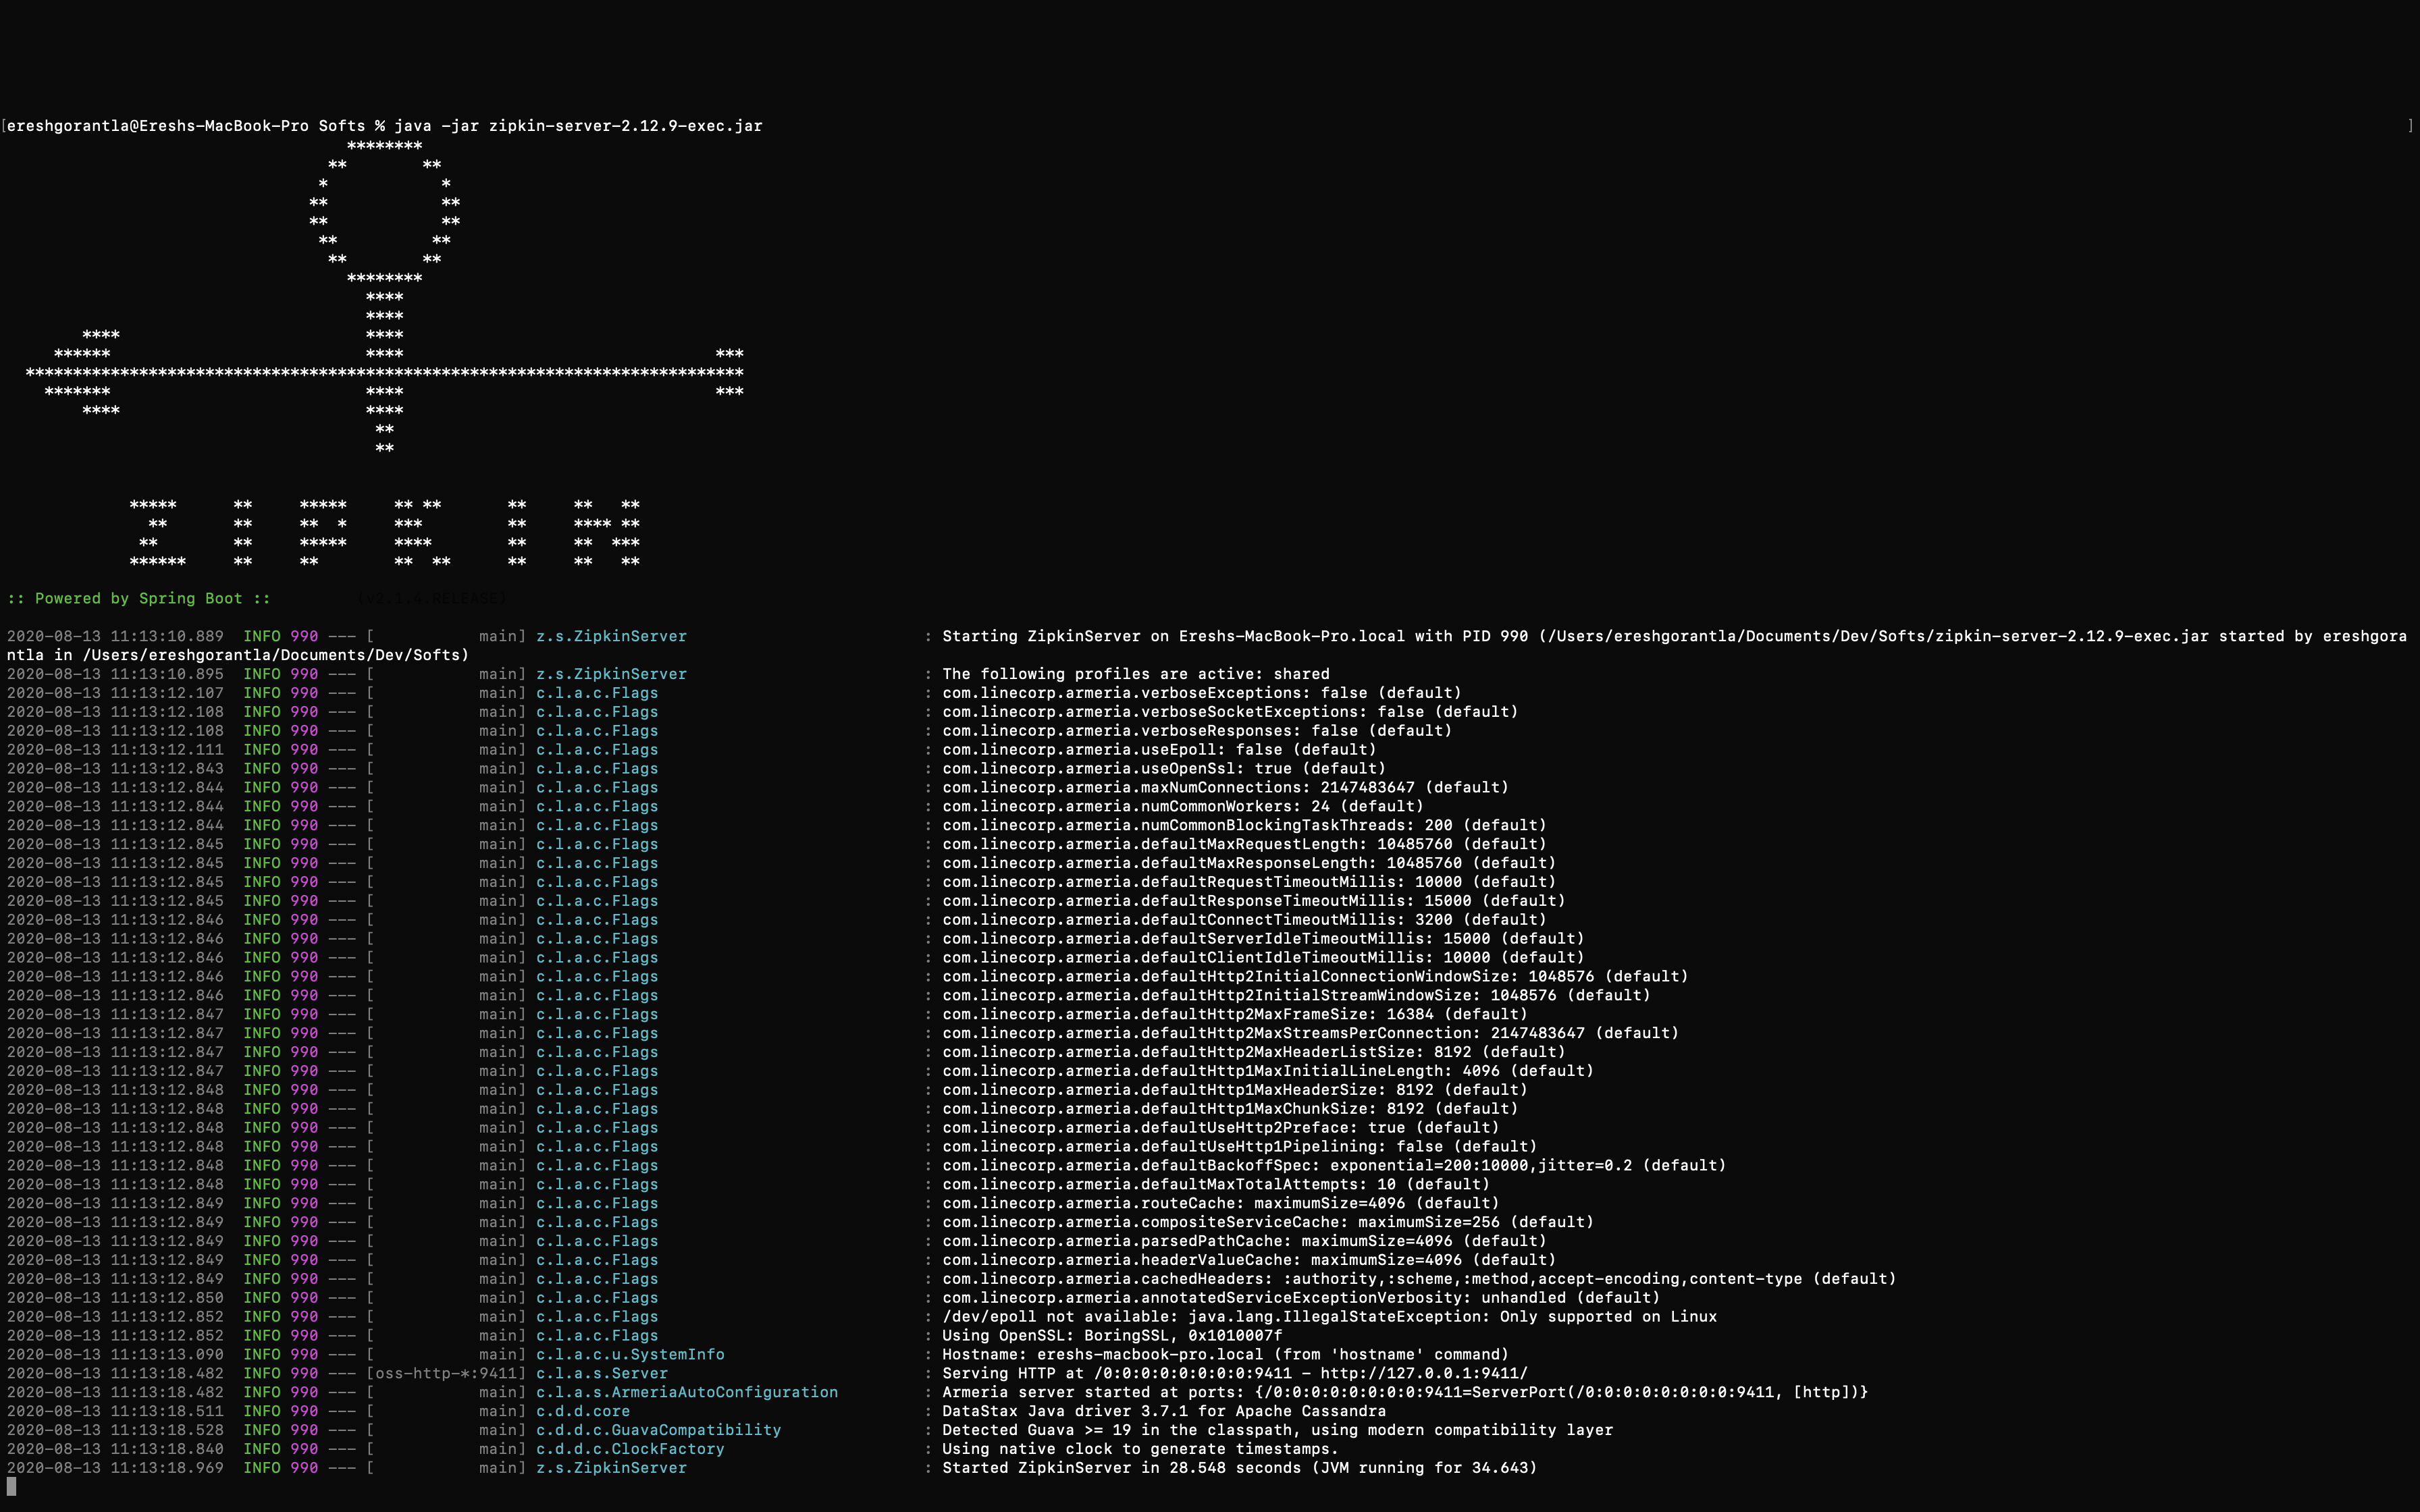
It started through the port 9411, Zipkin has web-UI available from 9411 port. Now open http://localhost:9411/zipkin/ to see UI.
它从端口9411开始,Zipkin从9411端口提供了Web-UI。 现在打开http:// localhost:9411 / zipkin /来查看UI。

What is Sleuth?
什么是侦探?
Sleuth is from the spring-cloud family, generates traceid, spanid when communicating to multiple microservices to their headers and MDC. This information is used by tools like Zipkin to store, index, and process them for metrics. As it is from the spring cloud family added once to the classpath, automatically integrates with common communication channels of spring boot applications to external systems via RestTemplate, Zuul proxy, Queues (RabbitMQ, Kafka), MVC controllers.
Sleuth来自spring-cloud系列,在与多个微服务的标头和MDC通信时会生成traceid,spanid。 Zipkin等工具使用此信息来存储,索引和处理它们以获取指标。 因为它是从Spring Cloud家族中添加到classpath的 ,它通过RestTemplate,Zuul代理,Queues(RabbitMQ,Kafka),MVC控制器与Spring Boot应用程序的通用通信渠道自动集成到外部系统。
Dependency:
依赖关系:
<dependency>
      <groupId>org.springframework.cloud</groupId>
      <artifactId>spring-cloud-starter-sleuth</artifactId>
</dependency>
Zipkin和Spring Cloud集成示例: (Zipkin and spring cloud integration example:)
We will consider the above-said use case for demo.
我们将考虑上述用例进行演示。
Dependencies to be added:
要添加的依赖项:
Few dependencies have to add for the Zipkin and sleuth integration and few properties have to include.
很少需要为Zipkin和sleuth集成添加依赖项,并且几乎不需要包含任何属性。
<dependency>
    <groupId>org.springframework.cloud</groupId>
    <artifactId>spring-cloud-starter-sleuth</artifactId>
</dependency>
<dependency>
    <groupId>org.springframework.cloud</groupId>
    <artifactId>spring-cloud-starter-zipkin</artifactId>
</dependency><dependencyManagement>
    <dependencies>
        <dependency>
            <groupId>org.springframework.cloud</groupId>
            <artifactId>spring-cloud-dependencies</artifactId>
            <version>Greenwich.SR2</version>
            <type>pom</type>
            <scope>import</scope>
        </dependency>
    </dependencies>
</dependencyManagement>
Properties to be added:
要添加的属性:
In addition to port and other specific properties for spring boot, Zipkin has to be enabled.
除了用于弹簧引导的端口和其他特定属性之外,还必须启用Zipkin。
spring.zipkin.enabled=trueMicroservices:
微服务:
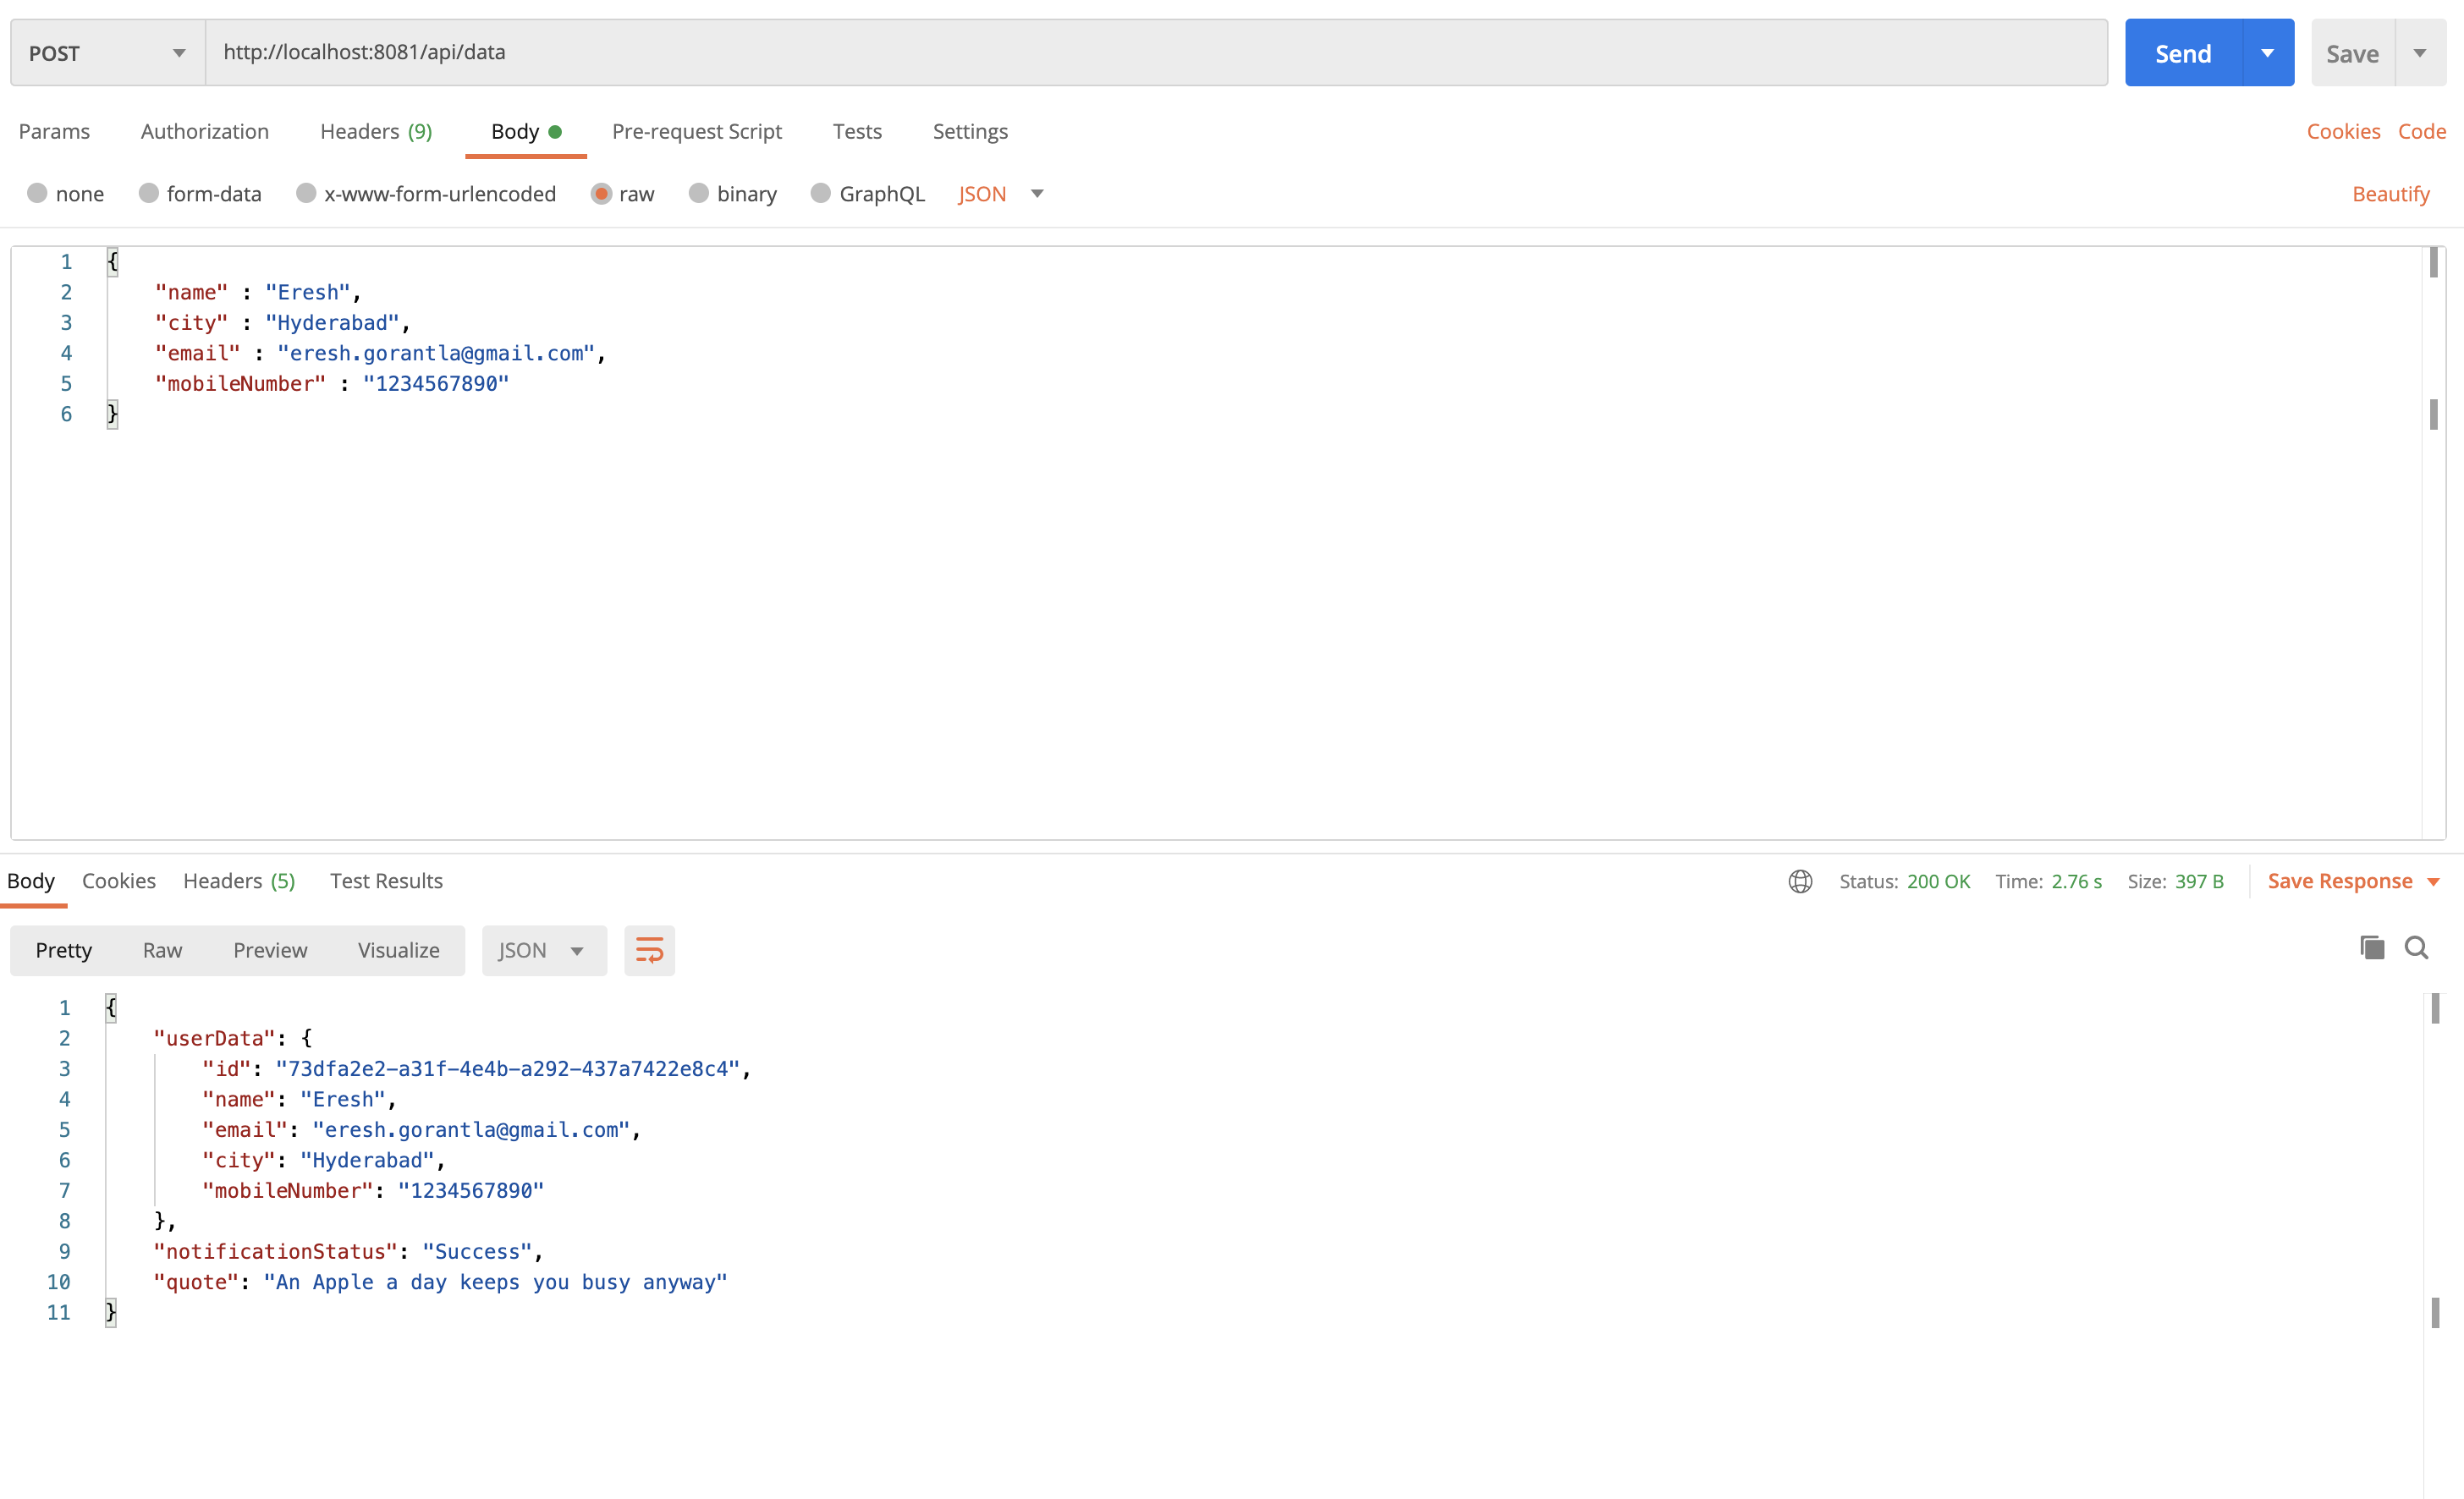
In order to serve the use-case, we have 4 microservices as we earlier discussed. Let's start all the microservices. I have posted one request.
为了服务用例,我们有4个微服务,如我们之前讨论的。 让我们启动所有微服务。 我已经发布了一个请求。
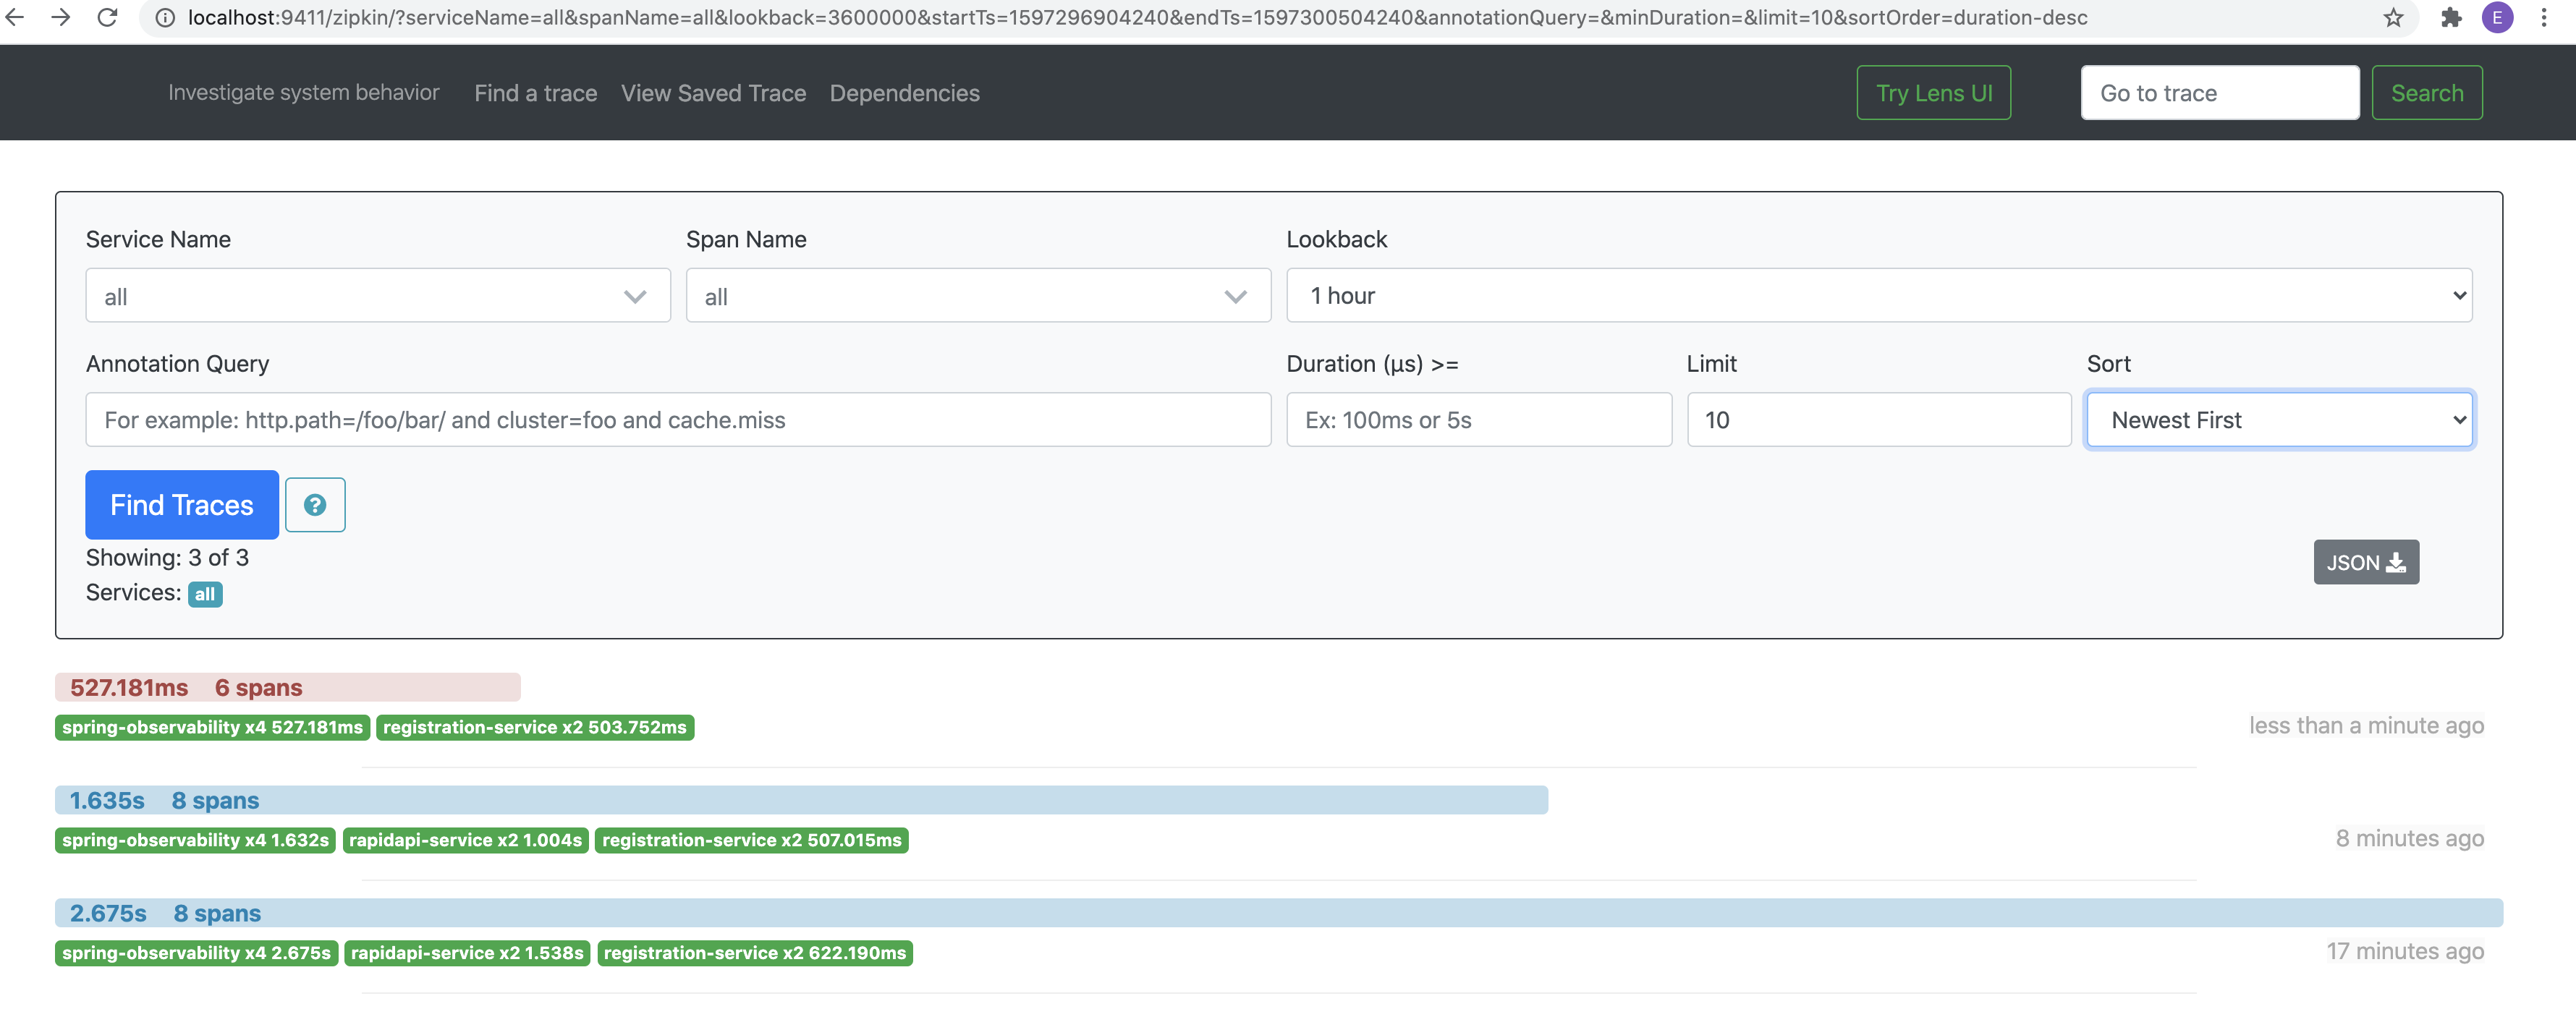
Let's see Zipkin dashboard
让我们看看Zipkin仪表板
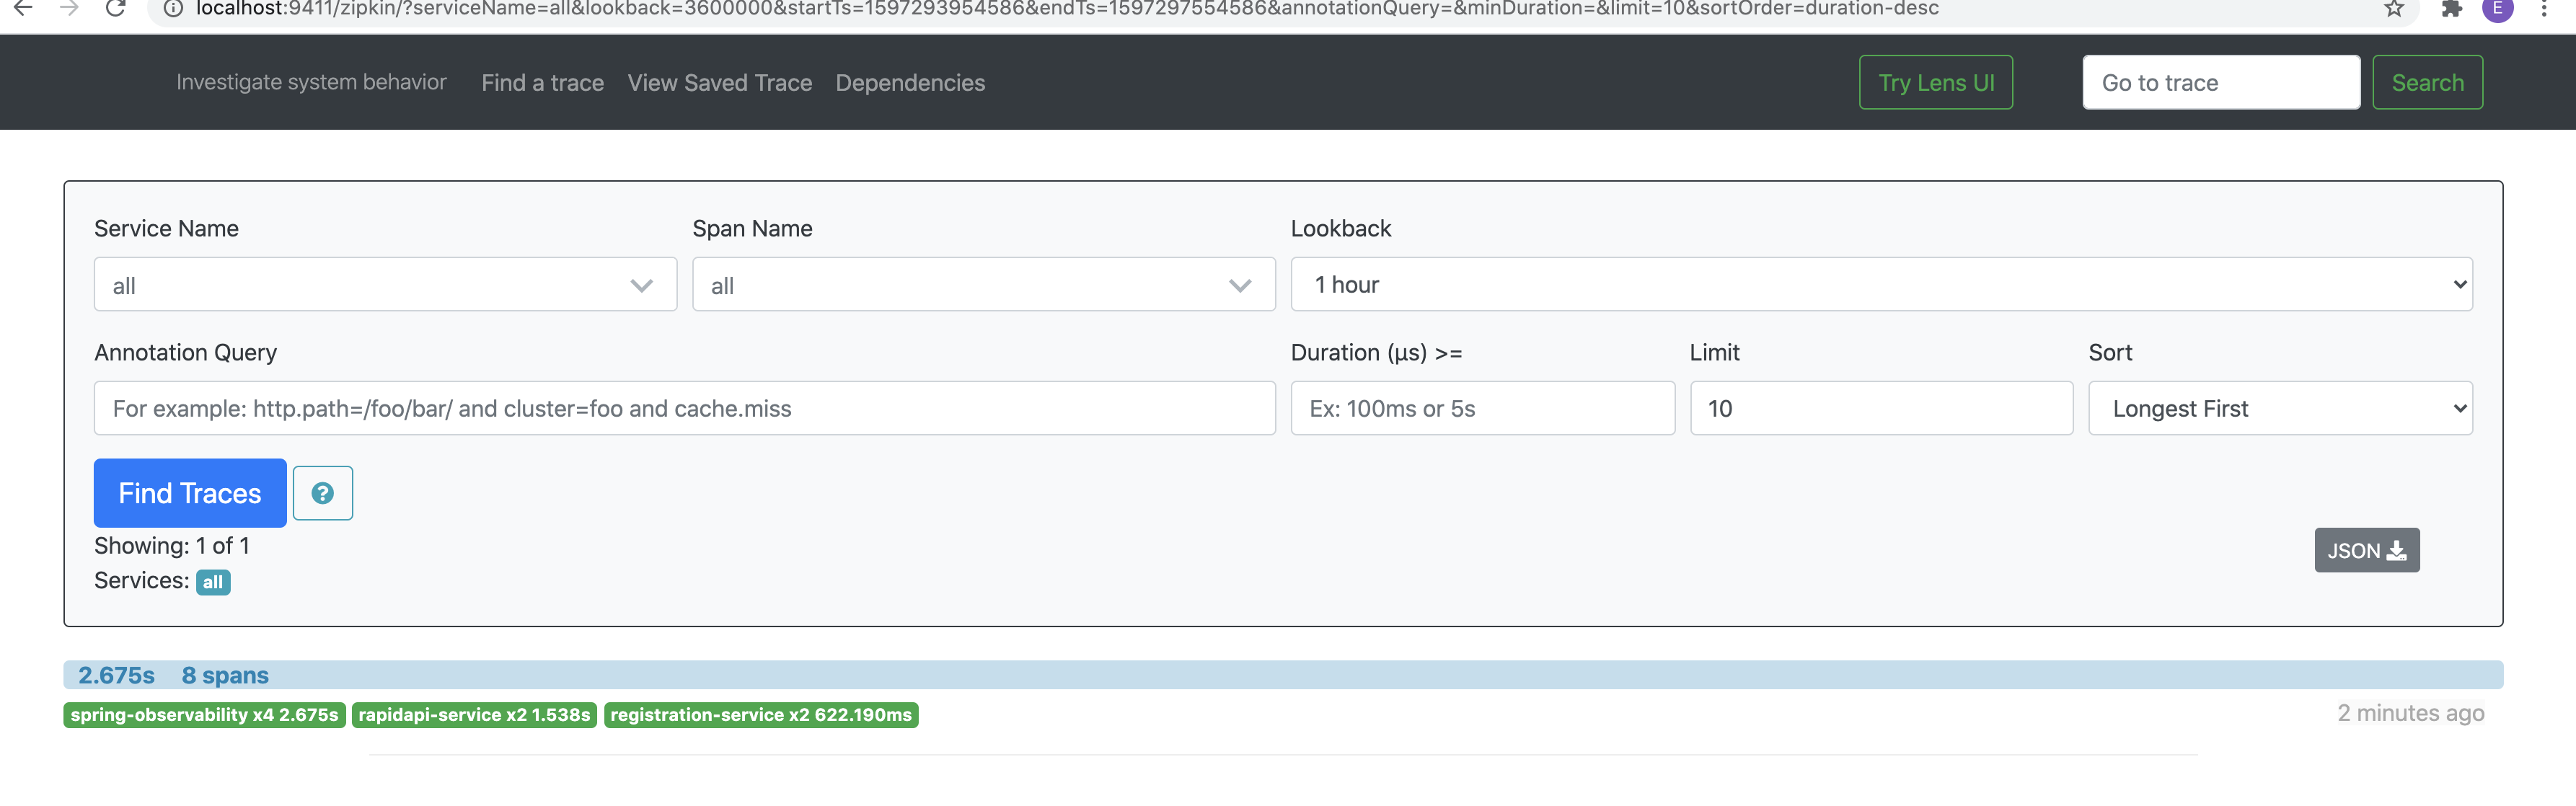
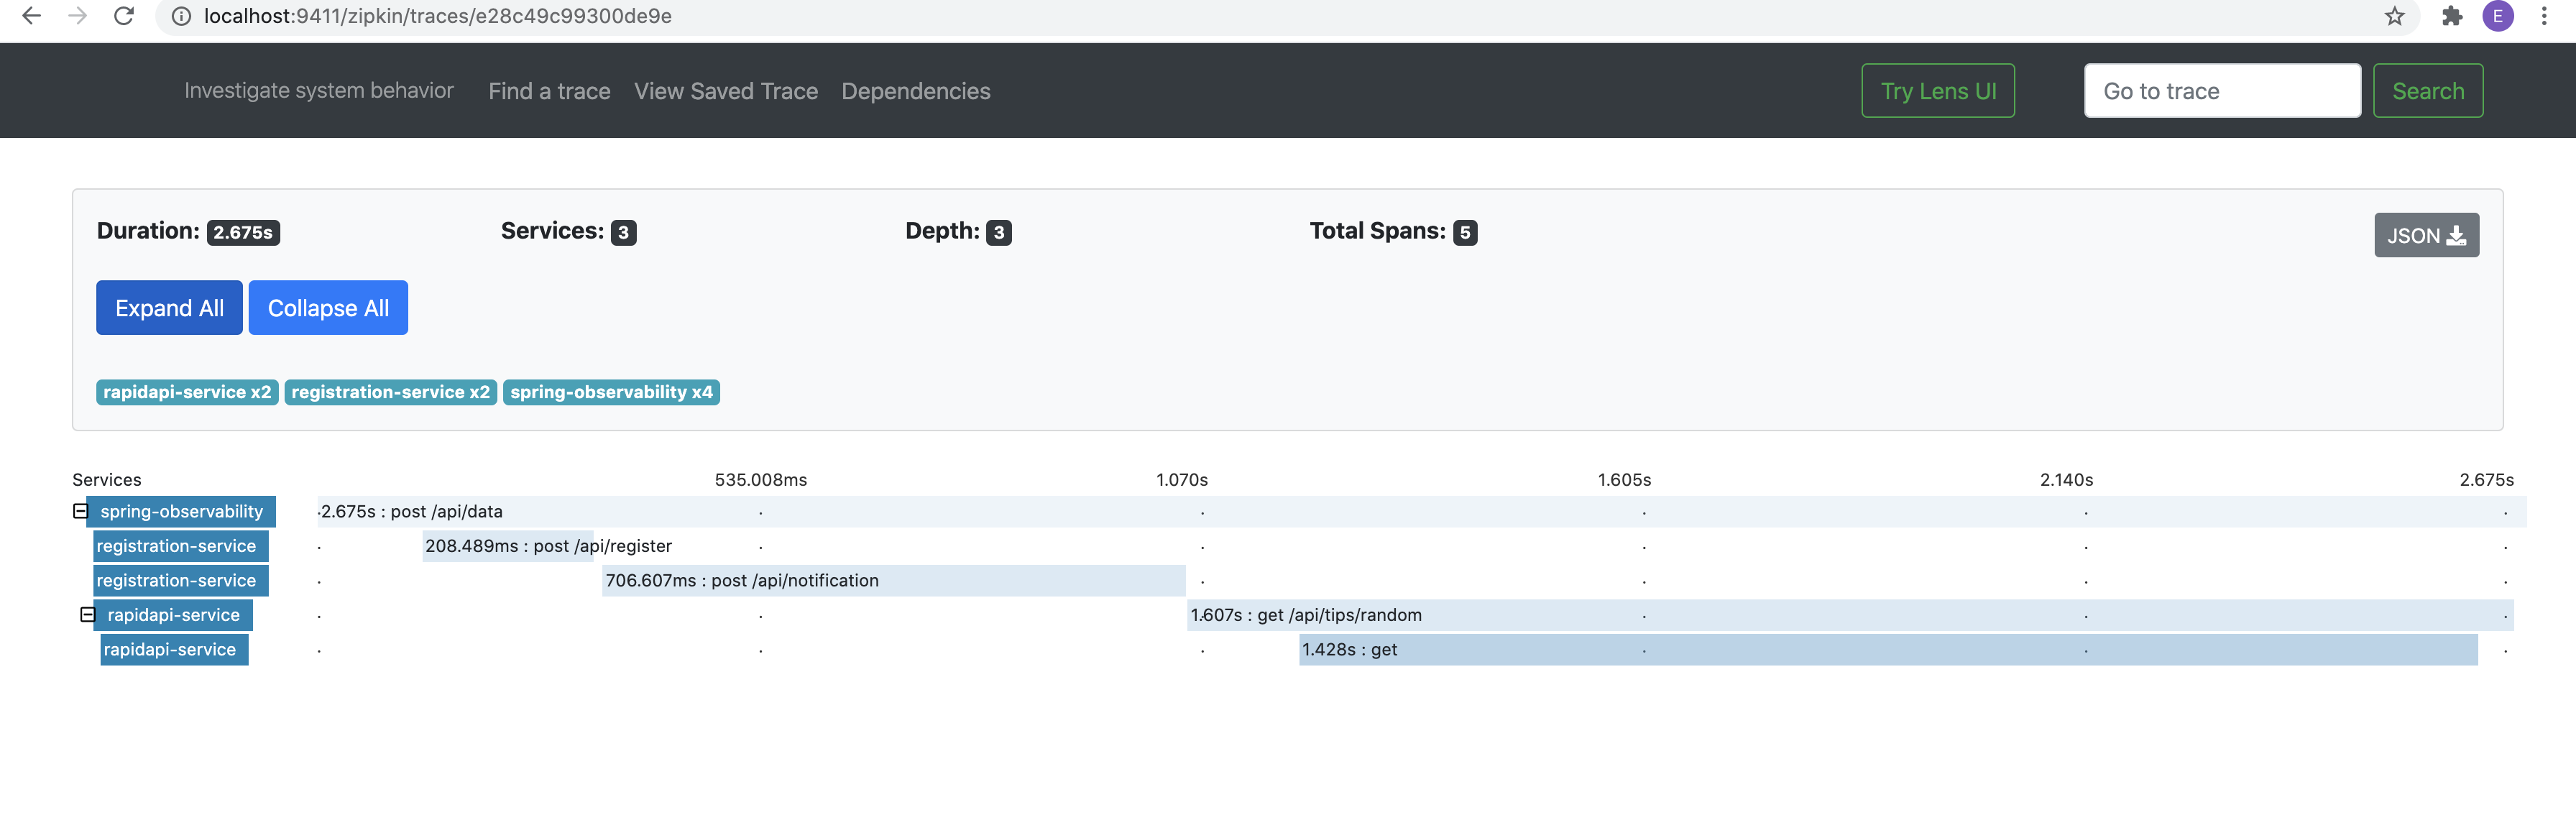
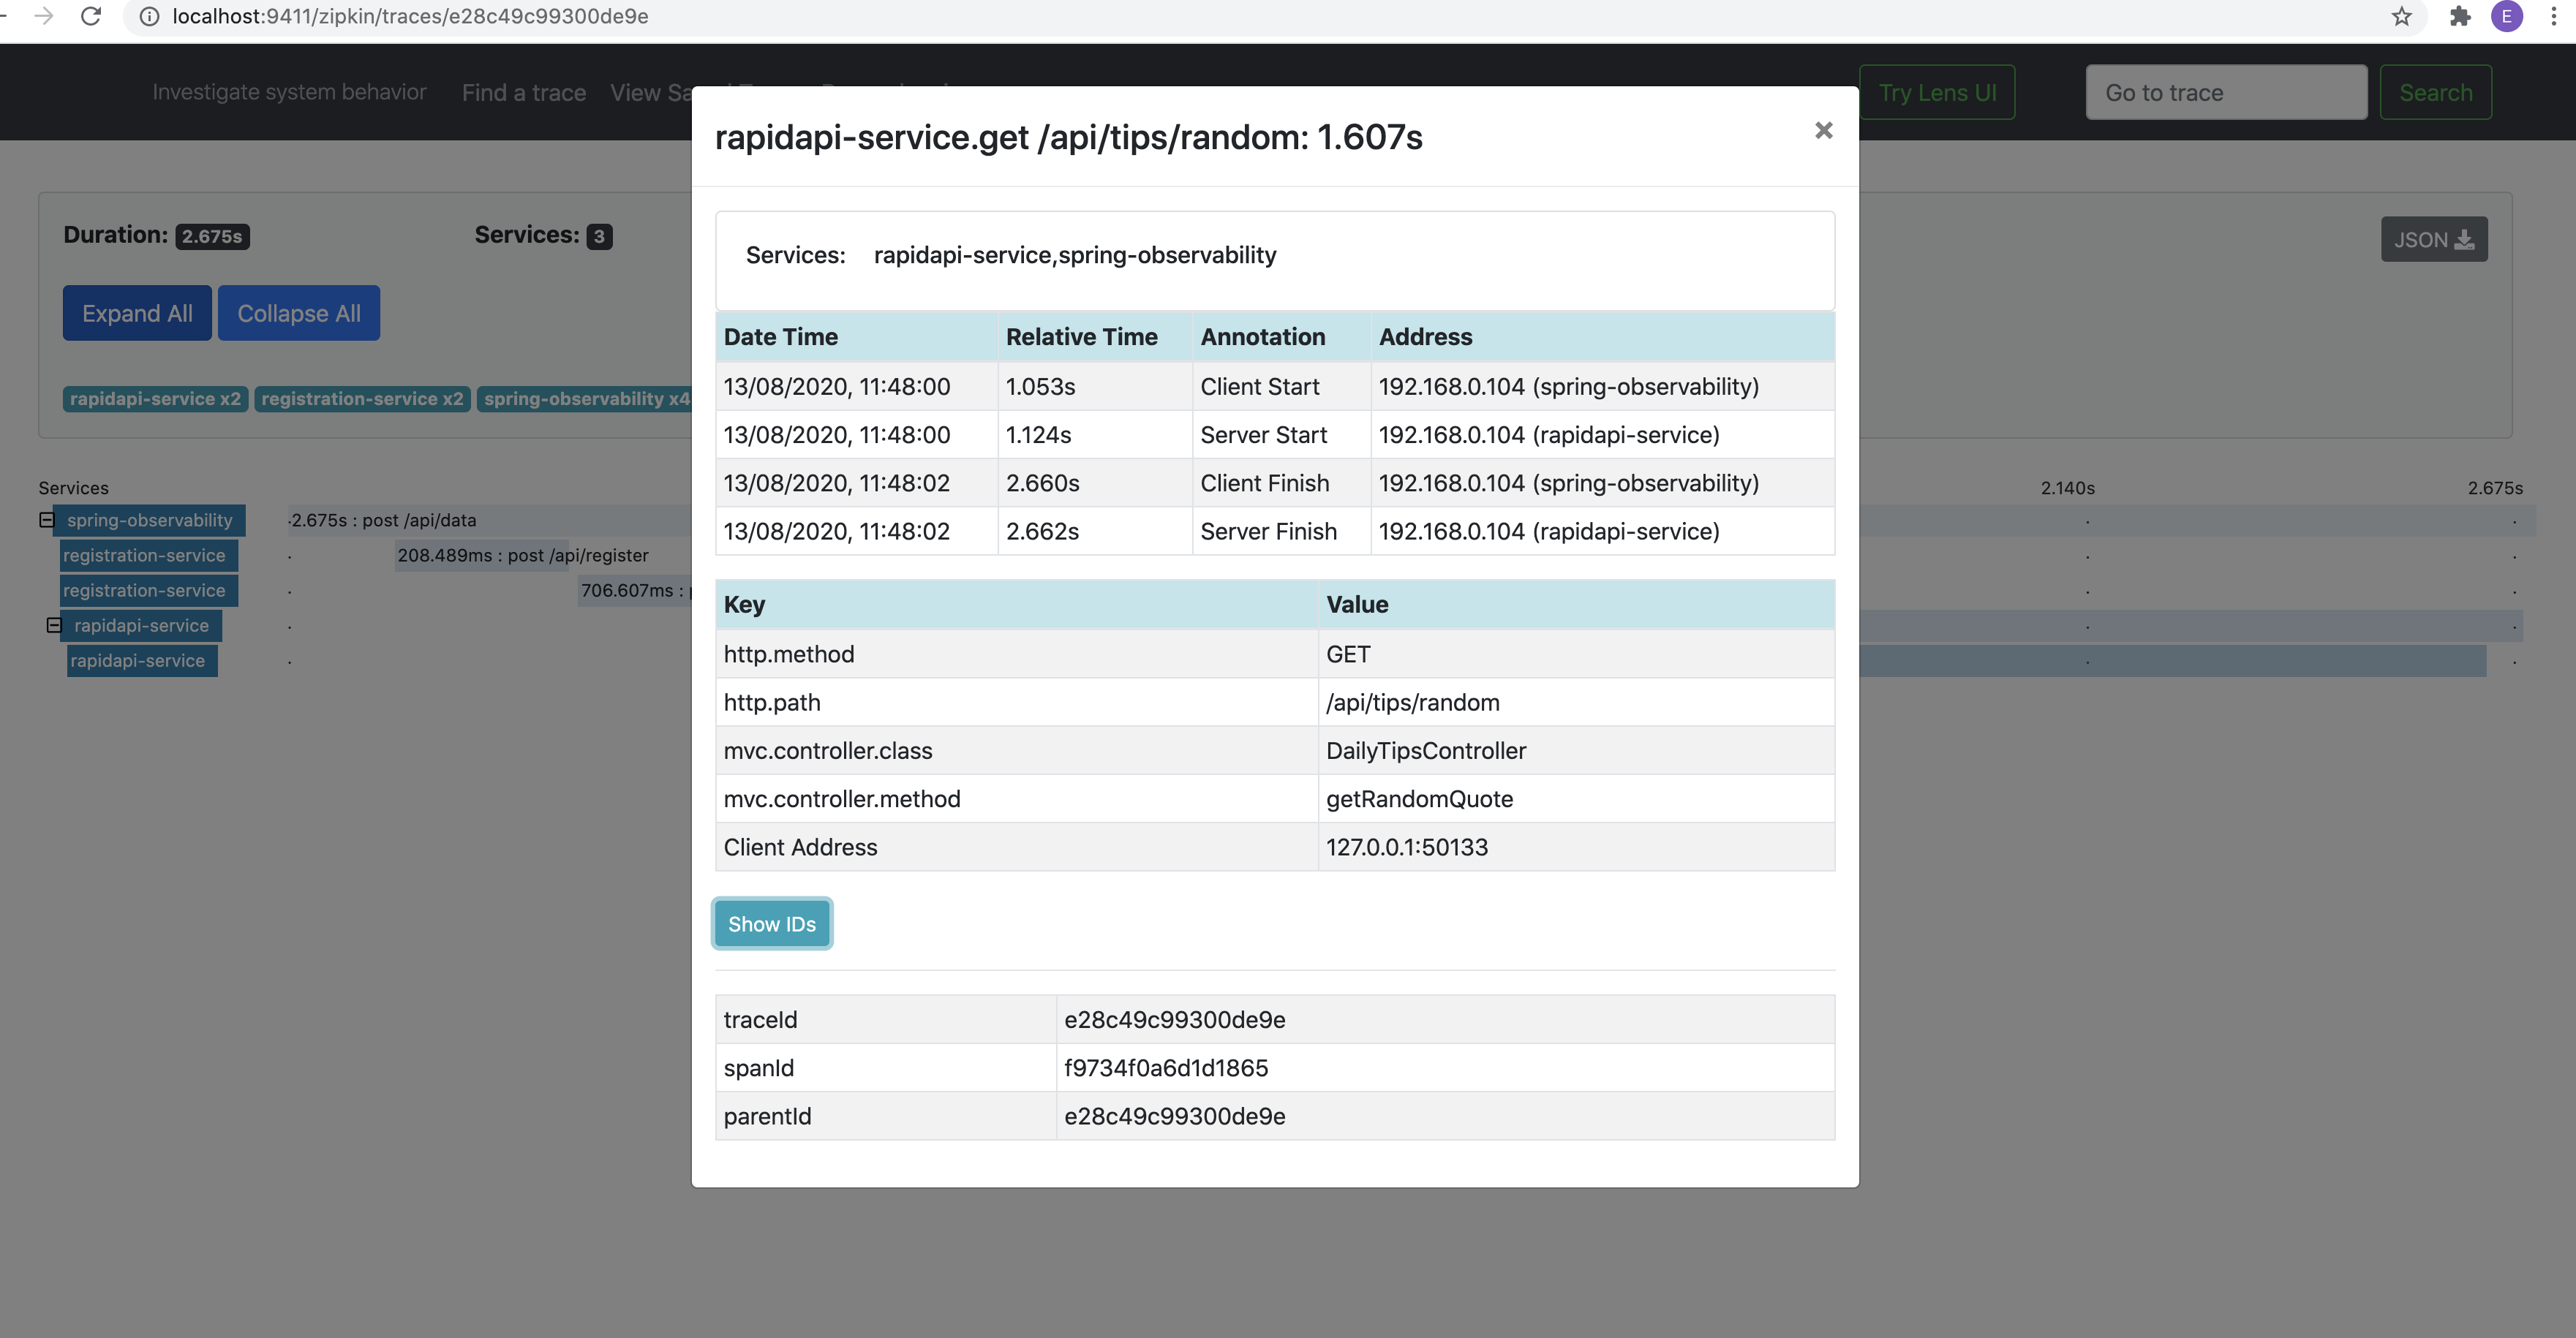
The traceid, spanid are created from each microservice and Zipkin reads the data and shows us in UI.
从每个微服务创建traceid,spanid,Zipkin读取数据并在UI中向我们显示。
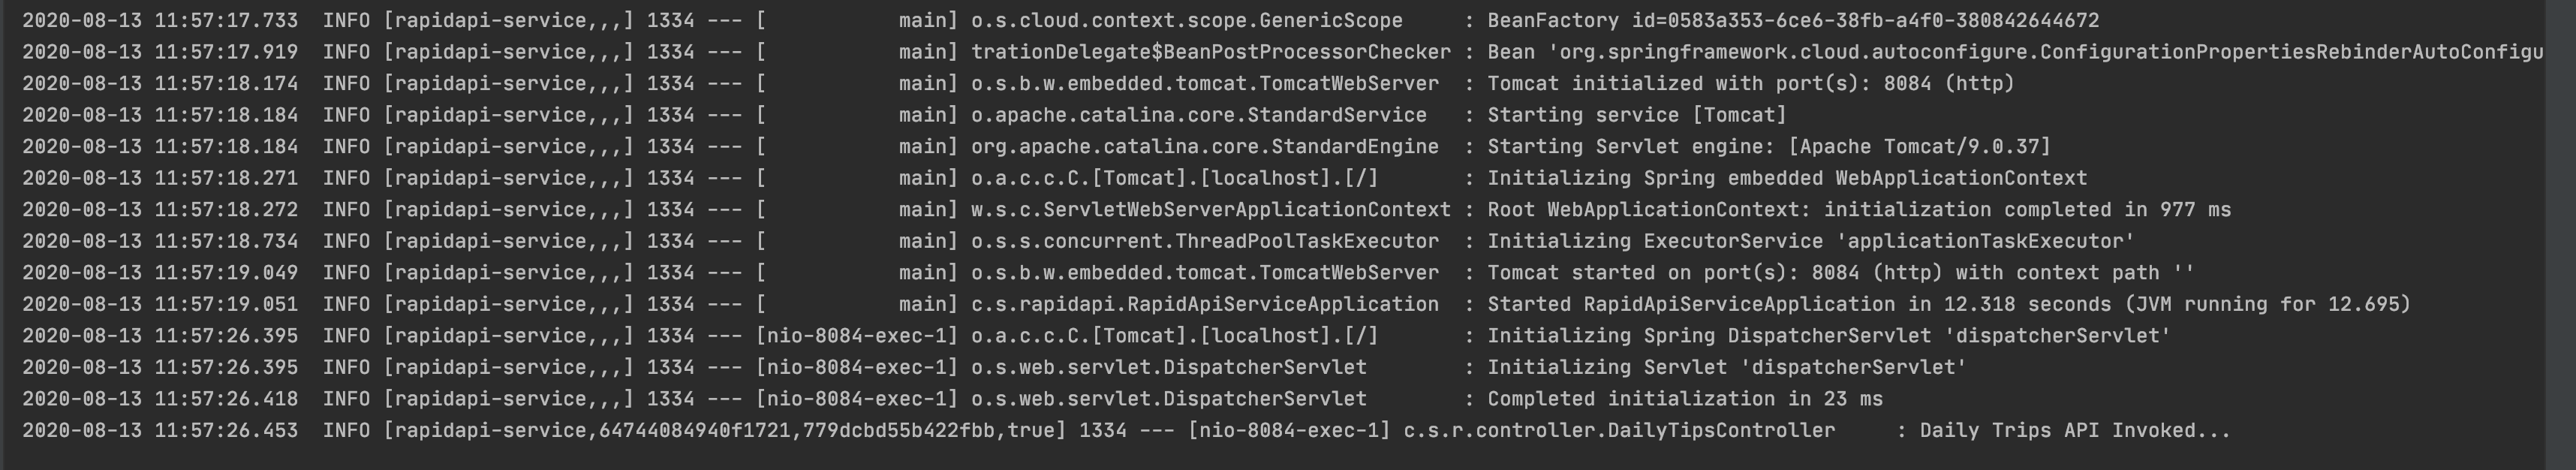
The line
线
2020–08–13 11:57:26.453 INFO [rapidapi-service,64744084940f1721,779dcbd55b422fbb,true] 1334 — — [nio-8084-exec-1] c.s.r.controller.DailyTipsController: Daily Trips API Invoked…
2020–08–13 11:57:26.453信息[rapidapi-service,64744084940f1721,779dcbd55b422fbb,true] 1334 — — [[nio-8084-exec-1] csrcontroller.DailyTipsController:每日行程API调用…
The highlighted one is the key to Zipkin [service-name, trace-id, span-id, enabled], this is how Zipkin keeps tracking of the log trace. It’s the sleuth’s responsibility to create these ids and any of the distributed tracing service providers can make use of these ids to visualize workflow/request.
突出显示的一个是Zipkin的密钥[服务名称,trace-id,span-id,已启用],这就是Zipkin保持跟踪日志跟踪的方式。 侦探的责任是创建这些ID,任何分布式跟踪服务提供者都可以使用这些ID来可视化工作流/请求。
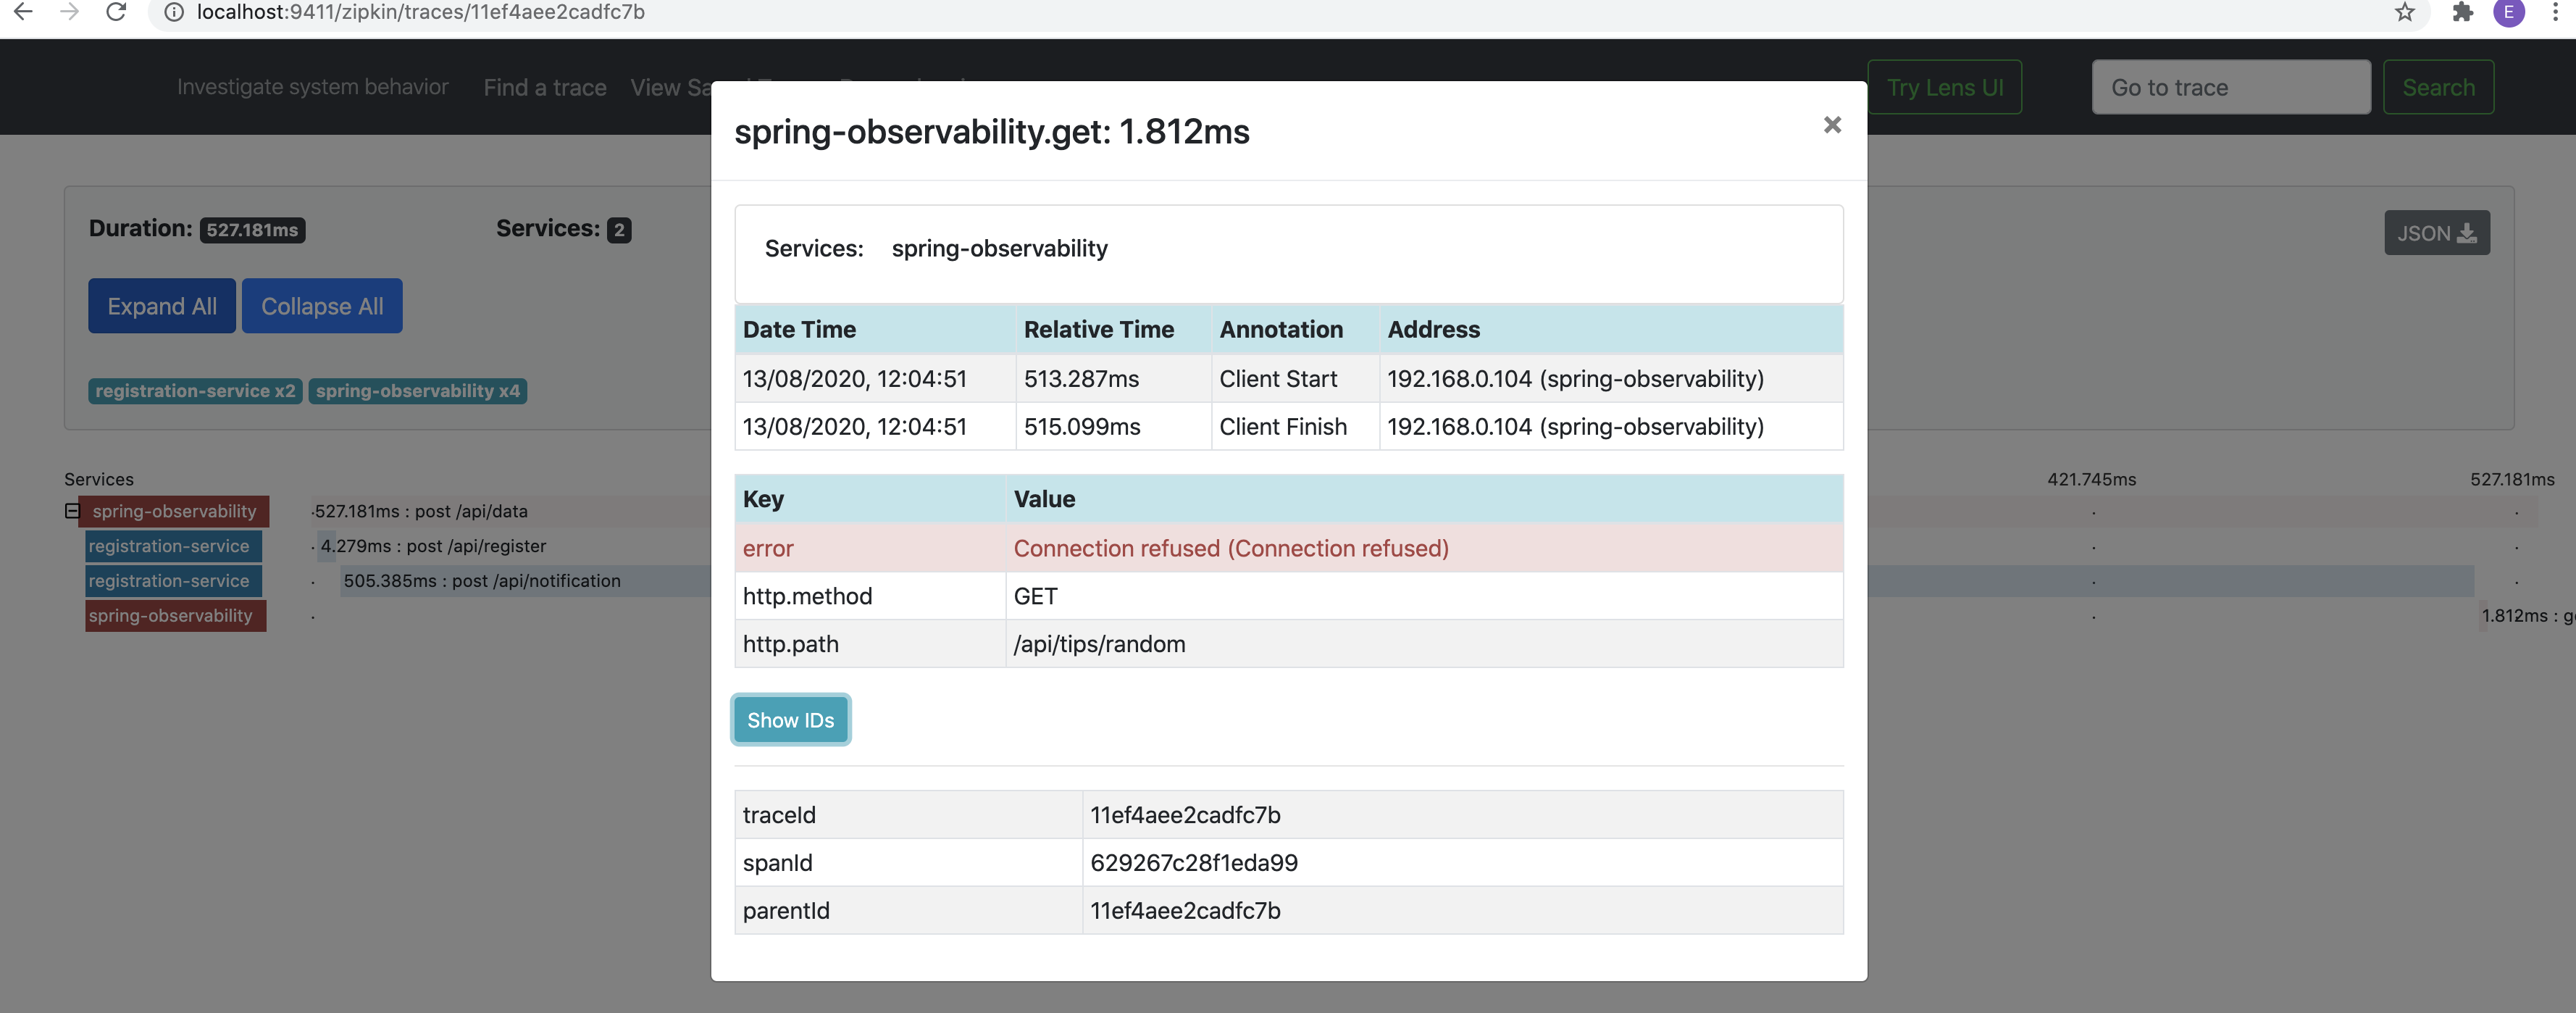
Now if one of the services is down, here RaipdAPI service is down
现在,如果其中一项服务已关闭,则RaipdAPI服务已关闭
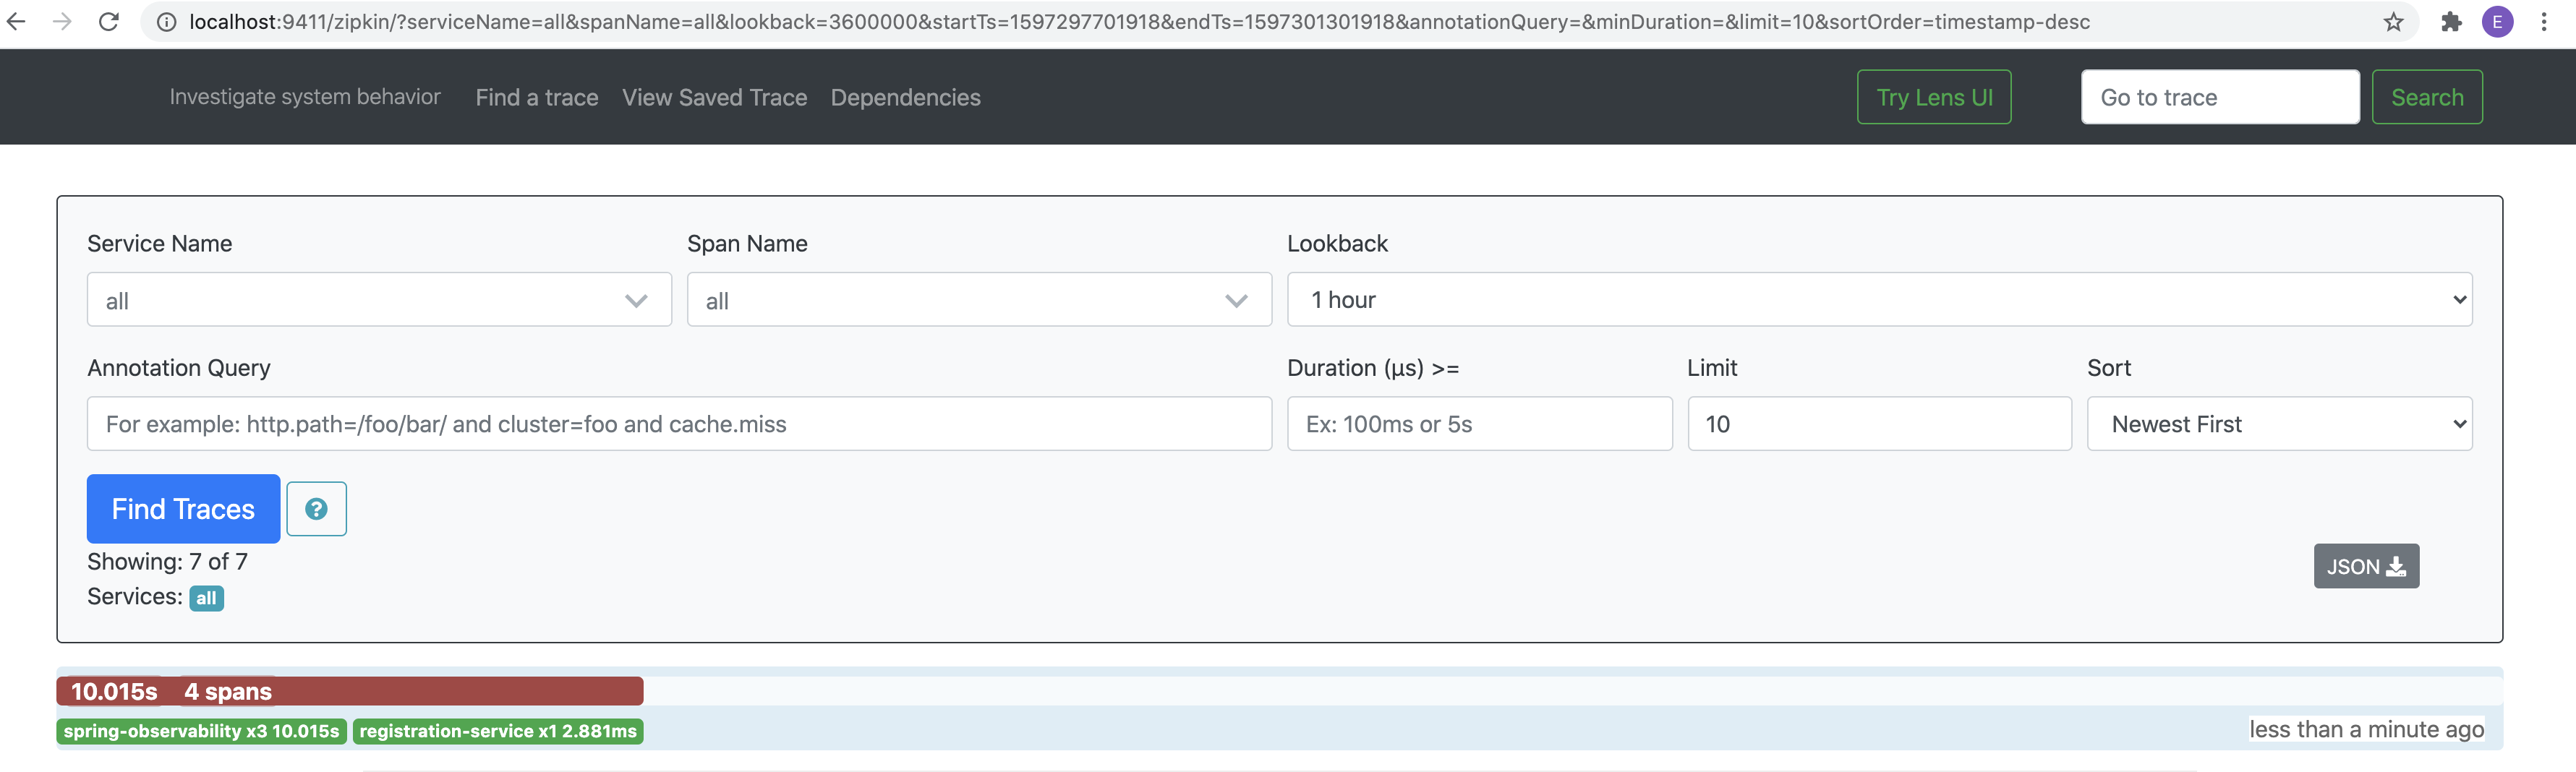
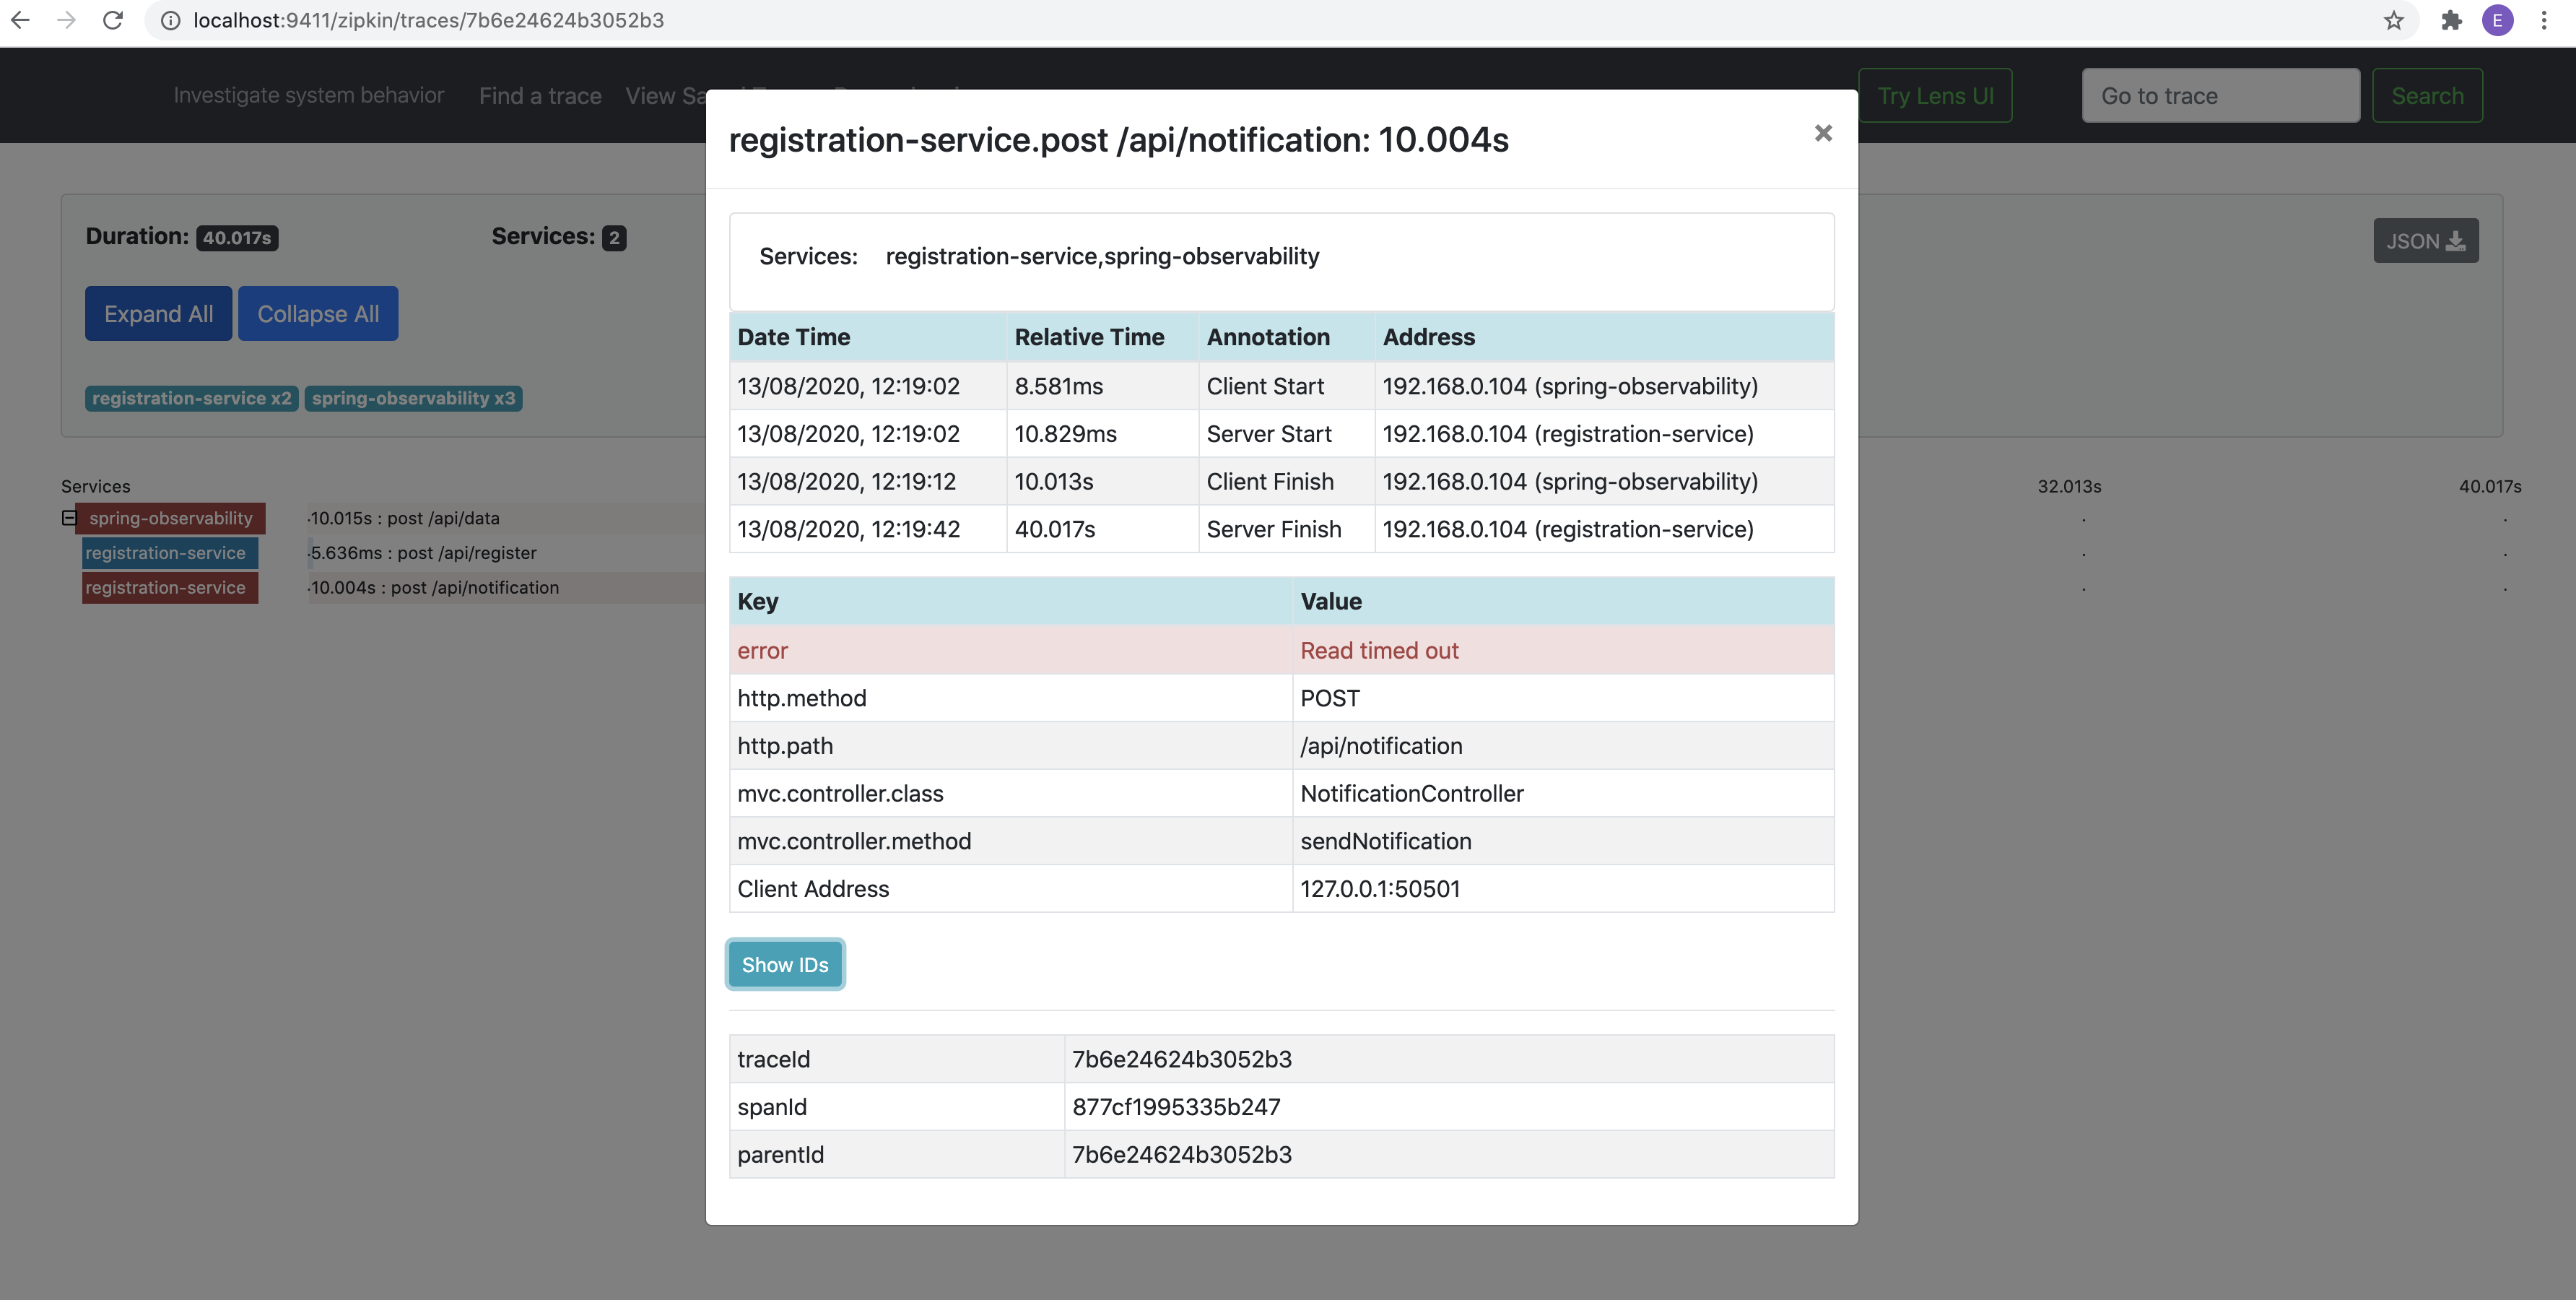
One of the services takes more time than usual. In the notification-service, I made the thread idle for 500ms, I increased to 20 seconds. As the rest template has read time out of 10 seconds, the request should throw read time out.
其中一项服务比平时花费更多时间。 在通知服务中,我使线程空闲500ms,然后增加到20秒。 由于其余模板的读取时间超过10秒,因此请求应将读取时间抛出。
A business logic exception can also be tracked in a similar way.
也可以以类似的方式跟踪业务逻辑异常。
As I initially stated that Zipkin is non-persistent and has only an in-memory data store. If the Zipkin server is restarted all the data is lost. In order to make it persistent, it is providing few options out of the box for cassandra, Mysql and elasticsearch. I will try to make another post on cassandra and Mysql.
正如我最初所说的,Zipkin是非持久性的,仅具有内存中的数据存储。 如果重新启动Zipkin服务器,则所有数据都将丢失。 为了使其持久,它为cassandra,Mysql和elasticsearch提供了一些现成的选项。 我将尝试在cassandra和Mysql上发表另一篇文章。
翻译自: https://medium.com/swlh/microservices-observability-with-zipkin-and-spring-cloud-sleuth-66508ce6840


 7882
7882

 被折叠的 条评论
为什么被折叠?
被折叠的 条评论
为什么被折叠?
 到【灌水乐园】发言


