


Have you wondered if missing “age” is related to the “Salary” of the respondant in a survey? Have you ever thought of analysing associations between various missing values in a dataset? How can you be sure that the absent data are because of no definite pattern? — Answer to these questions is fairly straight forward — This article shows you how to statistically prove the relationships between variables where data is missing — in python.
您是否想知道缺失的“年龄”是否与调查中受访者的“工资”有关? 您是否曾经想过分析数据集中各种缺失值之间的关联? 您如何确定缺少数据是因为没有确定的模式? —对这些问题的回答非常简单—本文向您展示了如何在python中统计证明数据丢失的变量之间的关系。
Ever since I came across LittleMCAR’s test in R for finding out the significance of the association between the missingness of variables, I have been searching for a similar test in python. This article will shed some light on performing a similar test in python. In this article, I will walk you through a set of codes, which analyses on missing values in categorical data.
自从我在R中遇到LittleMCAR的测试以找出变量缺失之间的关联的重要性以来,我一直在python中寻找类似的测试。 本文将为在python中执行类似的测试提供一些启示。 在本文中,我将引导您完成一组代码,这些代码将分析分类数据中的缺失值。
Before deep-diving into testing missing data mechanisms, let’s just understand them clearly.
在深入测试缺失的数据机制之前,让我们清楚地了解它们。
Let’s say we have a dataset, and we need to analyze those columns for missing values as well as for the relationship between variables. By analyzing the mechanisms, we can better decide how we want to handle them.
假设我们有一个数据集,我们需要分析这些列的缺失值以及变量之间的关系。 通过分析机制,我们可以更好地决定我们如何处理它们。
There are three different mechanisms by which data goes missing in any dataset.
共有三种数据丢失的机制。
1. Missing completely at random: (MCAR)
1.完全随机遗失:(MCAR)
2. Missing at Random: (MAR)
2.随机丢失:(MAR)
3. Missing not at Random: (MNAR)
3.并非随机丢失:(MNAR)
MCAR: (MCAR:)
What does it mean? When missing data points do not follow any particular reasoning or a pattern. For example, you have the demographic data of residents in your community. But there are 50% missing values under the variable “Middle Name”. This 50% of data is a perfect example of data MCAR. There is no pattern or a specific reason behind the middle name being blank in most of the entries.
这是什么意思? 当缺少数据点时,请勿遵循任何特定的推理或模式。 例如,您拥有社区中居民的人口统计数据。 但是变量“中间名”下有50%的缺失值。 这50%的数据是数据MCAR的完美示例。 在大多数条目中,中间名后面没有空格,没有任何模式或特定原因。
How to deal with it? The following methods can be adopted in case of data MCAR.
怎么处理呢? 对于数据MCAR,可以采用以下方法。
a. List-wise deletion: Deleting the record if the dataset has missing data in any of its variables/columns. This works best only when the missing data is small in number, like when in a dataset only 2% of the data is missing completely at random.
一种。 逐列表删除:如果数据集的任何变量/列中都缺少数据,则删除记录。 这仅在丢失的数据数量很少时才有效,例如在数据集中仅随机丢失2%的数据时。
b. Pair-wise deletion: Pairwise deletion only deletes cases when one of the variables being used in the statistical method that is considered, is missing.
b。 成对删除:成对删除仅删除在所考虑的统计方法中使用的变量之一缺失的情况。
Internally, it works along the same lines of a correlation matrix. In case of missing values between two variables, (in pairwise-sense) finding a correlation matrix takes all the complete cases for those two variables into account. Let’s say the number of cases in this scenario is N.
在内部,它沿着相关矩阵的相同线工作。 在两个变量之间缺少值的情况下,(以成对方式)找到相关矩阵会考虑到这两个变量的所有完整情况。 假设这种情况下的案例数为N。
When another set of variables is taken and the correlation matrix is calculated, the number of complete cases would differ from N.
当采用另一组变量并计算相关矩阵时,完整案例的数量将不同于N。
This serves as the major difference between Listwise and Pairwise deletion.
这是Listwise和Pairwise删除之间的主要区别。
Pairwise deletion has the advantage of minimal data loss. When there is a dataset that has widespread missing values in almost all variables, pairwise would be a wiser choice of missing value treatment.
成对删除的优点是数据丢失最少。 当存在几乎所有变量中都有广泛缺失值的数据集时,成对选择缺失值处理将是一个更明智的选择。
c. Mean, median & mode imputation: Missing values can also be replaced with the mean, median, and mode values of the respective variables.
C。 平均值,中位数和众数插补:缺失值也可以用相应变量的平均值,中位数和众数代替。
MAR: (MAR:)
What does it mean? When missing data points follow a pattern. Let’s take the same example of the demographic data of residents in your community. But this time the salary of few men who have ages greater than 45 are missing.
这是什么意思? 当缺少数据点时,遵循模式。 让我们以社区中居民的人口统计数据为例。 但是这次,缺少几个年龄大于45岁的男人的薪水。
Here the missingness in data is attributed to another variable’s data. Hence, it follows a “missing at Random’ mechanism. MAR is probably most tricky to understand because of its name.
这里,数据的缺失归因于另一个变量的数据。 因此,它遵循“随机缺失”机制。 MAR的名称可能很难理解。
How to deal with it? Since there is a relationship involved in this mechanism, the best option here would be to go for an imputation technique — mean, median, mode, or multiple imputations — (This will be the scope of this article)
怎么处理呢? 由于此机制涉及某种关系,因此最好的选择是采用一种插补技术(均值,中位数,众数或多个插补)(这是本文的范围)
MNAR: (MNAR:)
What does it mean? When missing data points follow a pattern with its data, it is meant to follow an MNAR mechanism. For example, in the same demographic data of residents in your community, let’s say the salary of a few men is missing when salary is beyond a certain amount. (say a million)
这是什么意思? 当丢失的数据点遵循带有其数据的模式时,就意味着要遵循MNAR机制。 例如,在您社区中居民的相同人口统计数据中,假设工资超过一定数额时,就会缺少一些男人的工资。 (例如一百万)
Here, it follows a “Missing Not at Random’ mechanism. Typically, when data missing is not MCAR or MAR, it tends to follow MNAR.
在此,它遵循“不随意丢失”机制。 通常,当数据丢失不是MCAR或MAR时,它倾向于遵循MNAR。
How to deal with it? Since there is a self-induced relationship in MNAR’s case, the best way to avoid them is to do some data collection or model the missing data.
怎么处理呢? 由于在MNAR的情况下存在自生关系,因此避免它们的最佳方法是进行一些数据收集或对丢失的数据进行建模。
The reason why we need to analyze the missing value mechanisms is that we need to understand the best way to impute the missing value so that the accuracy of our ML models stays uninfluenced.
我们需要分析缺失值机制的原因是,我们需要了解推算缺失值的最佳方法,以使ML模型的准确性不受影响。
现在开始编码... (Let’s get coding now…)
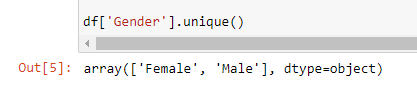
I have taken this Kaggle dataset for the analysis. Let’s first pull this data into a data frame and check the total number of missing values within the dataset. I have dropped the timestamp variable from the dataset for now, since my goal here is to work with missing values and their relationships. I have also replaced the gender column values with minimal categories — “Male” and “Female”.
我已将此Kaggle数据集用于分析。 首先让我们将这些数据放入数据框中,然后检查数据集中缺失值的总数。 我现在已经从数据集中删除了timestamp变量,因为我的目标是使用缺失值及其关系。 我还用最少的类别(“男性”和“女性”)替换了“性别”列值。
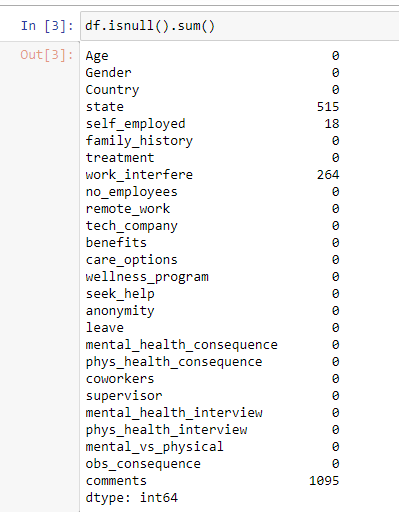
As we can see in the below screenshot, there are missing values in a few of the columns — State, Self_employed, work_interfere, and comments have a lot of missing data.
正如我们在下面的屏幕快照中看到的那样,一些列中缺少值-State,Self_employed,work_interfere和注释中有很多丢失的数据。
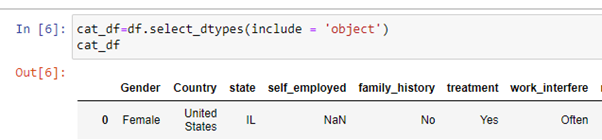
Now, there is just one numerical variable in the chosen dataset, but there are no missing values in it. So, let’s just separate the categorical variables in a separate data frame.
现在,所选数据集中只有一个数字变量,但是其中没有缺失值。 因此,让我们将分类变量放在单独的数据框中。
Now that we have separated the categorical variables with complete and incomplete cases, we need to analyze the association between each variables’ complete and incomplete cases, using traditional chi-sq. test for independence and the Cramer’s coefficient.
现在,我们已经将分类变量分为完全和不完全两种情况,我们需要使用传统的chi-sq分析每个变量的完全和不完全案例之间的关联。 测试独立性和Cramer系数。
The Chi-Square test of independence is used to determine if there is an association between two categorical variables. A contingency table or a crosstab is used by the chi-sq. test to check for the frequency in those categories.
卡方独立性检验用于确定两个类别变量之间是否存在关联。 chi-sq使用列联表或交叉表。 测试以检查这些类别中的频率。
The Cramer’s coefficient is a measure of association between two nominal variables, giving a value between 0 and +1.
克拉默系数是两个名义变量之间关联的度量,给出一个介于0和+1之间的值。
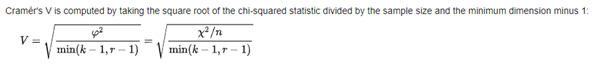
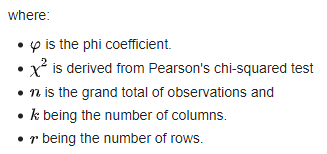
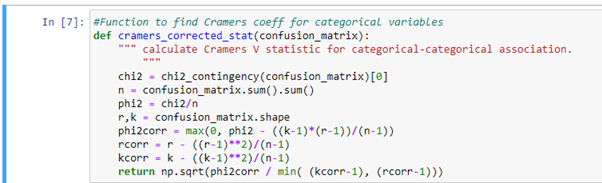
The following function calculates the Cramer's coefficient value for all the variable combinations in the dataset.
以下函数为数据集中的所有变量组合计算Cramer系数值。
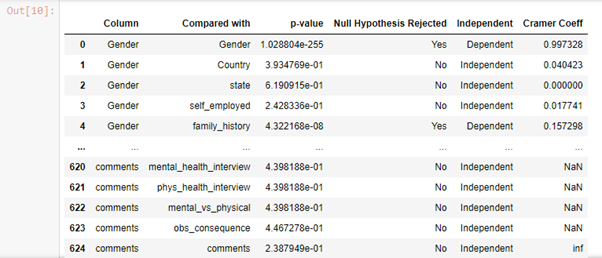
After applying both chi-squared and Cramer’s logic into our data frame, we get the following as an output.
在将卡方和Cramer逻辑应用于我们的数据帧之后,我们得到以下内容作为输出。

As we can see above, for the complete cases, the Cramer coefficient is the highest when a column is compared with itself. The columns — “Independent” show the result of the chi-sq test significance. If the p-value for chi-sq was <0.05, the association is going to be dependent.
正如我们在上面看到的那样,对于完整的情况,将列与其自身进行比较时的Cramer系数最高。 “独立”列显示卡方检验重要性的结果。 如果chi-sq的p值<0.05,则关联将是依赖的。
We perform the same analysis for incomplete cases too.
对于不完整的案例,我们也进行相同的分析。
Here, Cramer’s Coefficient is Nan for few rows because the number of incomplete cases for a few of the variables could have been 1.
在这里,克莱默系数在几行中都是Nan,因为一些变量的不完整案例数可能为1。
Generally, the accepted category for any Cramer’s coefficient association is taken from a standard set of intervals.
通常,任何Cramer系数关联的可接受类别均取自一组标准间隔。
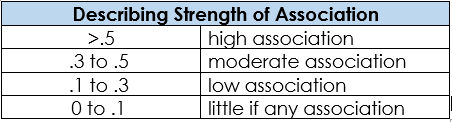
Depending on the above criteria, let’s segregate our output into four different data frames –
根据上述条件,让我们将输出分为四个不同的数据帧–
1. cramer_high2. cramer_moderate3. cramer_low4. cramer_little_if_any
1. cramer_high2。 cramer_moderate3。 cramer_low4。 cramer_little_if_any
The following are the variables which have high association among themselves.
以下是它们之间具有高度关联的变量。
1. Self-employed & No-Employees
1.自雇和无雇员
2. Treatment & work_interfere
2.治疗与工作干扰
3. Seek_help & wellness_program
3.寻求帮助和健康计划
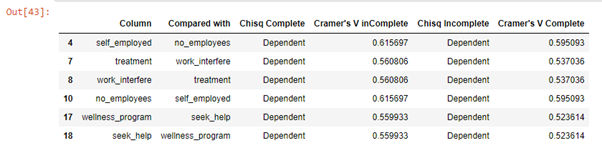
Among these, “Self-employed & work_interfere” has missing data in our dataset.
其中,“个体经营和工作干扰”在我们的数据集中缺少数据。
The cramer’s V for incomplete cases, tells us that among the missing data, there is a strong relationship between “Self_employed” & “no_of_employees” variables ( >0.5).
对于不完整的案例,克莱默的V告诉我们,在缺失的数据中,“自雇”和“无雇员”变量之间存在很强的关系(> 0.5)。
Same is the case with our other variable which has missing data — “work_interfere”. Whether a person is under treatment for a mental illness or not, greatly influences the way the illness interferes in his work during the day.
其他变量缺少数据的情况也是如此(“ work_interfere”)。 一个人是否正在接受精神疾病的治疗,极大地影响了该疾病在白天影响其工作的方式。
However, when you look at the chisq test’s results for these two variables, there is no difference in conclusion for the complete and incomplete cases. This means that the association can’t be solely due to missingness in data for the two variables.
但是,当您查看这两个变量的chisq检验结果时,对于完全案例和不完全案例,结论没有差异。 这意味着关联不能仅是由于两个变量的数据缺失。
As for the third variable which has missing values — “State” — It has moderately strong relationship between “remote_work”,”tech_company”, “self_employed”, “coworkers” and “comments”.
至于缺少值的第三个变量“状态”,它在“远程工作”,“技术公司”,“个体经营”,“同事”和“评论”之间具有中等强的关系。
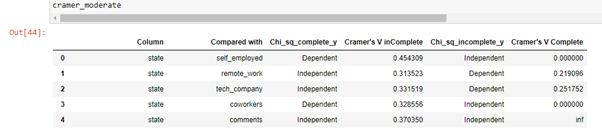
Here if you see, there is a difference in the chisq test output for — “state” vs “remote_work” & “state” vs “tech_company”, it says that the two variables are independent in complete cases but they end up being dependent in incomplete cases.
在这里,如果您看到,“状态”与“ remote_work”和“状态”与“ tech_company”的chisq测试输出存在差异,它表示两个变量在完整情况下是独立的,但最终它们取决于不完整的案件。
In other words, there is something about the missingness in “state” which depends on whether that person is working from home or if he works for a tech_company (aka a fairly strong association in missingness).
换句话说,“状态”中的失踪有一些东西,这取决于该人是在家工作还是在某技术公司工作(又称“失踪”中有很强的联系)。
进一步的步骤 (Steps further..)
Since there is an inherent relationship between the variables that have missing values in our dataset, the data is considered Missing at Random (MAR). Hence, rather than deleting the missing records, it is wiser to do an imputation technique like “mode” imputation, or go for a slightly advanced technique like Multiple Imputation.
由于在我们的数据集中具有缺失值的变量之间存在固有的关系,因此将数据视为随机缺失(MAR)。 因此,与其删除丢失的记录,不如执行诸如“模式”插补之类的插补技术,或者采用诸如“多重插补”之类的稍微先进的技术,是更明智的选择。
That way, we would retain most of the information from our dataset and the accuracy will not be compromised in the end.
这样,我们将保留数据集中的大部分信息,并且最终不会影响准确性。
翻译自: https://towardsdatascience.com/statistical-test-for-mcar-in-python-9fb617a76eac


 431
431

 被折叠的 条评论
为什么被折叠?
被折叠的 条评论
为什么被折叠?
 到【灌水乐园】发言


