


用于时间序列的数据
Time series is nothing but a series of data points that are observed with respect to time. In data science, time series is mostly an independent variable and the goal is to predict the future using historical data. Traditionally, time series problems have been solved using their lag and differencing features through ARIMA kind of models. However, with the unexpected events, the signal recorded shows a more dynamic nature of the trend and thus has become difficult to get accurate models using just these traditional approaches.
时间序列不过是相对于时间观察到的一系列数据点。 在数据科学中,时间序列主要是一个独立变量,目标是使用历史数据预测未来。 传统上,时间序列问题是通过ARIMA模型使用滞后和微分特征来解决的。 但是,在发生意外事件时,所记录的信号显示出趋势的更多动态特性,因此仅使用这些传统方法就很难获得准确的模型。
Time series are considered as one of the most crucial and difficult problems to solve in machine learning.
时间序列被认为是机器学习中要解决的最关键和最困难的问题之一。
A modern approach was formulated by practitioners by converting time series into tabular data format with manual feature engineering to solve the machine learning problem. There are many datasets available that can be great features to solve a specific time series problem. For problems in the field of financials, supply chain, etc. date and time based features can play a major role in capturing the trend and understanding the data especially when it comes to time series data.
从业人员提出了一种现代方法,即通过将时间序列转换为具有手动特征工程的表格数据格式来解决机器学习问题。 有许多可用的数据集可以很好地解决特定的时间序列问题。 对于金融,供应链等领域的问题,基于日期和时间的功能可以在捕获趋势和理解数据方面发挥重要作用,尤其是涉及时间序列数据时。
The article mainly covers some of the features that can be purely created based on date and/or time. Some of these features are quite frequently used, but there are some others which might be interesting to look at and consider.
本文主要介绍一些可以完全基于日期和/或时间 创建的功能。 这些功能中的某些功能非常常用,但是有些功能可能值得关注和考虑。
The feature engineering shown below does not mean necessarily that it will be consumed as features by machine learning algorithms and give accurate predictions. Sometimes, a different dimension is needed to get a better view of the data which is possible only by creating such features.
下面显示的特征工程并不一定意味着机器学习算法会将其作为特征使用并给出准确的预测。 有时,需要不同的维度才能更好地查看数据,这只有通过创建此类功能才能实现。
所需包装: (Required Packages:)
Pandas
大熊猫
Datetime
约会时间
Calendar
日历
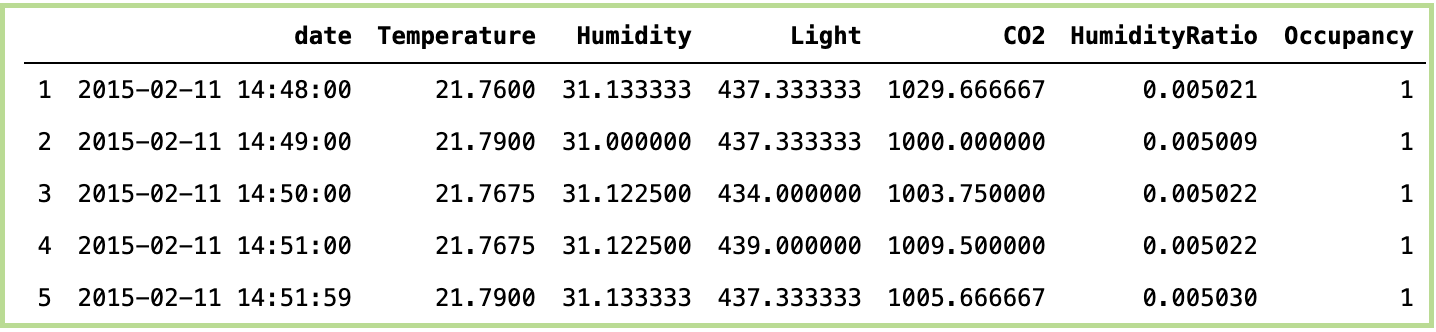
Occupancy Detection dataset from UCI Machine Learning Repository
UCI机器学习存储库中的 占用检测数据集
A sample of dataset looks something like below:
数据集样本如下所示:
1.日期: (1. Date:)
#Importing the package:
import pandas as pd


# Getting the date:
data['Date'] = data['date'].dt.date


# Pring the date:
data['Date'].head()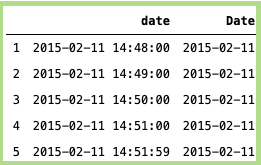
2.时间: (2. Time:)
#Importing the package:
import pandas as pd


# Getting the Time:
data['Time'] = data['date'].dt.time


# Pring the time:
data[['date','Time']].head()
3小时: (3. Hour:)
#Importing the package:
import pandas as pd


# Getting the Hour:
data['Hour'] = data['date'].dt.hour


# Pring the time:
data[['date','Hour']].sample(n=10)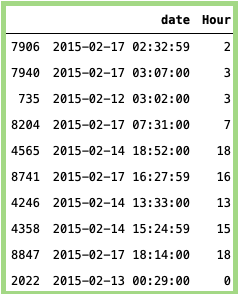
4.分钟: (4. Minute:)
#Importing the package:
import pandas as pd


# Getting the Minutes:
data['Minute'] = data['date'].dt.minute


# Pring the Minutes:
data[['date','Minute']].sample(n=10)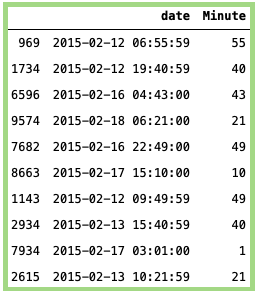
5.第二: (5. Second:)
# Importing the package:
import pandas as pd


# Getting the Seconds:
data['Second'] = data['date'].dt.second


# Pring the Seconds:
data[['date','Second']].sample(n=10)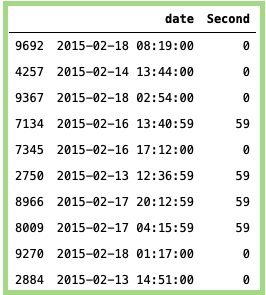
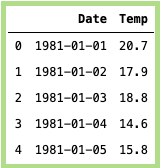
Taking dataset for daily minimum temperature which can be found here. The head of the dataset looks something like below:
可以在这里找到每日最低温度的数据集。 数据集的标题如下所示:
6.一年中的一周: (6. Week of the year:)
# Getting the week of year:
data_min_temp['Week_of_year'] = data_min_temp['Date'].dt.week


# Taking random samples:
data_min_temp[['Date','Week_of_year']].sample(n=10)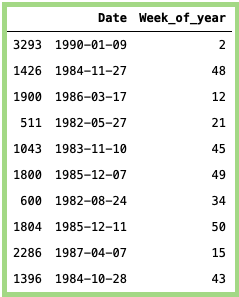
7.星期几: (7. Day of the week:)
# Getting the day of week:
data_min_temp['day_of_week'] = data_min_temp['Date'].dt.dayofweek


# Taking random samples:
data_min_temp[['Date','day_of_week']].sample(n=10)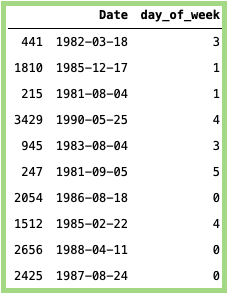
8.一年中的一天: (8. Day of the year:)
# Getting the day of year:
data_min_temp['day_of_year'] = data_min_temp['Date'].dt.dayofyear


# Taking random sample
data_min_temp[['Date','day_of_year']].sample(n=10)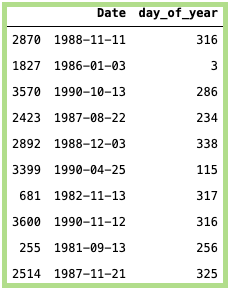
9.两个日期之间的天数差异: (9. Difference between two dates in terms of days:)
This feature is calculating the differencing between two dates in terms of days. Below is an example to show between today and some x date in past.
此功能正在根据天数计算两个日期之间的时差。 下面是显示从今天到过去某个x日期的示例。
# Getting the month difference from today:
data_min_temp['days_diff_from_today'] = (datetime.datetime.now() - data_min_temp['Date']).dt.days


# Taking random sample:
data_min_temp[['Date','days_diff_from_today']].sample(10)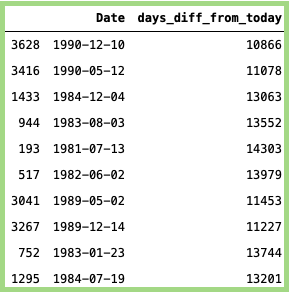
10.两个日期之间的月份差异: (10. Difference between two dates in terms of month:)
This feature is similar to above where we are calculating the differencing between two dates in terms of months instead of days. Below is an example to show between today and some x date in past.
此功能类似于上面的功能,在此我们以月而不是天为单位来计算两个日期之间的时差。 下面是显示从今天到过去某个x日期的示例。
# Getting the month difference from today:
data_min_temp['month_diff_from_today'] = (datetime.datetime.now() - data_min_temp['Date']).dt.days//30


# Taking random sample:
data_min_temp[['Date','month_diff_from_today']].sample(10)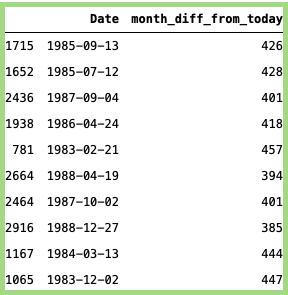
11.到月底的天数: (11. Days to end of the month:)
This is an interesting feature where you calculate the number of days remaining to reach the end of the month. It can be really helpful in problems where there is a trend as approaching towards the end of the month
这是一个有趣的功能,您可以在其中计算到月底为止的剩余天数。 对于到月底有趋势的问题,它真的很有帮助
# Import one more package:
from calendar import monthrange


# Define a function to get end of the month:
def last_day_of_month(date_value):
    return date_value.replace(day = monthrange(date_value.year, date_value.month)[1])

# Calculate the number of days to end of the month:
data_min_temp['days_to_end_of_the_month'] = data_min_temp['Date'].apply(lambda x: (last_day_of_month(x) - x).days)


# Taking random sample:
data_min_temp[['Date','days_to_end_of_the_month']].sample(10)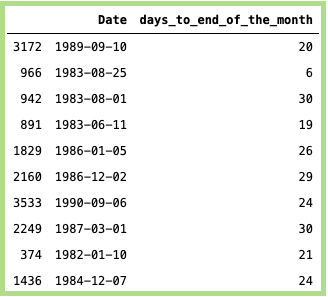
Similarly, one can also calculate days_from_the_start_of_the_month. One can also calculate days_to_thanksgiving, etc.
同样,也可以计算days_from_the_start_of_the_month。 也可以计算days_to_thanksgiving等。
12.一年的季度: (12. Quarter of the year:)
This feature is mainly to determine the quarter of the year.
此功能主要是确定一年的季度。
# Calculate the quarter:
data_min_temp['quarter'] = data_min_temp['Date'].dt.quarter


# Taking random sample:
data_min_temp[['Date','quarter']].sample(10)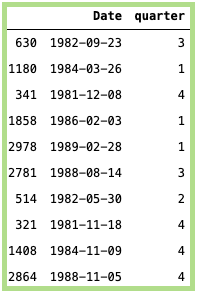
13:确定是否是该季度的开始: (13: Determine if it is start of the Quarter:)
This feature is used to determine if the date is the beginning of the quarter.
此功能用于确定日期是否为季度的开始。
# Calculate the quarter:
data_min_temp['is_quarter_start'] = data_min_temp['Date'].dt.is_quarter_start


# Mapping the value (True = 1 and False = 0):
data_min_temp['is_quarter_start'] = data_min_temp['is_quarter_start'].map({True: 1, False:0})


# Taking random sample:
data_min_temp[['Date','is_quarter_start']].sample(10)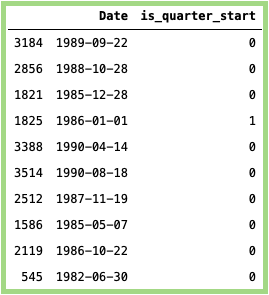
The output is usually in terms of boolean. Mapping the True False to 1 and 0
输出通常是布尔值。 将真假映射到1和0
14:确定是否在该季度末: (14: Determine if it is the end of the quarter:)
This is opposite to the above feature where we determine if the date is the end of the quarter.
这与上面的功能相反,在上面的功能中,我们确定日期是否为季度末。
# Calculate the quarter end:
data_min_temp['is_quarter_end'] = data_min_temp['Date'].dt.is_quarter_end


# Mapping the value (True = 1 and False = 0):
data_min_temp['is_quarter_end'] = data_min_temp['is_quarter_end'].map({True: 1, False:0})


# Taking random sample:
data_min_temp[['Date','is_quarter_end']].sample(10)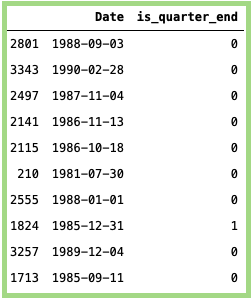
15.年份: (15. Year:)
The feature is used to calculate the year from the date.
该功能用于从日期开始计算年份 。
# Calculate the year:
data_min_temp['year'] = data_min_temp['Date'].dt.year


# Taking random sample:
data_min_temp[['Date','year']].sample(10)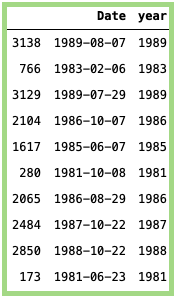
16.月: (16. Month:)
The feature is used to calculate the month from the date.
该功能用于从日期算起月份 。
# Calculate the month:
data_min_temp['month'] = data_min_temp['Date'].dt.month


# Taking random sample:
data_min_temp[['Date','month']].sample(10)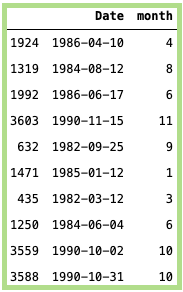
17.日: (17. Day:)
The feature is used to calculate the day from the date.
该功能用来计算之日起的那一天 。
# Calculate the day:
data_min_temp['day'] = data_min_temp['Date'].dt.day


# Taking random sample:
data_min_temp[['Date','day']].sample(10)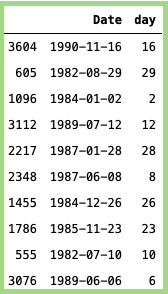
18.确定是否是月初: (18. Determine if it is the start of the month:)
Based on the date, this feature determines if it is the start of the month
根据日期,此功能确定是否为月初
# Calculate the day:
data_min_temp['is_month_start'] = data_min_temp['Date'].dt.is_month_start
›
# Mapping the value (True = 1 and False = 0):
data_min_temp['is_month_start'] = data_min_temp['is_month_start'].map({True: 1, False:0})


# Taking random sample:
data_min_temp[['Date','is_month_start']].sample(10)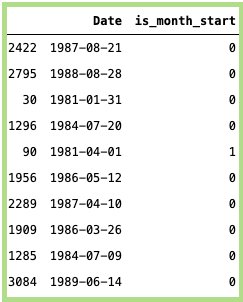
19.确定是否是月底: (19. Determine if it is the end of the month:)
Based on the date, this feature determines if it is the end of the month
根据日期,此功能确定是否是月底
# Calculate the day:
data_min_temp['is_month_end'] = data_min_temp['Date'].dt.is_month_end


# Mapping the value (True = 1 and False = 0):
data_min_temp['is_month_end'] = data_min_temp['is_month_end'].map({True: 1, False:0})


# Taking random sample:
data_min_temp[['Date','is_month_end']].sample(10)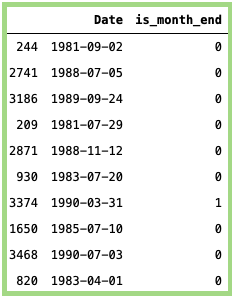
20.确定是否是Le年: (20. Determine if it is a Leap Year:)
Sometimes, when the data is for a longer period of time (like 10–15 years) or if the data’s granularity is yearly, then this feature could be really useful. Instead of manually finding and creating, one could directly determine using datetime library, if it is a leap year or not.
有时,当数据使用时间较长(例如10到15年)或数据的粒度为每年一次时,此功能可能非常有用。 如果不是manually年 ,则可以直接确定使用日期时间库,而不是手动查找和创建。
# Calculate the day:
data_min_temp['is_leap_year'] = data_min_temp['Date'].dt.is_leap_year


# Mapping the value (True = 1 and False = 0):
data_min_temp['is_leap_year'] = data_min_temp['is_leap_year'].map({True: 1, False:0})


# Taking random sample:
data_min_temp[['Date','is_leap_year']].sample(10)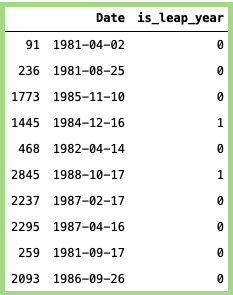
结论: (Conclusion:)
Thank you for reading the article. I hope you would have found it useful. These are some of the features which I often used in any of the time series problems I work with. As I mentioned before this can help uncover a lot of hidden facts beneath the data. As someone has rightly said — “The more you torture the data, the more it speaks”. Any feedback/comments are always appreciated. If there are any interesting features that you know please comment and share it with the community!
感谢您阅读这篇文章。 希望您会发现它有用。 这些是我经常使用的任何时间序列问题中经常使用的一些功能。 正如我之前提到的,这可以帮助发现数据下的许多隐藏事实。 正如某人正确说的那样:“您对数据的折磨越多,它讲的越多”。 任何反馈/评论总是很感激。 如果您知道任何有趣的功能,请评论并与社区分享!
用于时间序列的数据


 被折叠的 条评论
为什么被折叠?
被折叠的 条评论
为什么被折叠?
 到【灌水乐园】发言


