


There are many definitions of time series data, all of which indicate the same meaning in a different way. A straightforward definition is that time series data includes data points attached to sequential time stamps.
时间序列数据有许多定义,所有定义都以不同的方式表示相同的含义。 一个简单的定义是时间序列数据包括附加到顺序时间戳的数据点。
The sources of time series data are periodic measurements or observations. We observe time series data in many industries. Just to give a few examples:
时间序列数据的来源是定期的测量或观察。 我们观察了许多行业的时间序列数据。 仅举几个例子:
- Stock prices over time 随着时间的过去股价
- Daily, weekly, monthly sales 每日,每周,每月销售
- Periodic measurements in a process 流程中的定期测量
- Power or gas consumption rates over time 一段时间内的电力或天然气消耗率
In this post, I will list 20 points that will help you gain a comprehensive understanding of handling time series data with Pandas.
在本文中,我将列出20点,以帮助您全面了解如何使用Pandas处理时间序列数据。
Different forms of time series data
不同形式的时间序列数据
Time series data can be in the form of a specific date, time duration, or fixed defined interval.
时间序列数据可以采用特定日期,持续时间或固定定义的时间间隔的形式。
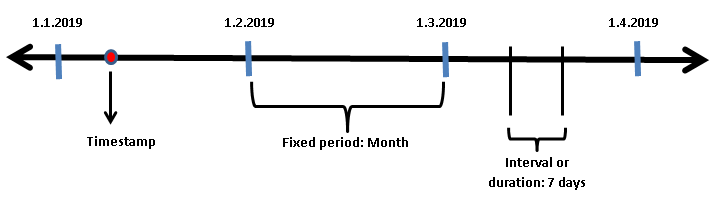
Timestamp can be the date of a day or a nanosecond on a given day depending on the precision. For example, ‘2020–01–01 14:59:30’ is a second-based timestamp.
时间戳记可以是一天中的日期,也可以是给定日期中的纳秒级,具体取决于精度。 例如,“ 2020-01-01 01:59:30”是基于秒的时间戳。
2. Time series data structures
2.时间序列数据结构
Pandas provides flexible and efficient data structures to work with all kinds of time series data.
熊猫提供了灵活高效的数据结构,可以处理各种时间序列数据。
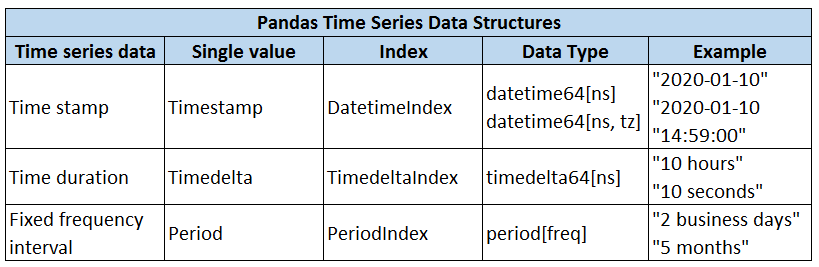
In addition to these 3 structures, Pandas also supports the date offset concept which is a relative time duration that respects calendar arithmetic.
除了这三种结构外,Pandas还支持日期偏移量概念,这是一种尊重日历算术的相对持续时间。
3. Creating a timestamp
3.创建一个时间戳
The most basic time series data structure is timestamp which can be created using to_datetime or Timestamp functions
最基本的时间序列数据结构是时间戳,可以使用to_datetime或Timestamp函数创建
import pandas as pdpd.to_datetime('2020-9-13')
Timestamp('2020-09-13 00:00:00')pd.Timestamp('2020-9-13')
Timestamp('2020-09-13 00:00:00')
4. Accessing the information hold by a timestamp
4.访问时间戳保存的信息
We can get information about the day, month, and year stored in a timestamp.
我们可以获取有关存储在时间戳中的日期,月份和年份的信息。
a = pd.Timestamp('2020-9-13')a.day_name()
'Sunday'a.month_name()
'September'a.day
13a.month
9a.year
2020
5. Accessing not-so-obvious information
5.访问不太明显的信息
Timestamp objects also hold information about date arithmetic. For instance, we can ask if the year is a leap year. Here are some of the more specific information we can access:
时间戳记对象还保存有关日期算术的信息。 例如,我们可以询问年份是否为a年。 以下是一些我们可以访问的更具体的信息:
b = pd.Timestamp('2020-9-30')b.is_month_end
Trueb.is_leap_year
Trueb.is_quarter_start
Falseb.weekofyear
40
6. European style date
6.欧式日期
We can work with the European style dates (i.e. day comes first) with the to_datetime function. The dayfirst parameter is set as True.
我们可以使用to_datetime函数处理欧式日期(即日期优先)。 dayfirst参数设置为True。
pd.to_datetime('10-9-2020', dayfirst=True)
Timestamp('2020-09-10 00:00:00')pd.to_datetime('10-9-2020')
Timestamp('2020-10-09 00:00:00')
Note: If the first item is greater than 12, Pandas knows it cannot be a month.
注意:如果第一个项目大于12,Pandas知道它不可能是一个月。
pd.to_datetime('13-9-2020')
Timestamp('2020-09-13 00:00:00')
7. Converting a dataframe to time series data
7.将数据帧转换为时间序列数据
The to_datetime function can convert a dataframe with appropriate columns to a time series. Consider the following dataframe:
to_datetime函数可以将具有适当列的数据帧转换为时间序列。 考虑以下数据框:
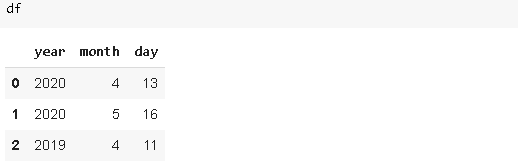
pd.to_datetime(df)0   2020-04-13
1   2020-05-16
2   2019-04-11
dtype: datetime64[ns]
8. Beyond a timestamp
8.超越时间戳
In real-life cases, we almost always work sequential time series data rather than individual dates. Pandas makes it very simple to work with sequential time series data as well.
在现实生活中,我们几乎总是处理时序时间序列数据,而不是单个日期。 Pandas也使处理顺序时间序列数据变得非常简单。
We can pass a list of dates to the to_datetime function.
我们可以将日期列表传递给to_datetime函数。
pd.to_datetime(['2020-09-13', '2020-08-12',
'2020-08-04', '2020-09-05'])DatetimeIndex(['2020-09-13', '2020-08-12', '2020-08-04', '2020-09-05'], dtype='datetime64[ns]', freq=None)
The returned object is a DatetimeIndex.
返回的对象是DatetimeIndex。
There are more practical ways to create sequences of dates.
有更多实用的方法来创建日期序列。
9. Creating a time series with to_datetime and to_timedelta
9.使用to_datetime和to_timedelta创建一个时间序列
A DatetimeIndex can be created by adding a TimedeltaIndex to a timestamp.
可以通过将TimedeltaIndex添加到时间戳来创建DatetimeIndex。
pd.to_datetime('10-9-2020') + pd.to_timedelta(np.arange(5), 'D')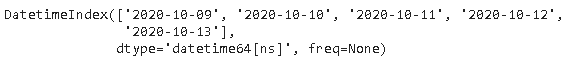
‘D’ is used for ‘day’ but there are many other options available. You can check the whole list here.
'D'表示'day',但还有许多其他选项可用。 您可以在此处查看整个列表。
10. The date_range function
10. date_range函数
It provides a more flexible way to create a DatetimeIndex.
它提供了一种更灵活的方法来创建DatetimeIndex。
pd.date_range(start='2020-01-10', periods=10, freq='M')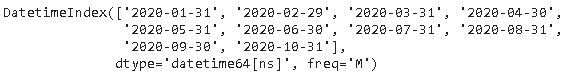
The periods parameter specifies the number of items in the index. The freq is the frequency and ‘M’ indicates the last day of a month.
Periods参数指定索引中的项目数。 频率是频率,“ M”表示一个月的最后一天。
The date_range is pretty flexible in terms of the arguments for the freq parameter.
就freq参数的参数而言,date_range非常灵活。
pd.date_range(start='2020-01-10', periods=10, freq='6D')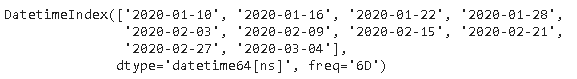
We have created an index with a frequency of 6 days.
我们创建的索引的频率为6天。
11. The period_range function
11. period_range函数
It returns a PeriodIndex. The syntax is similar to the date_range function.
它返回一个PeriodIndex。 语法类似于date_range函数。
pd.period_range('2018', periods=10, freq='M')
12. The timedelta_range function
12. timedelta_range函数
It returns a TimedeltaIndex.
它返回一个TimedeltaIndex。
pd.timedelta_range(start='0', periods=24, freq='H')
13. Time zones
13.时区
By default, time series objects of pandas do not have an assigned time zone.
默认情况下,熊猫的时间序列对象没有分配的时区。
dates = pd.date_range('2019-01-01','2019-01-10')dates.tz is None
True
We can assign a time zone to these objects using the tz_localize method.
我们可以使用tz_localize方法为这些对象分配时区。
dates_lcz = dates.tz_localize('Europe/Berlin')dates_lcz.tz
<DstTzInfo 'Europe/Berlin' LMT+0:53:00 STD>
14. Create a time series with an assigned time zone
14.创建具有指定时区的时间序列
We can also create a time series object with a time zone using tz keyword argument.
我们还可以使用tz关键字参数创建一个带有时区的时间序列对象。
pd.date_range('2020-01-01', periods = 5, freq = 'D', tz='US/Eastern')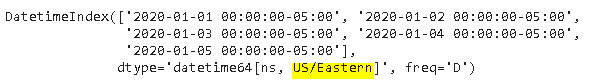
15. Offsets
15.偏移
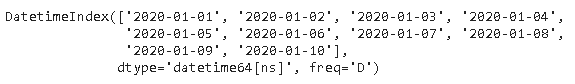
Consider we have a time series index and want to offset all the dates for a specific time.
假设我们有一个时间序列索引,并且想要偏移特定时间的所有日期。
A = pd.date_range('2020-01-01', periods=10, freq='D')
A
Let’s add an offset of one week to this series.
让我们为该系列增加一个星期的补偿。
A + pd.offsets.Week()
16. Shifting time series data
16.移位时间序列数据
Time series data analysis may require to shift data points to make a comparison. The shift function shifts data in time.
时间序列数据分析可能需要移动数据点以进行比较。 移位功能会及时移位数据。
A.shift(10, freq='M')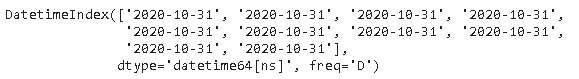
17. Shift vs tshift
17. Shift与TShift
- shift: shifts the data 移位:移位数据
- tshift: shifts the time index tshift:移动时间索引
Let’s create a dataframe with a time series index and plot it to see the difference between shift and tshift.
让我们创建一个具有时间序列索引的数据帧,并对其进行绘制以查看shift和tshift之间的差异。
dates = pd.date_range('2020-03-01', periods=30, freq='D')
values = np.random.randint(10, size=30)
df = pd.DataFrame({'values':values}, index=dates)df.head()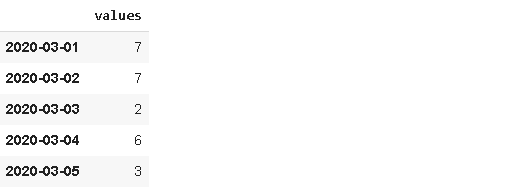
Let’s plot the original time series along with the shifted and tshifted ones.
让我们绘制原始时间序列以及移位和t移位的时间序列。
import matplotlib.pyplot as pltfig, axs = plt.subplots(nrows=3, figsize=(10,6), sharey=True)
plt.tight_layout(pad=4)
df.plot(ax=axs[0], legend=None)
df.shift(10).plot(ax=axs[1], legend=None)
df.tshift(10).plot(ax=axs[2], legend=None)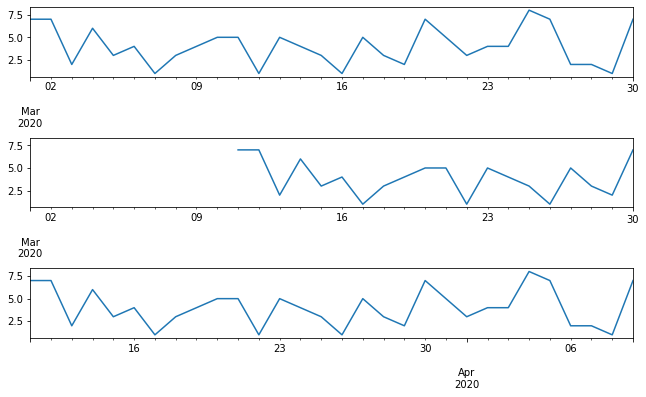
18. Resampling with the resample function
18.使用重采样功能进行重采样
Another common operation with time series data is resampling. Depending on the task, we may need to resample data at a higher or lower frequency.
时间序列数据的另一个常见操作是重新采样。 根据任务,我们可能需要以更高或更低的频率重新采样数据。
Resample creates groups (or bins) of specified internal and lets you do aggregations on groups.
重新采样可创建指定内部组件的组(或容器),并允许您对组进行汇总。
Let’s create a Pandas series with 30 values and a time series index.
让我们创建一个包含30个值和一个时间序列索引的Pandas系列。
A = pd.date_range('2020-01-01', periods=30, freq='D')
values = np.random.randint(10, size=30)
S = pd.Series(values, index=A)
The following will return the averages of 3 day periods.
以下内容将返回3天的平均值。
S.resample('3D').mean()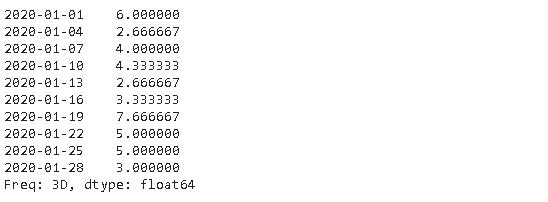
19. Asfreq function
19. Asfreq函数
In some cases, we may be interested in the values at certain frequencies. Asfreq function returns the value at the end of the specified interval. For instance, we may only need the values at every 3 days (not a 3-day average) in the series we created in the previous step.
在某些情况下,我们可能会对某些频率下的值感兴趣。 Asfreq函数在指定间隔的末尾返回值。 例如,在上一步创建的系列中,我们可能仅需要每3天(而不是3天平均值)的值。
S.asfreq('3D')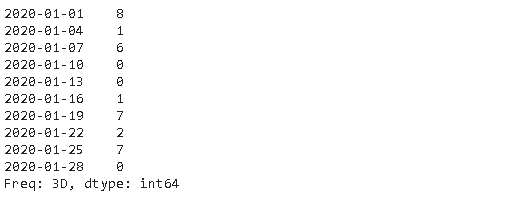
20. Rolling
20.滚动
Rolling is a very useful operation for time series data. Rolling means creating a rolling window with a specified size and perform calculations on the data in this window which, of course, rolls through the data. The figure below explains the concept of rolling.
滚动对于时间序列数据是非常有用的操作。 滚动表示创建具有指定大小的滚动窗口,并在该窗口中对数据进行计算,而该窗口当然会滚动数据。 下图说明了滚动的概念。
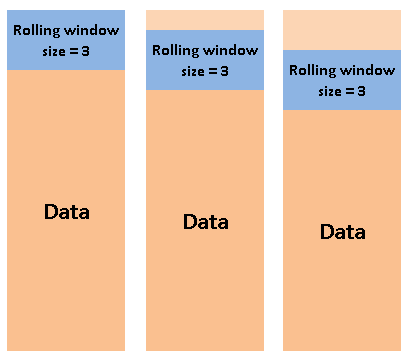
It is worth noting that the calculation starts when the whole window is in the data. In other words, if the size of the window is three, the first aggregation is done in the third row.
值得注意的是,当整个窗口都在数据中时,计算开始。 换句话说,如果窗口的大小为三,则第一聚合在第三行中完成。
Let’s apply a 3-day rolling window to our series.
让我们为我们的系列应用3天滚动窗口。
S.rolling(3).mean()[:10]
结论 (Conclusion)
We have covered a comprehensive introduction to time series analysis with Pandas. It is worth noting that Pandas provides much more in terms of time series analysis.
我们已经对熊猫的时间序列分析进行了全面介绍。 值得注意的是,熊猫提供了更多的时间序列分析。
The official documentation covers all the functions and methods of time series. It may seem exhaustive at first glance but you will get comfortable by practicing.
官方文档涵盖了时间序列的所有功能和方法。 乍一看似乎很详尽,但是通过练习您会感到很舒服。
Thank you for reading. Please let me know if you have any feedback.
感谢您的阅读。 如果您有任何反馈意见,请告诉我。
翻译自: https://towardsdatascience.com/20-points-to-master-pandas-time-series-analysis-f90155ee0e8a


 2637
2637

 被折叠的 条评论
为什么被折叠?
被折叠的 条评论
为什么被折叠?
 到【灌水乐园】发言


