


Baseball managers have a crucial job, so as teams increase their quantification of player performance we turn the lens of Sabermetrics to the bench bosses.
棒球经理的工作至关重要,因此,随着球队增加对球员表现的量化,我们将Sabermetrics的视角转向了板凳老板。
Much criticism has been levied onto baseball managers and their inability to see past the archetypal dominate closer who exclusively pitches in Save situations. Writers in the statistical community have observed and critiqued the many flaws which come with the Save statistic and how it’s perceived by fans, managers and baseball decision-makers as far back at least 2008.[1] Accumulating Saves is a function of opportunity and degree of difficulty which is not the best way to get at a relief pitchers ability to get outs. More objective methods Earned Run Average (ERA) and its estimators like Fielding Independent Pitching (FIP) and Skill-Interactive Earned Run Average (SIERA) are better ways to evaluate a pitcher’s talent and Win Probability Added (WPA) is better for measuring a pitcher’s import to winning games for whatever it’s worth. This criticism has definitely been heard in the intervening years by people running ball teams which can be shown by the number of pitchers who are getting Saves on each team and the variance of Save totals for a given team.
人们对棒球管理者提出了很多批评,他们无视过去的原型者占主导地位,而后者仅在“拯救”状态下投球。 统计界的作家已经观察到并批评了Save统计数据所带来的许多缺陷,以及至少在2008年之前球迷,经理和棒球决策者对它的看法。 [1]积累储蓄是机会和程度的函数困难,这不是减轻投手出手能力的最佳方法。 更加客观的方法赢得平均成绩(ERA)及其估算器(例如,独立外场投球(FIP)和技能互动的平均平均成绩(SIERA))是评估投手天赋的更好方法,而增加的获胜概率(WPA)更适合衡量投手的不论价值多少,均可导入获胜游戏。 在过去的几年中,经营球队的人肯定听到了这种批评,这可以通过每个队获得节省的投手数量以及特定球队的节省总数的变化来表明。
A team with high variance in their Save totals means that there is one player accumulating a lot of Saves and some number who have very few opposed to lower variance representing a more even distribution of Saves among pitchers. This variance metric is heavily negatively correlated (-0.74) with the with the number of pitchers a team has recording a Save in a given season. Which means the more pitchers recording a Save on a team the more likely the distribution is to be equitable and the insistence on using your best pitcher in only a Save situation is lower. Based on this analysis, somewhere between 2008 and 2011 was the peak on the capital “C” Closer in Major League Baseball. A rather precipitous drop off of the closer occurred in 2016 and has continued on a downward trajectory to the point where last year saw the most equitable distribution of saves among teams since 1987, excluding the lockout shorten 1994 season.
一支球队的总扑救差异较大,这意味着有一名球员积累了很多扑救,而有些人则很少反对较低的偏见,这意味着投手之间的扑救分布更为平均。 这个差异指标与球队在给定赛季中记录了扑救的投手数量呈负相关(-0.74)。 这意味着越多的投手在球队上记录下一场扑救,就越有可能获得公平的分配,而仅在扑救情况下使用最佳投手的坚持性就更低。 根据此分析,2008年至2011年之间是美国职业棒球大联盟首府“ C”赛区的顶峰。 在2016年发生了一次相当大的下滑,并持续下降,直到去年,自1987年以来,各支球队之间的节省量分配最为平均,不包括1994年停摆缩短的赛季。
That’s interesting but it doesn’t tell us what managers are doing instead of strictly using their best relief pitcher in Save situations. The analyst critique proposes the superior alternative to managing to the Save would be to use your best relief options in the highest leverage moments of the game regardless of inning. One problem with that is, ordering the highest leverage to lowest leverage moments can only be done after all the decisions have been made. However, it is not completely unpredictable while in the game and managers certainly can come closer to aligning pitcher quality to leverage than merely pitching their closers in the ninth. In order to analyze if managers are indeed following through on this alternative, we must first define leverage and quantify it. Fortunately, Fangraphs has done exactly this and offers the numeric leverage estimate for each plate appearance dating back to 1974.
这很有趣,但是它并没有告诉我们管理人员在做什么,而不是告诉我们在“节省”情况下严格使用他们最好的救济投手。 分析家的批评认为,比起“节省”,更好的选择是在游戏的最高杠杆时间内使用最佳的缓解选项,而不考虑局数。 这样做的一个问题是,只有在做出所有决定后,才能将最高杠杆率定为最低杠杆矩。 但是,这并不是完全不可预测的,在游戏中,管理者当然可以更接近调整投手的质量以发挥杠杆作用,而不是仅仅在第九个比赛中投靠。 为了分析管理者是否确实遵循了该替代方案,我们必须首先定义杠杆并对其进行量化。 幸运的是,Fangraphs恰好做到了这一点,并提供了可追溯到1974年的每个板块外观的数字杠杆估计。
Leverage is defined in terms of win probability and its potential to fluctuate from the outcome of a given plate appearance. So, if you have a win probability estimate in State A given at least the inning, position of base runners, number of outs and score, you then consider all the possible outcomes of plate appearance (walk, fly out, home run, etc.) and calculate all those win probabilities in those hypothetical State B’s. From there, you calculate the variance of the win probabilities associated with all possible outcomes and that is your leverage. If there is a high variance in the win probabilities a plate appearance can generate then the leverage is high. For example, if the bases are loaded down by one with two outs in the bottom of the ninth inning, a plate appearance could either win the game (100% win probability), lose the game (0% win probability) or tie (approximately 50% win probability) which would be very high variance as compared to a plate appearance in a blowout where no matter what happens the game will still likely end in the same way. Using this definition of leverage, choosing the ninth inning of a close game as a proxy for high leverage isn’t bad.
杠杆率是根据获胜概率及其可能因给定板块外观的结果而波动的能力来定义的。 因此,如果您至少在状态A下获得了获胜概率估计值,至少给出了局限,基本跑垒员的位置,出局次数和得分,那么您可以考虑所有可能出现的盘面结果(步行,飞出,本垒打等)。 )并计算那些在假设B状态下的所有获胜概率。 在这里,您可以计算与所有可能的结果相关的获胜概率的方差,这就是您的杠杆率。 如果获胜概率有很大差异,那么牌面可能会产生,那么杠杆就很高。 例如,如果在第九局的底部将底数减一,两个出局,则盘面出现可能会赢得比赛(获胜概率为100%),比赛输掉(胜出概率为0%)或并列(大约) 50%的获胜概率),与井喷中的盘面情况相比,差异非常大,无论发生什么情况,游戏仍然可能以相同的方式结束。 使用这种对杠杆的定义,选择封闭游戏的第九局作为高杠杆的代理并不错。
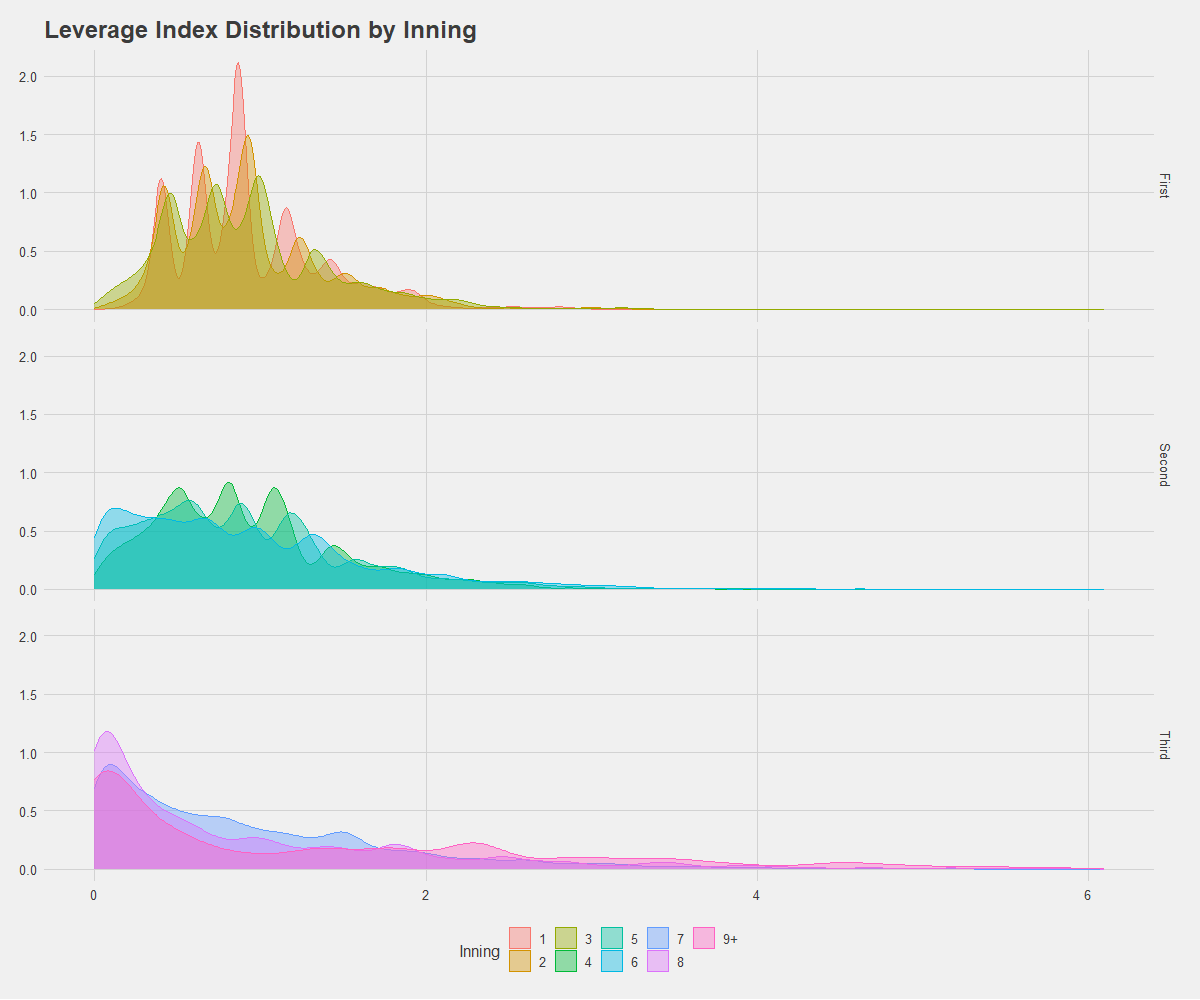
This is a plot of the distribution of leverage by inning where the innings are separated by thirds. We can see the first third of innings is distributed fairly symmetrically in terms of leverage, meaning it is not too high or too low most of the time. The middle innings are more uniformly distributed with more frequent low leverage at bats but also more frequent high leverage at bats. Finally, the remaining innings have an intense right skew which means a large portion of the plate appearances are low leverage but there is, especially in the ninth inning and extras a spike in very high leverage at bats. So, it is not unreasonable to prima facie assume that the optimal time to use your best reliever would be in the ninth. But since we do have information on the leverage of each plate appearance in a game along with who is pitching, we can get insight into which managers are most successfully getting their best pitchers into the highest leverage moments and conversely their less talented relievers in lower leverage.
这是按局分布的杠杆分布图,其中局被三分之二分开。 我们可以看到局的前三分之一在杠杆方面是相当对称分布的,这意味着在大多数情况下它不会太高或太低。 中局分布更均匀,蝙蝠的低杠杆频率更高,而蝙蝠的高杠杆频率更高。 最后,其余的局有强烈的右偏,这意味着很大一部分板块外观的杠杆率很低,但尤其是在第九局,而且蝙蝠的杠杆率非常高。 因此,表面上假设使用最佳缓解剂的最佳时间在第九位,这并非没有道理。 但是,由于我们确实掌握了有关游戏中每个板块外观的杠杆作用以及谁在进行投球的信息,因此我们可以洞悉哪些经理最成功地将最佳投手带入了最高杠杆时刻,反之,他们的才华横溢的缓解者却在较低的杠杆率下。
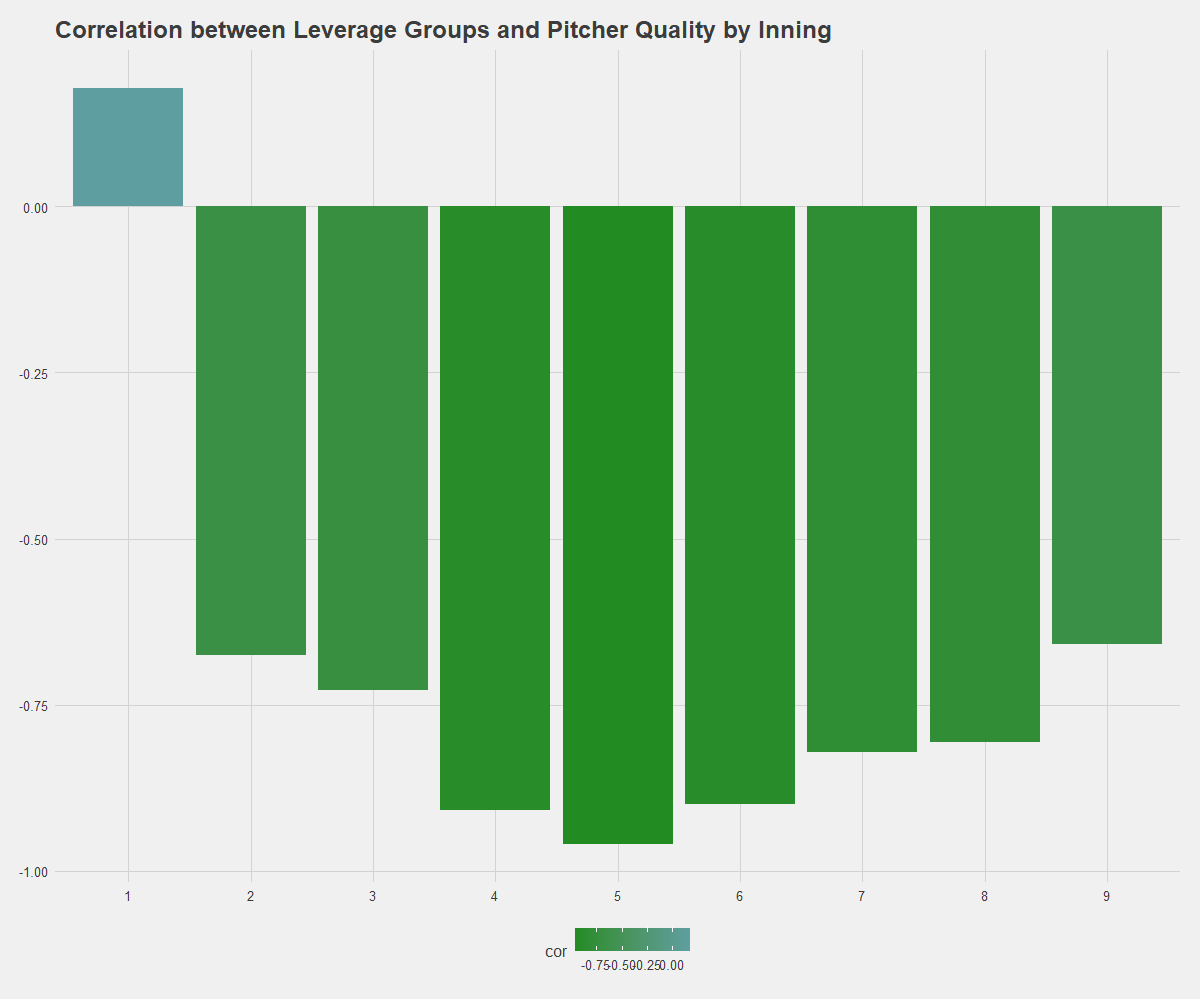
In order to evaluate pitcher quality, I used a three-year weighted average of FIP and excluded position pitchers. Additionally, I made the FIP relative to the options available on the team where a low score is an indication of a high-quality pitching. I then investigated each plate appearance in the 2015–2019 regular seasons and observed the correlation between pitcher quality and leverage by inning.
为了评估投手质量,我使用了FIP的三年加权平均值,但排除了位置投手。 此外,我将FIP与团队中可用的选项相对应,其中低分表示高质量的投球。 然后,我调查了2015-2019常规赛季的每个板块外观,并观察了投手质量与投篮杆之间的相关性。

Perhaps unsurprisingly, the first few innings show very little correlation between FIP and leverage but it increases (in negative strength) as the game goes on and peaks in the ninth. However, what did take me aback was how weak the correlation was, peaking at -.25, not particularly strong. A little poking around actually leads us back to the first diagram of the distribution of leverage. Since there is a negative exponential distribution, most plate appearances in the latter innings are relative low leverage in comparison. This requires good pitchers to pitch in lower leverage situations fairly often. Moreover, when a good pitcher pitches well the leverage doesn’t get higher than it otherwise could. To analyze the true area of interest, I separated the leverage variable into blocks and looked at the average quality of those pitchers. There were 5 blocks which could be considered: blowout territory, run of the mill 4–5 lead in the middle innings, medium to small lead in the middle innings, 1–3 run lead in the late innings and lastly, peak house on fire, call Goose Gossage leverage.
也许不足为奇,前几局显示FIP和杠杆之间的相关性很小,但是随着比赛的进行并在第九高峰达到顶峰(负强度)。 但是,令我吃惊的是相关性多么弱,峰值为-.25,不是特别强。 稍加摸索实际上会使我们回到第一个杠杆分布图。 由于存在负指数分布,因此相比之下,后一局中的大多数车牌出场率都相对较低。 这要求优秀的投手经常在较低杠杆率的情况下投球。 而且,当一个好的投手很好地投球时,杠杆不会比其他情况高。 为了分析真正感兴趣的领域,我将杠杆变量分成多个块,并查看了那些投手的平均质量。 可以考虑5个块:井喷区域,中场的轧机运行4–5铅,中场的中到小铅,末局的1-3运行铅,最后是火势旺盛的房子,请致电Goss Gossage杠杆。
Bingo! We’ve got something like the correlation we were expecting. What we see is the average pitcher in each of these five situations gets progressively better which makes a lot of sense. However, the pattern over innings isn’t what one would expect, with peak correlation occurring in the middle innings and a large drop (in strength) in the ninth. The reason why, is the fact that we see closers so often in the ninth in any save situation which spans a large range of the leverage values. This does however seem to be a good variable to target when trying to understand if a manager is tailoring his pitching decisions to the leverage rather than the inning.
答对了! 我们有一些我们期望的相关性。 我们看到的是,在这五种情况下,平均投手逐渐变得更好,这很有意义。 但是,局局上的模式并不是人们所期望的,中局有峰值相关性,而第九局出现了很大的下降(强度)。 之所以这样,是因为在任何跨越较大杠杆值范围的保存情况下,我们经常会在第九个看到如此接近。 但是,在试图了解经理是否根据杠杆而非局限调整自己的投球决策时,这似乎是一个很好的目标变量。
Here is top the list for manager seasons in the last 5 years and their correlation between team adjusted FIP and leverage in the late innings accounting for the managers best relief option as well as the range and the variance of those options (negative implies good management).
以下是过去五年中经理赛季的榜首,球队调整后的FIP与后期比赛中的杠杆之间的相关性考虑了经理的最佳救济选择以及这些选择的范围和方差(负值表示良好的管理) 。
Conversely, the bottom of the list looks like this
相反,列表的底部看起来像这样
Here is the complete list of scores for managers with more than 50 games managed in a of the seasons.
这是在一个季节中管理超过50场比赛的经理得分的完整列表。
Looking at the top and bottom of the list brings some interesting names and interestingly, some managers appear on both lists. Naturally then, it’s reasonable to ask how much is this really telling us about the manager. From year to year there is some correlation in a manager’s score but it has decrease through time starting around .4 correlation in the first three years down near 0 from 2018 to 2019. Perhaps there was an advantage in late inning bullpen usage being gained in 2015–2016 by mangers like Kevin Cash or Joe Girardi but certainly there is more work to do to connect these points. How a manager affects winning will always be nebulous and largely a function of intangibles but it doesn’t have to be entirely so. Holding decision makers to a logical plan and attempting to quantify their ability to executed will be another tool in the tool belt we use to evaluate managers. The relationship between quality of pitcher on the mound and leverage of the game has many nuisance factors surely, but more work on uncovering these will prove crucial in shining light on which managers are making the best decisions consistently to give their team the best chance to win.
查看列表的顶部和底部会带来一些有趣的名称,有趣的是,两个列表中都出现了一些经理。 那么自然而然地,有理由问这到底能告诉我们有关经理的多少信息。 每年,经理人的分数都有一定的相关性,但随着时间的推移,相关性在前三年开始下降,相关性从.4下降到2018年至2019年的近0。2015年后期牛栏使用率的提高可能是有优势的–2016年,像Kevin Cash或Joe Girardi这样的经理,但是肯定有更多工作要做以联系这些观点。 经理如何影响胜利永远是模棱两可的,并且在很大程度上取决于无形资产,但不一定完全如此。 使决策者遵循合理的计划并尝试量化其执行能力将是我们用来评估经理的工具带中的另一个工具。 土堆上投手的质量与比赛杠杆之间的关系肯定会存在许多令人讨厌的因素,但是发现这些因素的更多工作将证明,至关重要的是,管理者正在不断做出最佳决策,从而为其团队提供获胜的最佳机会。
Code available for web scraping and analysis: https://github.com/peterloiseau/manager_analysis
可用于网络抓取和分析的代码: https : //github.com/peterloiseau/manager_analysis
[1] Sheehan, Joe. “Prospectus Today.” Baseball Prospectus, Baseball Prospectus, 11 Sept. 2008, web.archive.org/web/20100213073350/www.baseballprospectus.com/article.php?articleid=8060.
[1]希恩,乔。 “今天的招股说明书。” 《棒球章程》 ,《棒球章程》,2008年9月11日,web.archive.org / web / 20100213073350 / www.baseballprospectus.com / article.php?articleid = 8060。
翻译自: https://medium.com/swlh/mlb-managers-and-ninth-inning-fallacy-b15a3699bd9d


 被折叠的 条评论
为什么被折叠?
被折叠的 条评论
为什么被折叠?
 到【灌水乐园】发言


