


帆软bi 观远bi
I’ve described the basics of joins in my first article. Hope you have found it helpful. In this article, I will show you how these joins can be done using Power BI’s Power Query and also in R using dplyr.
我已经在第一篇文章中介绍了联接的基础知识。 希望对您有所帮助。 在本文中,我将向您展示如何使用Power BI的Power Query以及在R中使用dplyr来完成这些联接。
Power BI has a “Click” type ( Using the mouse alot) UI while R has a “Typing” interface (Using the keyboard alot).
Power BI具有“单击”类型(大量使用鼠标)UI,而R具有“键入”界面(大量使用键盘)。
I love both and hope you will too.
我俩都爱,希望你也一样。
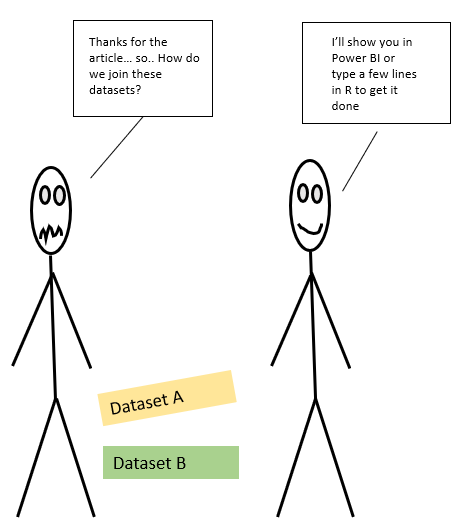
Let’s get back to our little stick figures — useful right?
让我们回到我们的小棍子-有用吗?
Let’s get into it!
让我们开始吧!
Let’s load in our data :) Two tiny data sets, but great for our examples.
让我们加载数据:)两个很小的数据集,但是对于我们的示例来说非常有用。
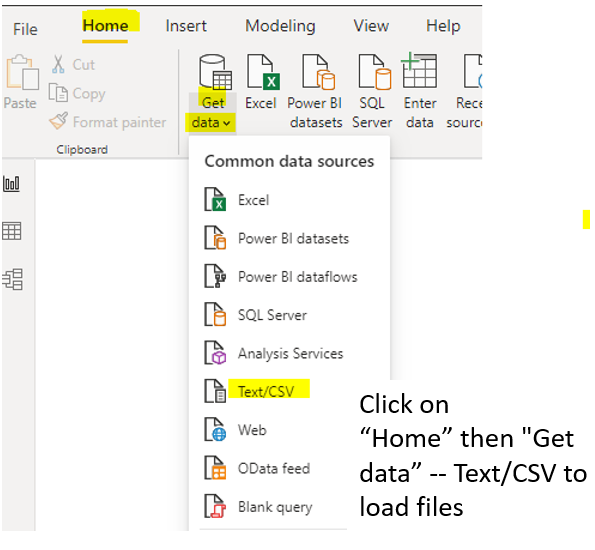
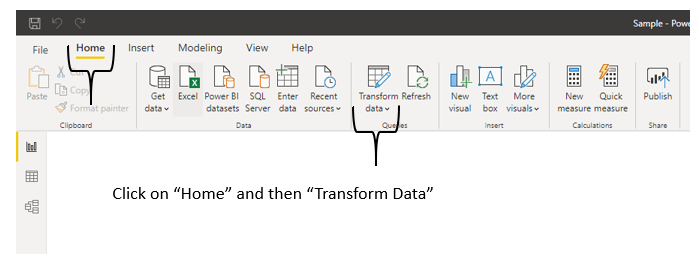
Now that they are loaded, let’s go into Power Query
现在已加载它们,让我们进入Power Query
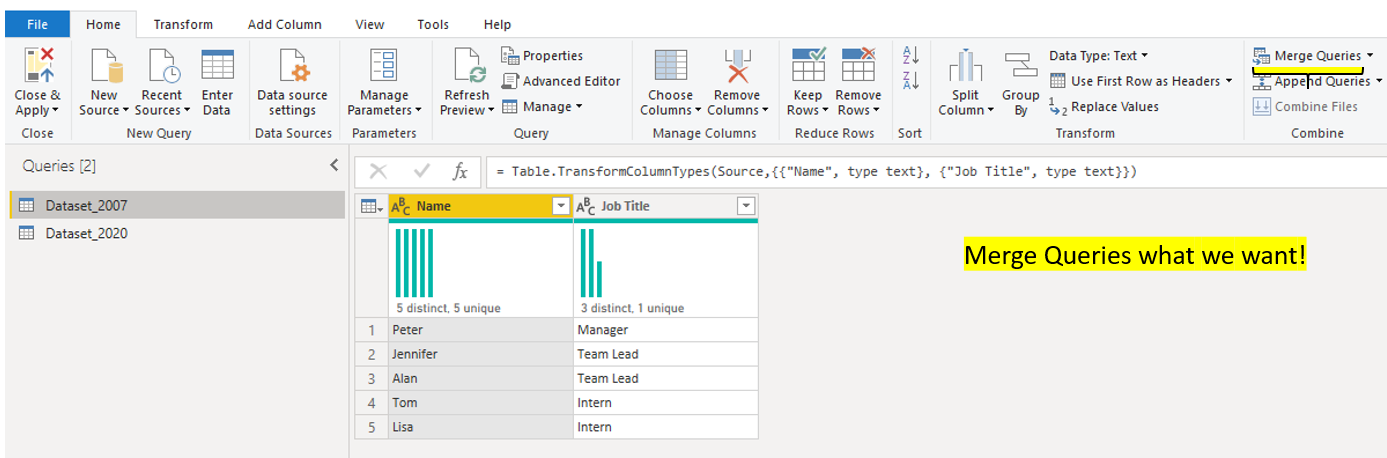
Once I am in the Power Query side — I see my two data sets.
一旦进入Power Query一侧,我就会看到两个数据集。
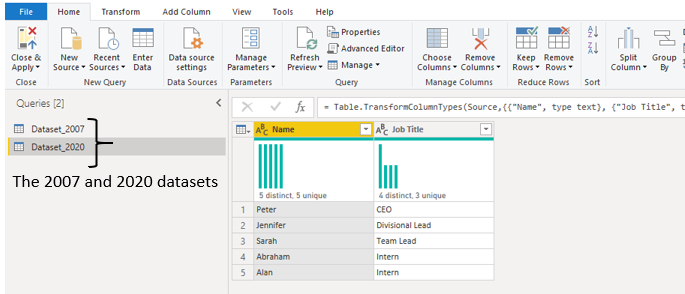
Let’s go to Merge queries and get started!
让我们去合并查询并开始吧!
Be very careful about the placement of the joins — the top data set is the left hand side of the join and the bottom data set is the right hand side of the join. If they are not arranged properly, you will get the opposite result.
请特别注意联接的位置-顶部数据集是联接的左侧,底部数据集是联接的右侧。 如果它们的排列不正确,您将得到相反的结果。
If you are confused — check out my first article about the left and the right.

One important thing — let’s select the column we want to join on or the “connection”.
一件重要的事情-让我们选择要加入的列或“连接”。

I chose the left outer join but it’s the same as a left join. There are many terminologies out there — left hand side, first data set, data set A etc. At the end of the day — we want to see the rows that are common and also rows that are not found when compared. Also, in this image, there is only one “connection” column. You are not limited to using just that. You can choose an additional column to support a join as well.
我选择了左外部连接,但它与左连接相同。 那里有很多术语-左侧,第一个数据集,数据集A等。最终,我们希望看到比较时常见的行和未找到的行 。 同样,在此图像中,只有一个“连接”列。 您不仅限于使用它。 您也可以选择其他列以支持联接。
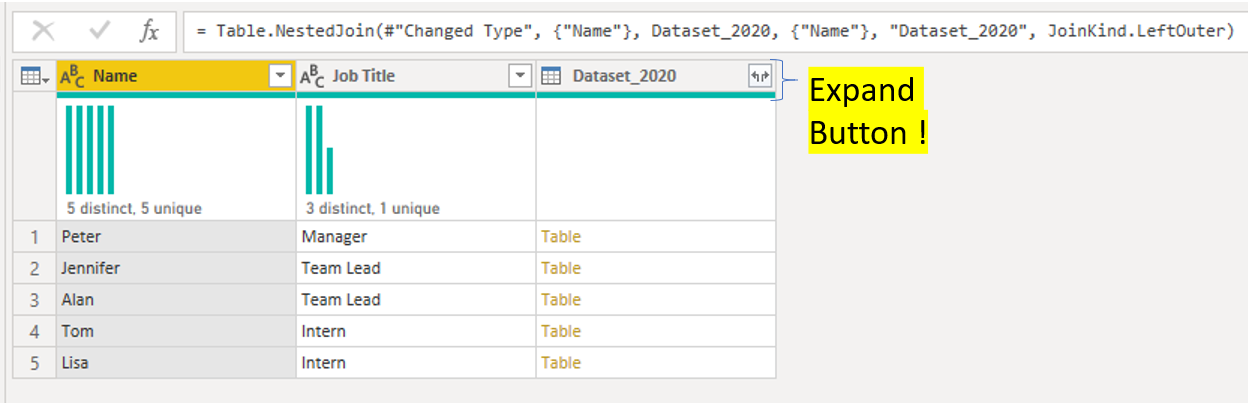
After I make this selection, I will be given the option to expand.
选择之后,将提供扩展选项。
Let’s hit the expand button.
让我们点击展开按钮。
Ta-Da!
塔达!

Here you can see the inner join and left anti results.
在这里,您可以看到内部联接和左反结果。
Let’s talk a little about the query settings pane on Power Query. This is very useful for our example. Why? because with one click — you can go back to your merge step and change any of the join selection you have as see previously.
让我们谈谈Power Query上的“查询设置”窗格。 这对于我们的示例非常有用。 为什么? 因为只需单击一下即可—您可以返回到合并步骤,并更改您所拥有的任何联接选择,如先前所示。

Brings you back here for other join selections.
带您回到这里进行其他联接选择。

I get it, it may seem over simplistic, the data sets here only have 5 rows and there aren’t any duplicates, data type errors, typos on the join, missing data, missing column..etc, I’ll write more about this in another article.
我明白了,它似乎过于简单化,这里的数据集只有5行,没有任何重复,数据类型错误,联接上的错字,丢失的数据,缺少的列..etc,我将写更多有关这在另一篇文章中。
Think about it this way, if you understand these basics and can build queries on a small data set, Power BI will do the heavy lifting. The same query with minor tweaks can be applied from a 5 rows data set to a 50K rows data set.
如果您了解这些基础知识并且可以在较小的数据集上建立查询,则以这种方式进行思考,Power BI将会承担繁重的工作。 可以对细微调整的同一查询从5行数据集应用于50K行数据集。
Hmm…let’s back to our stick figures.
嗯...回到我们的简笔画。
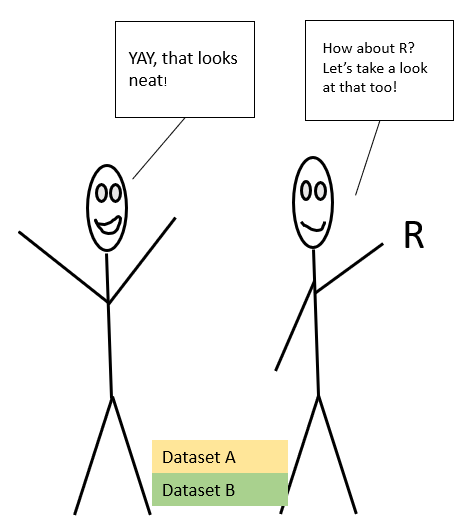
Now let’s take a look at R. Another great tool.
现在让我们看一下R。另一个很棒的工具。
Let’s load in our data and package using “Import data” and also load in the Tidyverse. Tidyverse is a collection of R packages that makes data wrangling fun and easy (sometimes).
让我们使用“导入数据”加载数据和包,并加载Tidyverse。 Tidyverse是R程序包的集合,使数据整理变得轻松有趣(有时)。
I’m going to answer the same questions I had from my first article using the below code. Just 2 main lines, but enough to answer it with some tweaks.
我将使用以下代码回答我在第一篇文章中遇到的相同问题。 仅有2条主线,但足以进行一些调整。
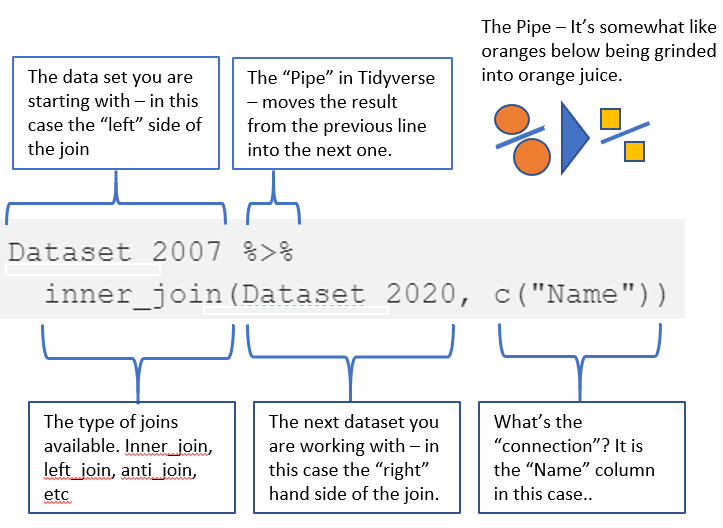
library(tidyverse) # loading Tidyverse package -- for dplyr#who is still with the company?Dataset_2007 %>%
  inner_join(Dataset_2020, c("Name"))#who is no longer working for the company in 2020?Dataset_2007 %>%
  anti_join(Dataset_2020, c("Name")) #who is new to the company in 2020?Dataset_2020 %>%  anti_join(Dataset_2019,c("Name"))
Let’s break this down.
让我们分解一下。
There you have it!
你有它!
Some join basics using Power BI and R. A few clicks with Power BI and a few lines of code using R. Both are fun for data wrangling.
有些使用Power BI和R结合了基础知识。使用Power BI进行了几次单击操作,使用R进行了几行代码。对于数据整理来说,两者都很有趣。
Hope you like this article! Stay safe!
希望你喜欢这篇文章! 注意安全!
翻译自: https://towardsdatascience.com/joins-with-power-bi-bde7de3e2181
帆软bi 观远bi


 1911
1911

 被折叠的 条评论
为什么被折叠?
被折叠的 条评论
为什么被折叠?
 到【灌水乐园】发言


