


 本文深入解析Tableau桌面认证,涵盖数据连接、数据整理、图表创建、计算应用等关键技能,分享备考策略与考试经验,助你顺利通过认证。
Woah, Tableau!
哇,Tableau!
By now, almost everyone’s heard of the data visualization software that brought visual analytics to the public. Its intuitive drag and drop interface makes connecting to data, creating graphs, and sharing dashboards easier than ever before.
到目前为止,几乎所有人都听说过将可视化分析引入公众的数据可视化软件。 其直观的拖放界面使连接数据,创建图形和共享仪表板变得前所未有的轻松。
But why should exactly you care about it?
但是,为什么您应该真正关心它呢?
According to Tableau’s website, in 2017 there were over 300,000 people using Tableau Public (the free version of Tableau available for everyone) to create visualizations and share data online.
根据Tableau网站的数据,2017年有超过30万人使用Tableau Public(适用于所有人的Tableau免费版本)创建可视化效果并在线共享数据。
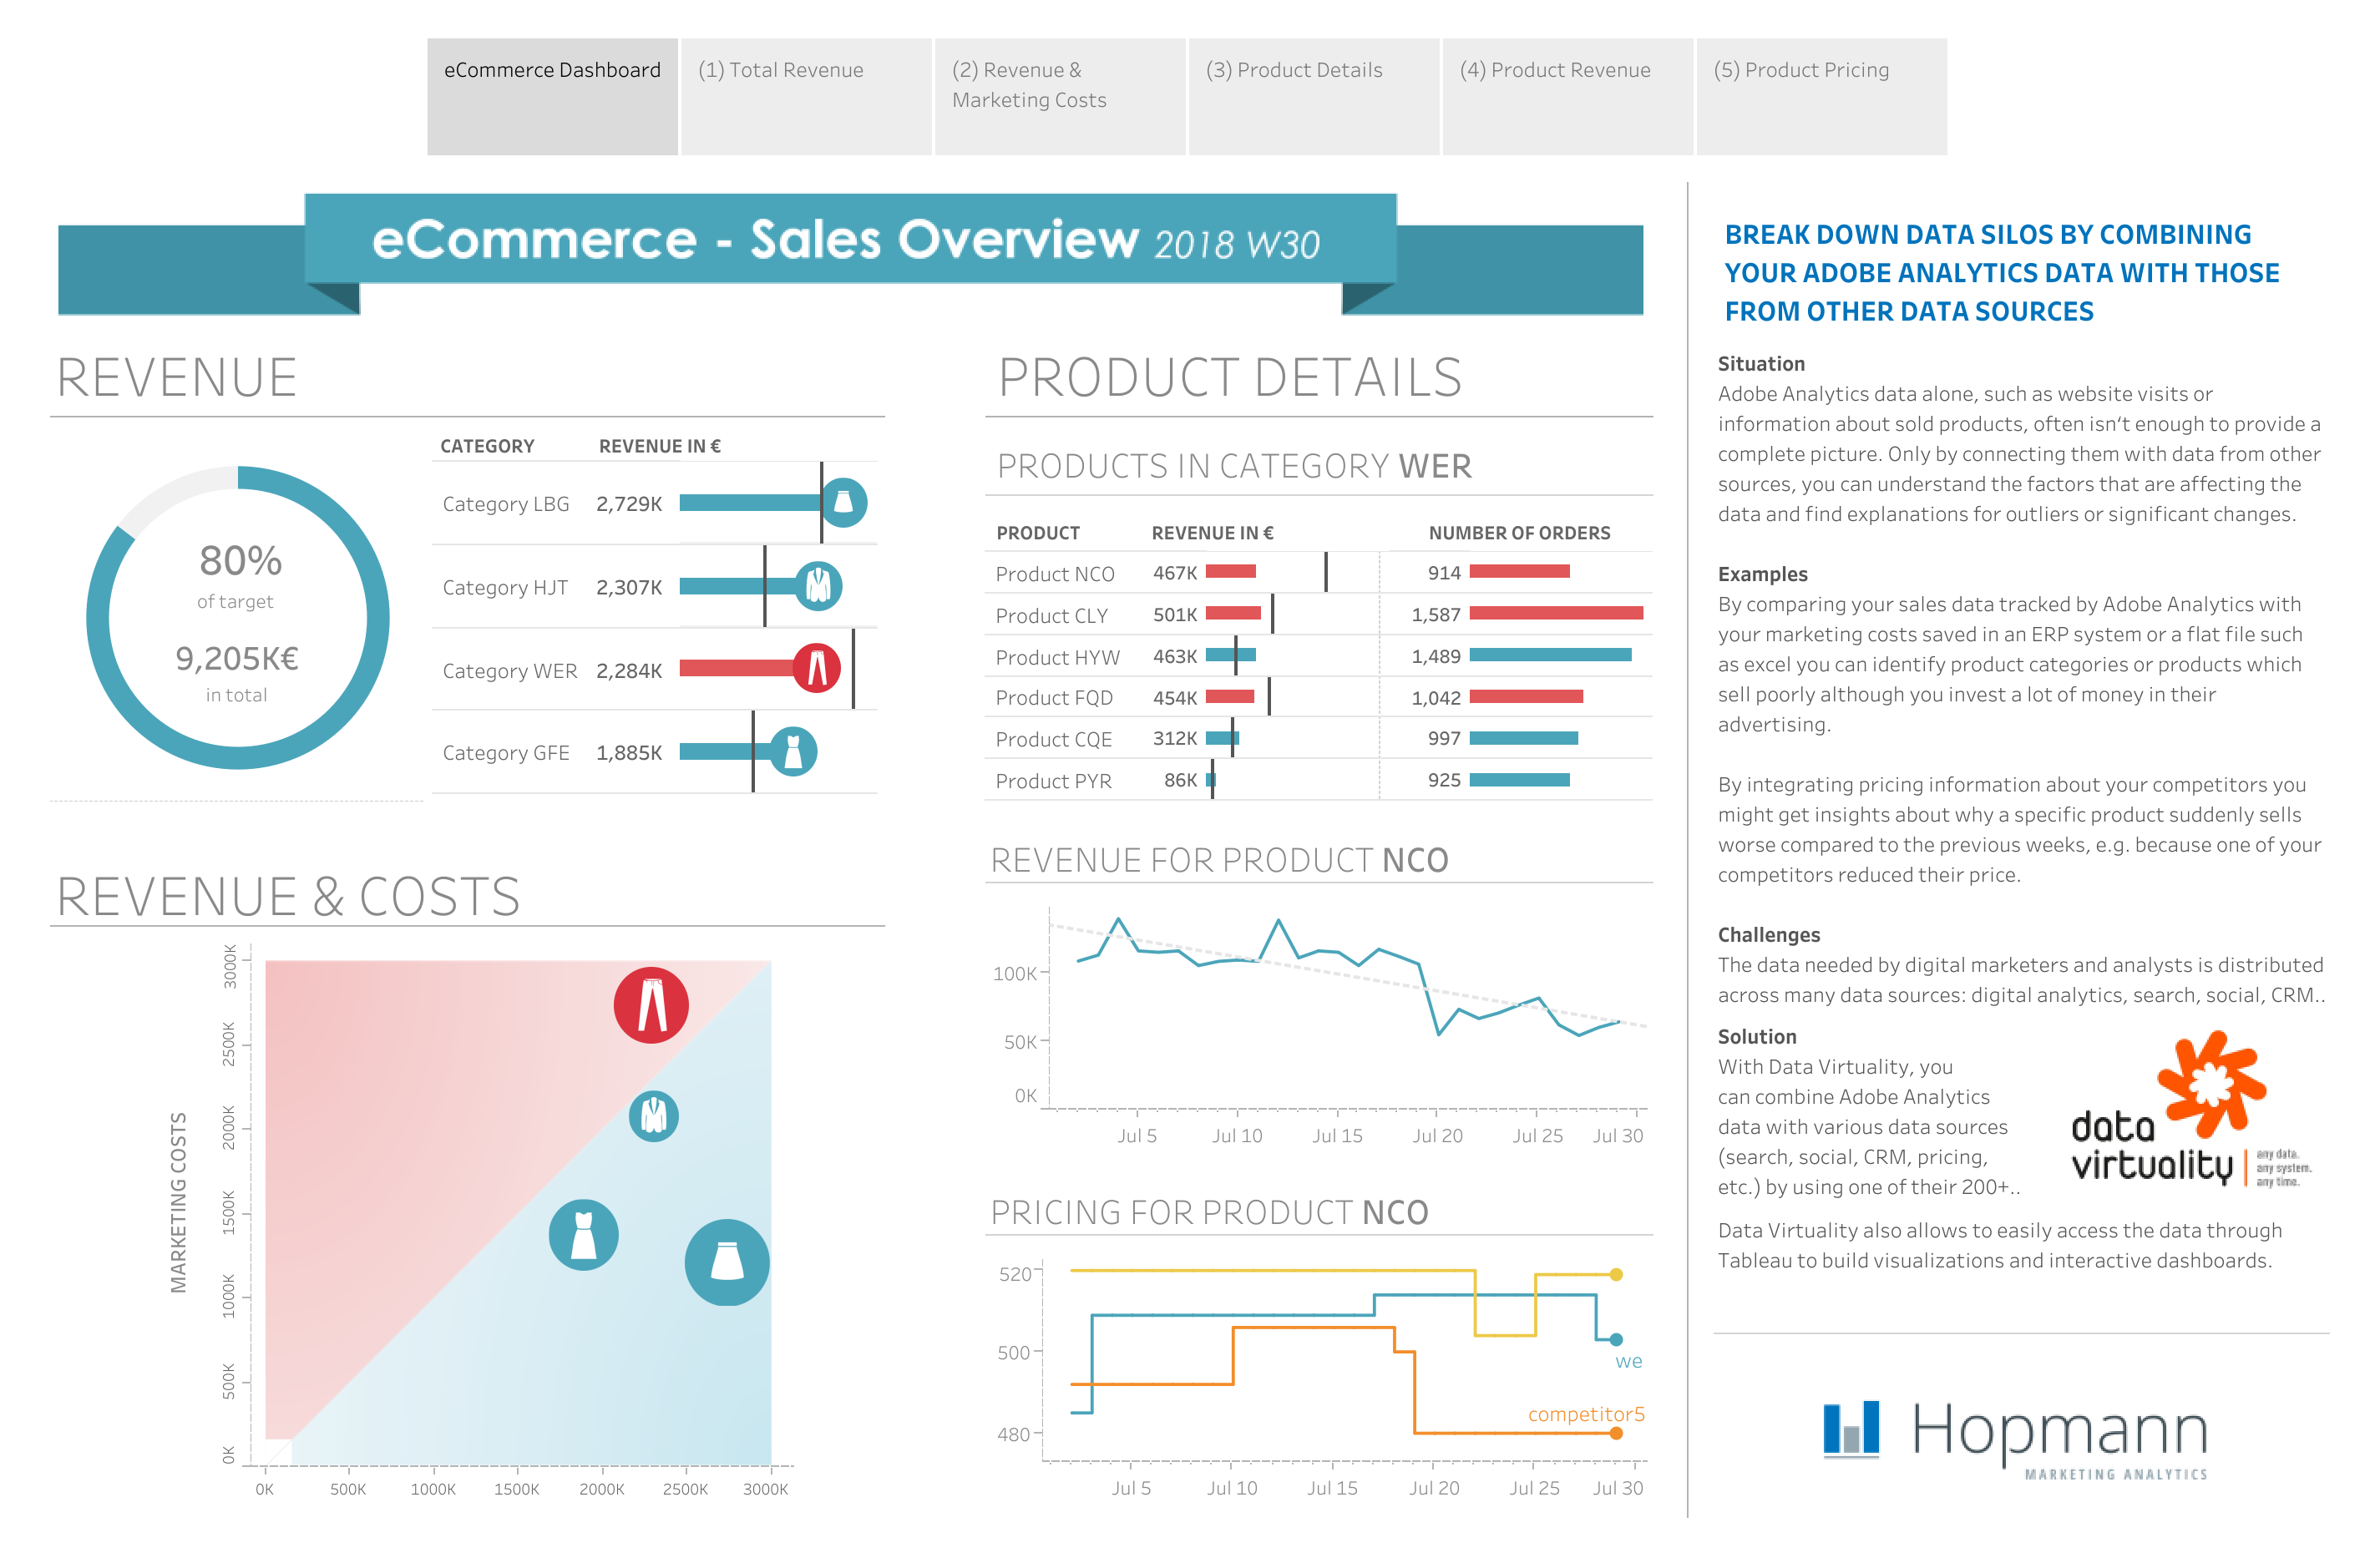
You can create use Tableau to create “standard” business visualizations, like the sample eCommerce dashboard below.
您可以创建使用Tableau来创建“标准”业务可视化效果,例如下面的示例电子商务面板。
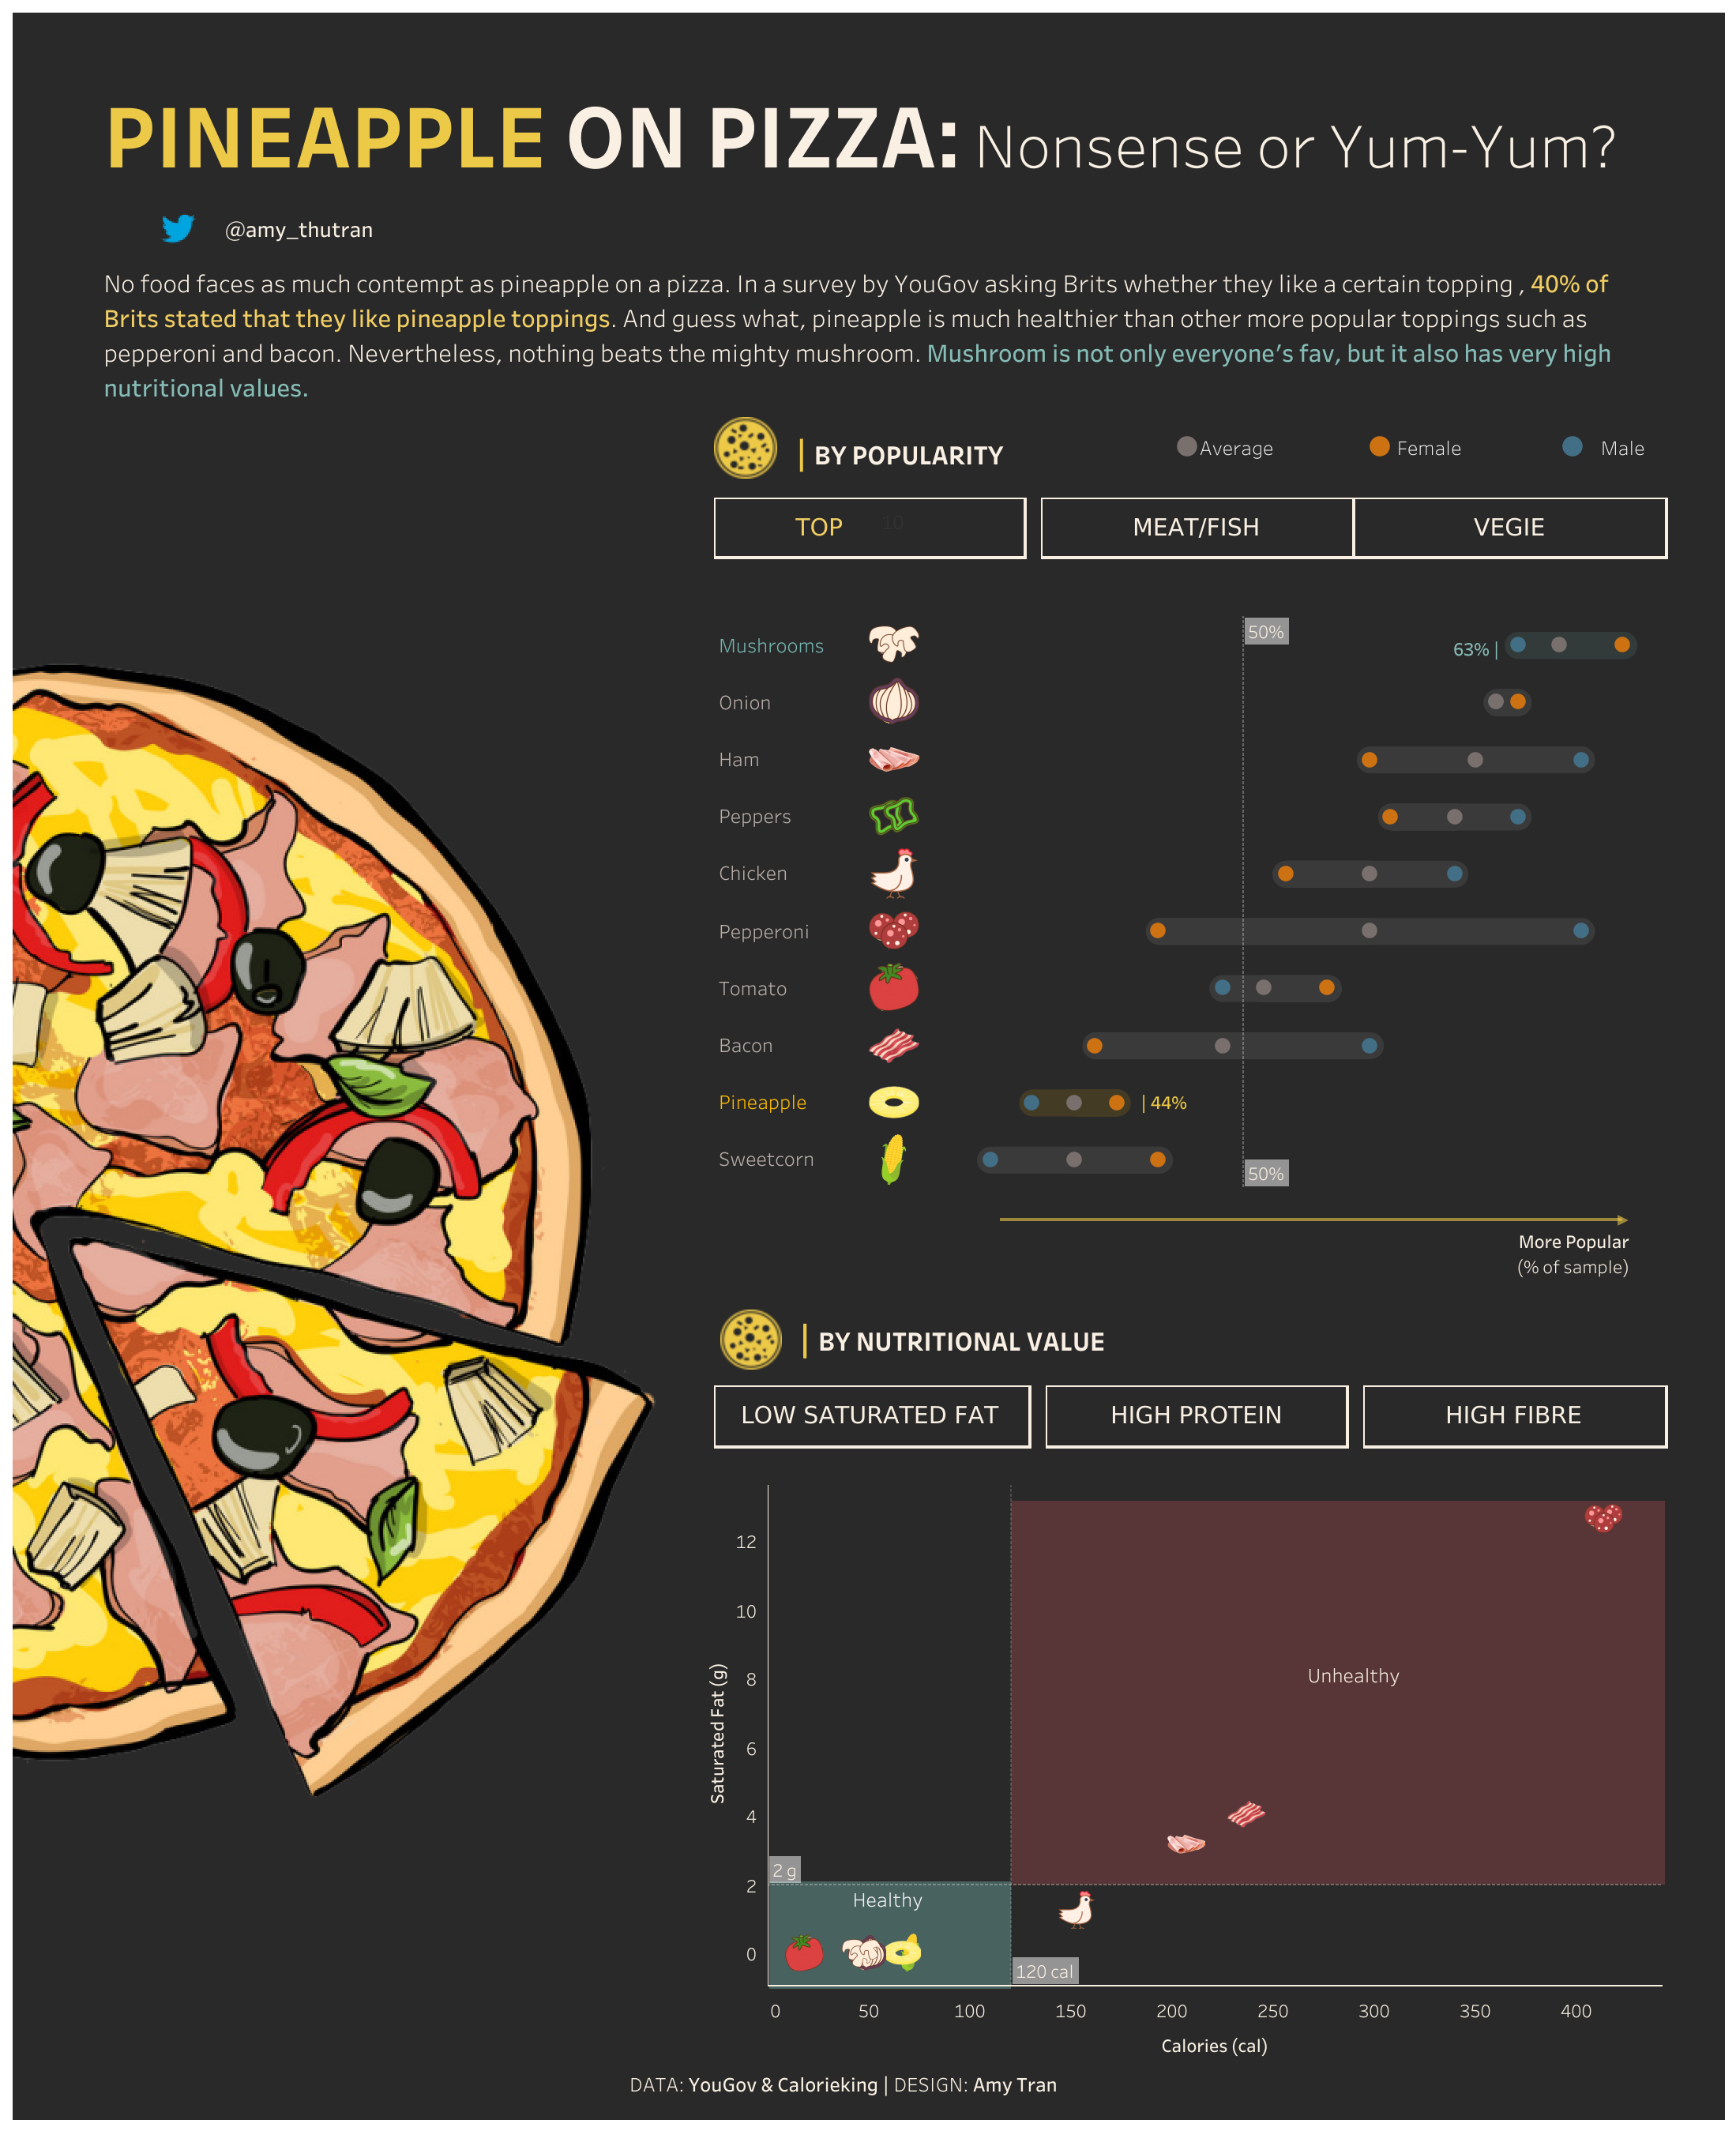
You can also bring out your creativity in full force and use Tableau to tell a story. Tableau allows you to bring contextual explanations, easy-to-understand graphs, and visual flair together in one view. One Tableau Public user used it to answer the age-old “Does pineapple belong on pizza?” question, which you can see below.
您还可以充分发挥创造力,并使用Tableau讲故事。 通过Tableau,您可以在一个视图中将上下文说明,易于理解的图形和视觉风格结合在一起。 一位Tableau Public用户用它回答了古老的“菠萝是否属于比萨饼?” 问题,您可以在下面看到。
In addition to individuals creating visualization on Tableau Public, companies like Chipotle, JPMorgan Chase, and Lufthansa are just a few of the organizations that use Tableau to facilitate data-driven decision making. Tableau helps companies bring data to the hands of all its staff, allowing teams from operations management to finance to track and analyze data. Your company might actually be using Tableau without you knowing it!
除了在Tableau Public上创建可视化的个人之外, Chipotle , JPMorgan Chase和Lufthansa等公司只是使用Tableau促进数据驱动的决策制定的少数组织。 Tableau帮助公司将数据移交给所有员工,从而使从运营管理到财务的团队能够跟踪和分析数据。 您的公司可能实际上在不知不觉中正在使用Tableau!
Tableau认证快速概述(以及为什么要获得认证) (A Quick Overview of Tableau’s Certifications (and Why You Should Get One))
Tableau offers two main branches of certification: Desktop and Server. The Server certifications are more applicable for System Administrator related roles, where your focus is on installing, deploying, and maintaining Tableau Server. The Desktop certification route, which is the focus of this piece, is what people working as analysts will find useful.
Tableau提供了两个主要的认证分支:台式机和服务器。 服务器认证更适用于与系统管理员相关的角色,您的重点是安装,部署和维护Tableau Server。 台式机认证途径是本文的重点,这是分析师所使用的方法。
There are three Desktop certifications:
共有三种桌面认证:
Tableau Desktop Specialist (suggested 3+ months experience)
Tableau Desktop Specialist (建议3个月以上的经验)
Tableau Desktop Certified Associate (suggested 5+ months experience)
Tableau Desktop Certified Associate (建议5个月以上的经验)
Tableau Desktop Certified Professional (suggested 12+ months experience)
Tableau Desktop Certified Professional (建议12个月以上经验)
I would suggest starting with the Desktop Certified Associate. The Specialist certification measures foundational skills, like creating basic charts and formatting them. While this knowledge is important to have, Tableau is intuitive enough so that you can learn most of the material in the Specialist exam simply by using Tableau.
我建议从桌面认证助理开始。 专家认证衡量基本技能,例如创建基本图表并设置其格式。 尽管掌握这些知识很重要,但Tableau足够直观,因此您只需使用Tableau即可学习专家考试中的大部分材料。
Furthermore, the Certified Associate exam doesn’t require you to have the Specialist certification as a prerequisite, which means you can skip paying the $100 fee for the Specialist certification and jump straight to the Certified Associate. Each attempt on the Certified Associate exam costs $250, so make sure to prepare thoroughly before you try it out.
此外,认证助理考试不要求您具备专家认证的先决条件,这意味着您可以跳过支付专家认证所需的100美元费用,而直接跳到认证助理。 每次参加认证助理考试的费用为250美元 ,因此请务必充分准备后再尝试。
Based on Tableau’s Certification Directory, as of August 2020, there are 4,101 people with active Desktop Certified Associate certifications. This number may be even higher, as some people might have opted out of being shown on the list. Acquiring this certificate is one way to demonstrate that you know more than just the basics of Tableau.
根据Tableau的认证目录,截至2020年8月,有4,101人拥有有效的桌面认证助理认证。 这个数字可能更高,因为某些人可能选择不显示在列表中。 获得此证书是一种证明您不仅了解Tableau基础知识的方法。
When you’re up against a hundred other people for a job that needs data skills, the certificate may be enough to at least get you an interview.
当您与需要数百名数据技能的其他人抗衡时,证书可能足以至少让您获得面试机会。
If we take a quick peek at Google Trends, “tableau jobs” and “tableau certification” are search terms that have continued to increase over the last decade.
如果我们快速浏览一下Google趋势,那么“表格工作”和“表格认证”是在过去十年中持续增长的搜索词。

Jobs in every business function work with data in some form, and Tableau can help turn that data into actionable business intelligence. That and the growing popularity of “business analyst” and “data analyst” type jobs may be the reason for the popularity of Tableau and Tableau certification-related search trends. So if you’re looking to distinguish yourself among the crowd of applicants for every opening, learning Tableau may be one way to do so.
每个业务职能部门中的工作都以某种形式处理数据,Tableau可以帮助将数据转变为可操作的商业智能。 那和“业务分析师”和“数据分析师”类型的工作越来越受欢迎,可能是Tableau和Tableau认证相关搜索趋势之所以受欢迎的原因。 因此,如果您希望在每次开放的求职者中都能够与众不同,那么学习Tableau可能是做到这一点的一种方法。
Because I recently passed my Tableau Desktop Certified Associate exam, I wanted to take the time to explain how I prepared and what the exam experience was like. If you’re also interested in taking the exam, I hope by the end of this piece I was able to help!
因为我最近通过了Tableau Desktop Certified Associate考试,所以我想花点时间解释我的准备情况以及考试的感受。 如果您也对参加考试感兴趣,希望到本文结束时我能对您有所帮助!
The exam is graded as a pass or fail, with 75% needed for a passing mark. For full disclosure, here’s proof of my certification:
考试的等级为及格或不及格,合格分数为75%。 要进行全面披露,以下是我的认证证明:

As you can see, I didn’t pass with flying colors. I just passed with regular colors. I was a bit shocked to see that I only got 55% of the “Calculations” questions correct, but I couldn’t see which questions I got wrong because Tableau doesn’t provide per-question feedback on your exam. On the bright side, this high-level feedback does help, as after the exam you know which areas to review and focus on for your next attempt (if you need to re-take the exam) or for the Certified Professional exam.
如您所见,我并没有表现出色。 我只是通过常规颜色。 看到我只正确回答了55%的“计算”问题,我感到有些震惊,但是我看不到我错了哪些问题,因为Tableau不会为您的考试提供每个问题的反馈。 从好的方面来说,这种高水平的反馈确实会有所帮助,因为在考试之后,您知道要为下一次尝试(如果您需要重新参加考试)或认证专业人士考试而要重点关注的领域。
测试技能部分摘要和细目分类 (Tested Skill Sections Summary and Breakdown)
If you’ve skimmed the introduction and arrived here, this is where it gets real.
如果您浏览了介绍并到达此处,这就是真实的地方。
The official Desktop Certified Associate exam guide (link at the end of this piece) tells you exactly which skills the exam will measure, and the weight of each section on the exam. The exam includes 36 questions, so we can approximate the number of questions for each section below:
官方的桌面认证助理考试指南(本文末尾的链接)会告诉您确切的考试内容,以及考试各部分的重要性。 该考试包括36个问题,因此我们可以大致估算以下每个部分的问题数量:
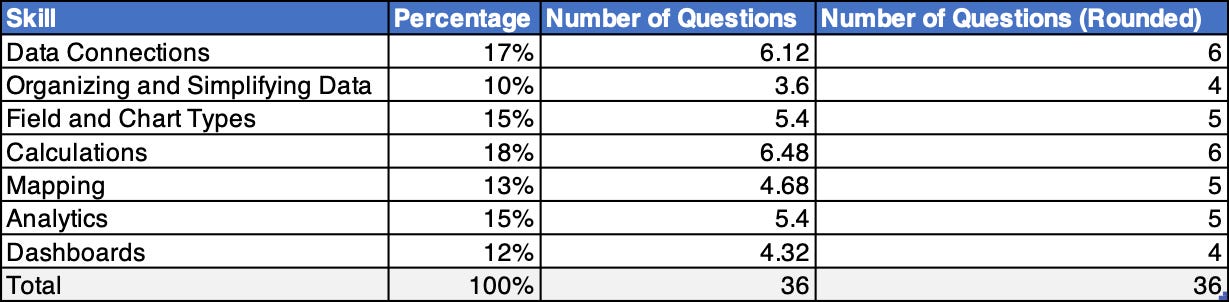
The number of questions per section is just a guideline. The actual percentage allocation on the exam may be slightly different than what’s shown on the table above. One question can mean the difference between a pass and a fail, so don’t skip over any sections just because you think it’s easy at first glance.
每节的问题数量仅是一个准则。 考试的实际百分比分配可能与上表所示的有所不同。 一个问题可能意味着通过和失败之间的区别,因此不要仅仅因为您乍一看就容易就跳过任何部分。
All questions are multiple-choice, where you either have to select one correct option, multiple (if applicable) correct options, or True/False. However, there is another distinction between “hands-on” and “theory” questions that you should be prepared for.
所有问题都是选择题 ,您必须选择一个正确的选项,多个(如果适用)正确的选项或对/错。 但是,您应该准备的“动手”和“理论”问题之间还有另一个区别。
With hands-on questions, you’ll be given a question to answer based on a provided data source. All data sources are files provided in a folder on the virtual machine (more on this later), so you most likely won’t have to connect to any cloud databases or web data. A simple hands-on question structure might be like this: “Based on the WoahMarket Global Sales data set, what is the sum of sales for Europe in 2019?” To answer this question, you will have to locate the “WoahMarket Global Sales” file, determine if it is Excel or CSV, connect to and open the table in Tableau, and then manipulate the data to get the answer.
使用动手问题 ,将根据提供的数据源为您提供一个要回答的问题。 所有数据源都是在虚拟机上的文件夹中提供的文件(稍后会详细介绍),因此您很可能不必连接到任何云数据库或Web数据。 一个简单的动手问题结构可能是这样的:“基于WoahMarket全球销售数据集,2019年欧洲的销售总额是多少?” 要回答此问题,您将必须找到“ WoahMarket全球销售”文件,确定它是Excel还是CSV,连接并打开Tableau中的表,然后操纵数据以获取答案。
For the theory questions, you won’t technically need to connect to any data sources to answer. These questions test your understanding of Tableau functionality in each of the different skill sections. For example, a sample theory question would be: “How do dashboard set actions affect the view?”, after which you’re given several options to choose from.
对于理论问题 ,从技术上讲 ,您无需连接任何数据源即可回答。 这些问题将测试您在每个不同技能部分中对Tableau功能的理解。 例如,一个示例理论问题将是:“仪表板设置动作如何影响视图?”,然后为您提供几个选项供您选择。
Now, let’s quickly go over each skill and discuss each area you should review before the exam.
现在,让我们快速检查每种技能,并讨论考试前应检查的每个领域。
数据连接(17%) (Data Connections (17%))
No data analysis or visualization can start without first connecting to the data. That’s probably why the exam features this section heavily, with 17% of the multiple-choice questions potentially featuring data connections. You’ll need to know a lot more than how to connect Tableau to an Excel file.
如果不先连接数据,就无法开始数据分析或可视化。 这可能就是考试在本部分中重点突出的原因,其中有17%的多项选择题可能具有数据连接性。 您不仅需要了解如何将Tableau连接到Excel文件,还需要了解更多信息。
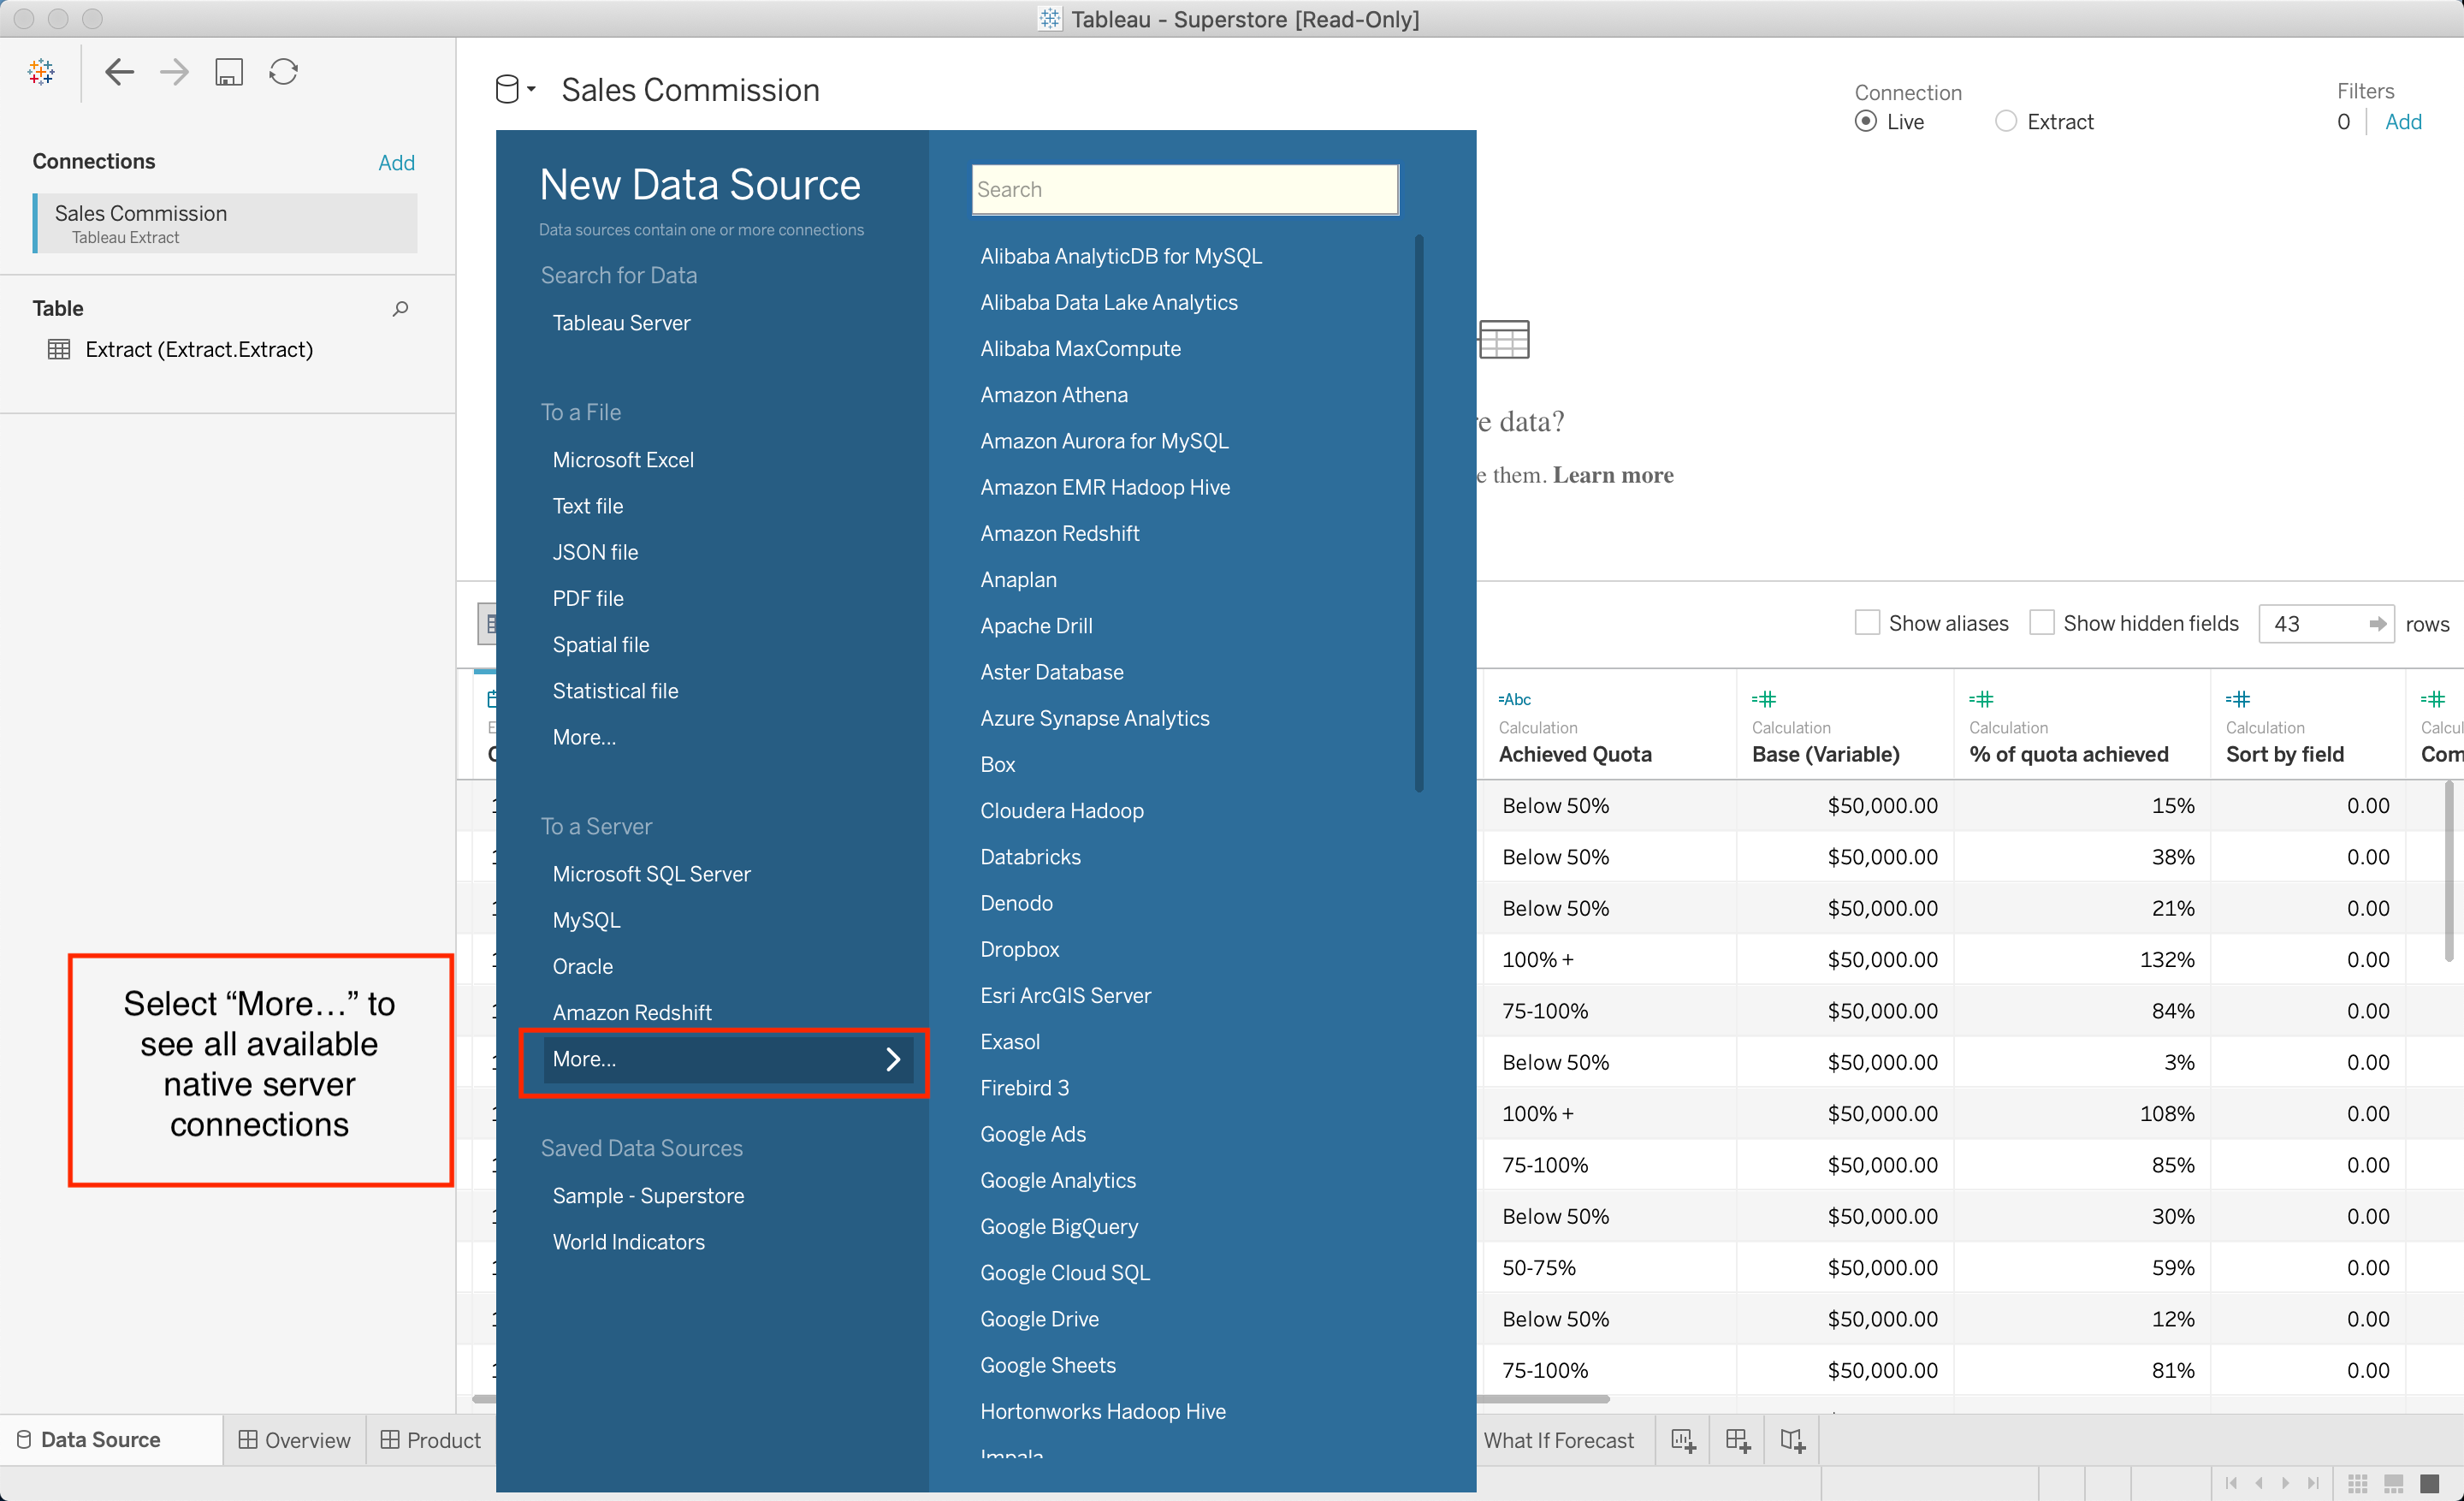
You should know that Tableau can connect to various databases, including Microsoft SQL Server and MySQL. Tableau also has built-in connections to several Amazon services, including Athena and Redshift. You won’t necessarily be asked to connect to these, but they may show up as options in a multiple-choice theory question.
您应该知道Tableau可以连接到各种数据库,包括Microsoft SQL Server和MySQL。 Tableau还具有与多个Amazon服务(包括Athena和Redshift)的内置连接。 您不一定会被要求连接这些,但是它们可能会在多项选择理论问题中作为选项出现。
There are also many different ways to combine tables in preparation for visualizing. You’ll need to know how to differentiate joins, blends, and unions, as well as the scenarios in which you’d use each join.
还有许多不同的方法可以组合表格以进行可视化。 您将需要知道如何区分join , blends和unions ,以及将使用每个联接的方案。
Another important feature that you may need to use in the exam is the “Data Interpreter”, which is a built-in Tableau feature that can help clean data before loading. If you’re given a file with lots of empty cells, titles, and other strange formattings, simply tick the “Use Data Interpreter” box and Tableau will attempt to detect tables from the file.
考试中可能需要使用的另一个重要功能是“ 数据解释器 ”,它是Tableau的内置功能,可以帮助在加载之前清理数据。 如果为您提供了一个包含大量空单元格,标题和其他奇怪格式的文件,则只需选中“使用数据解释器”框,Tableau就会尝试从该文件中检测表。
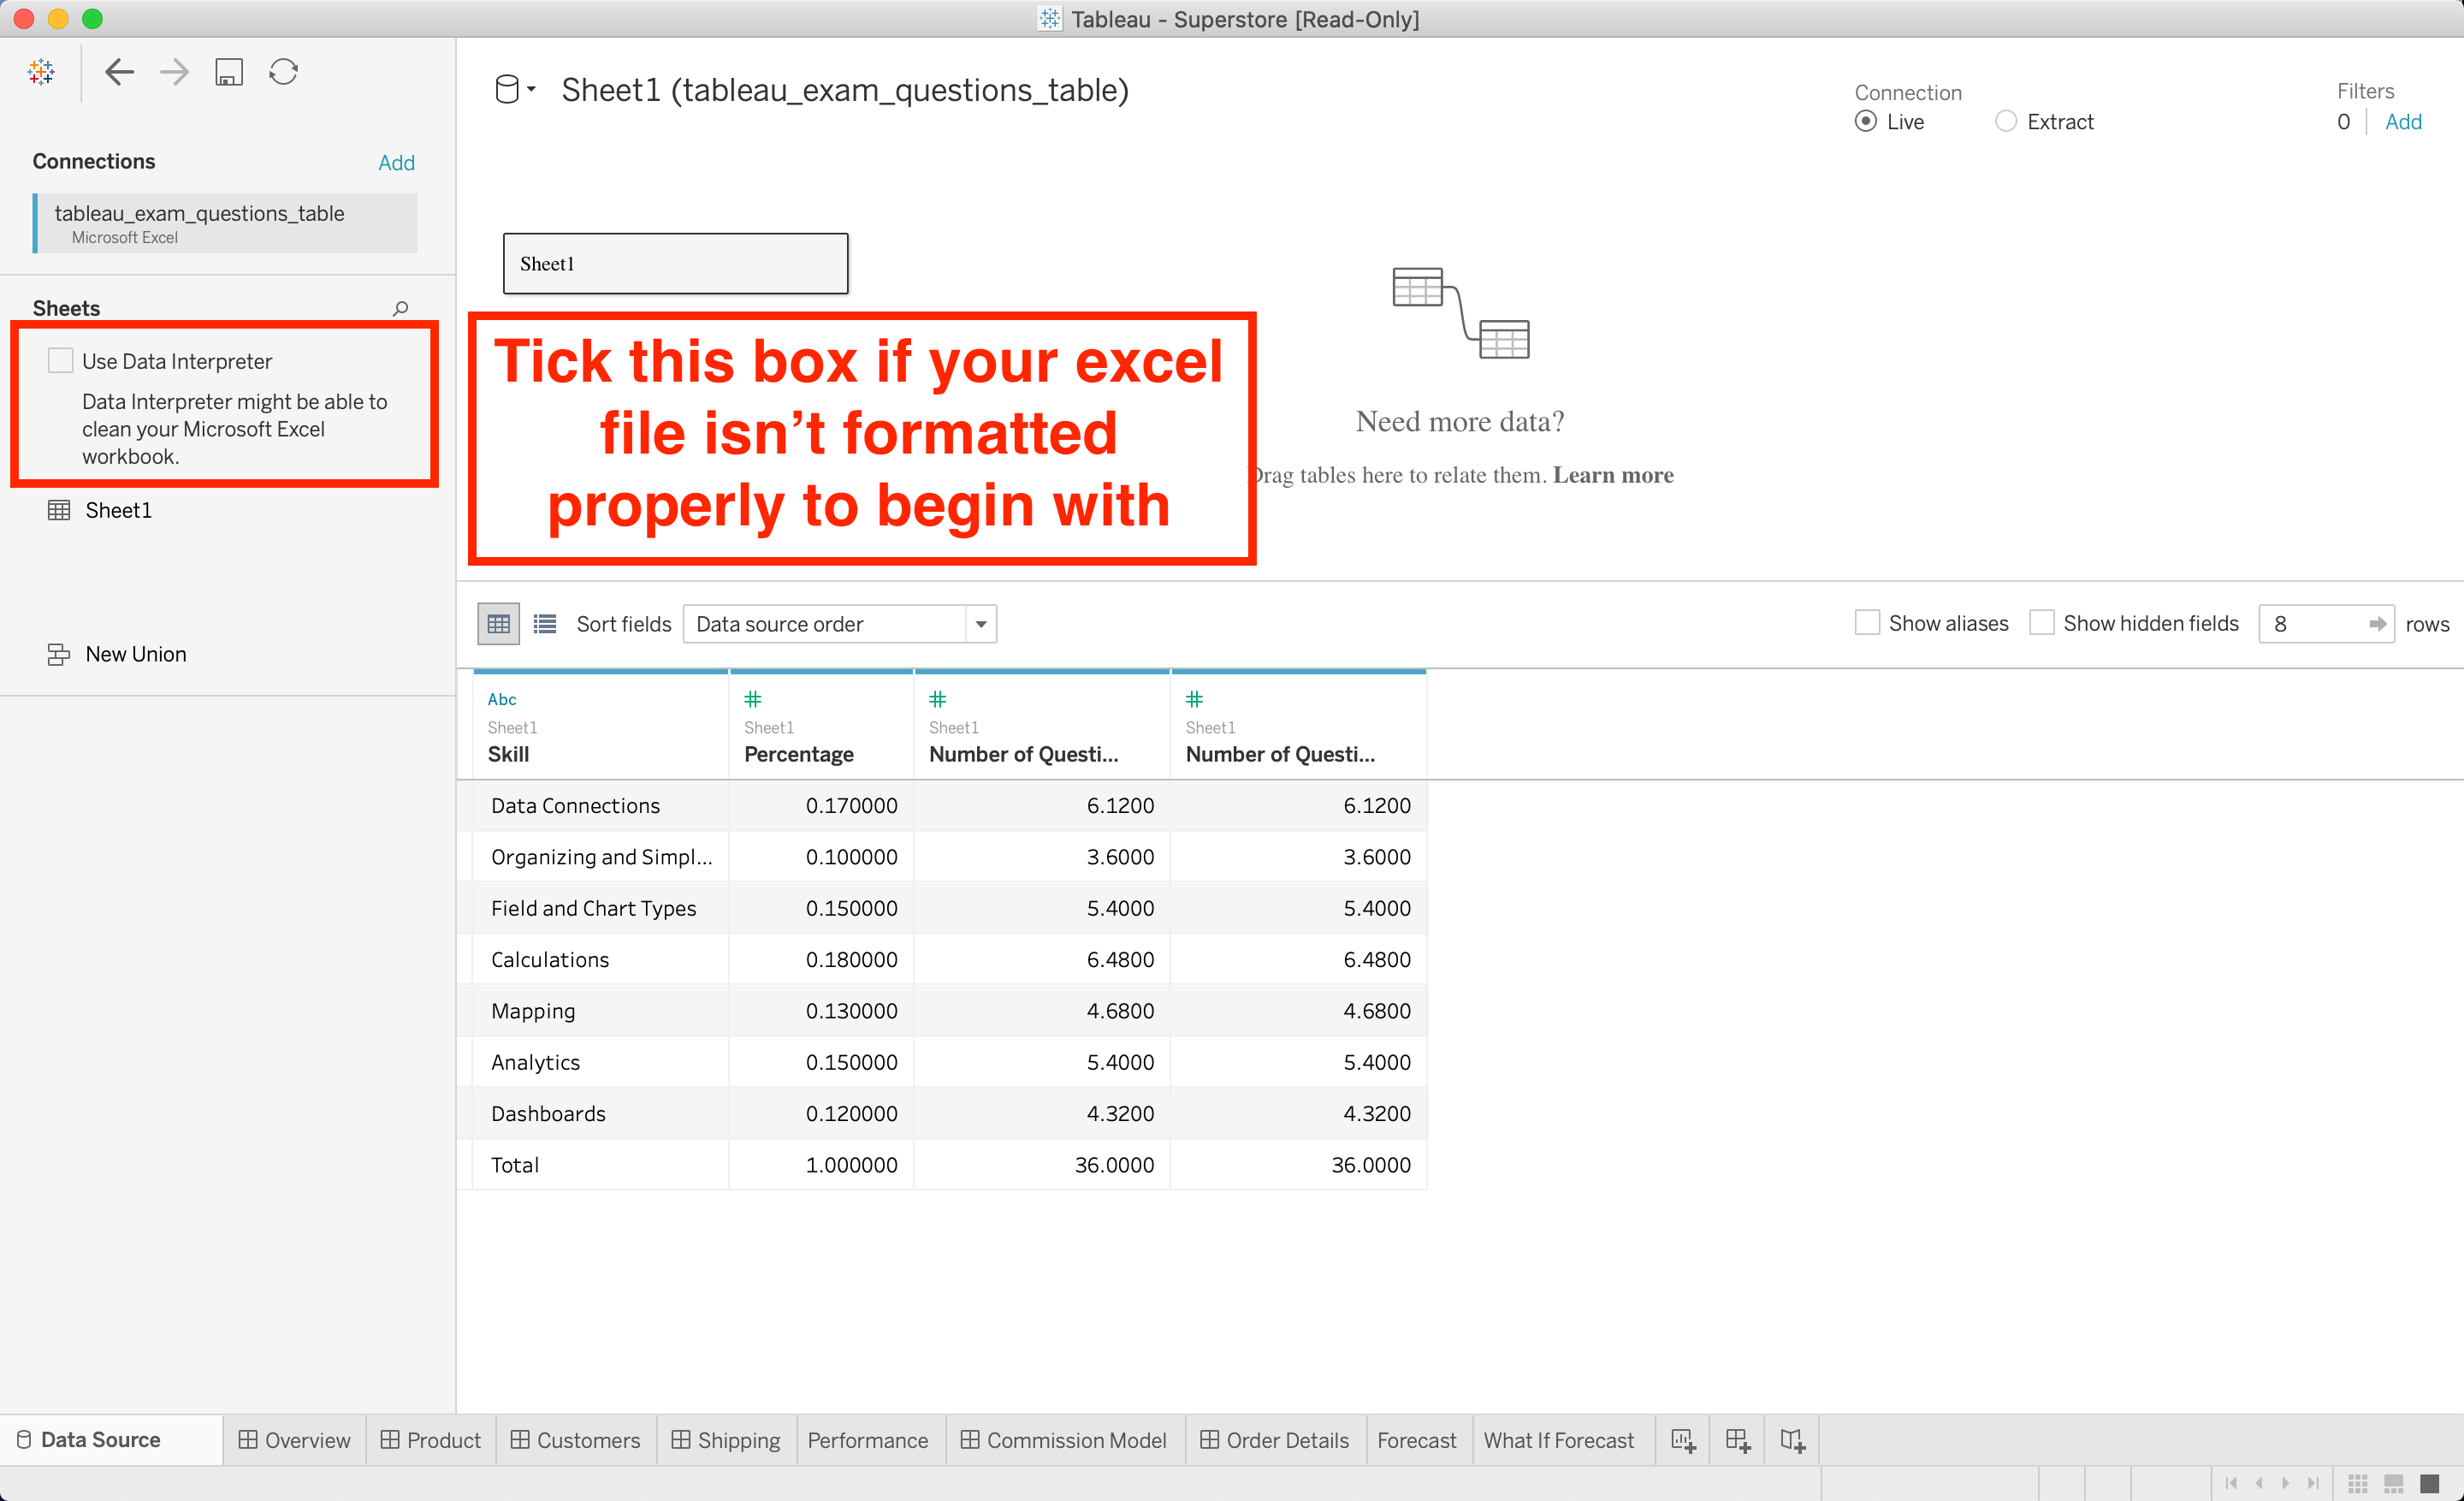
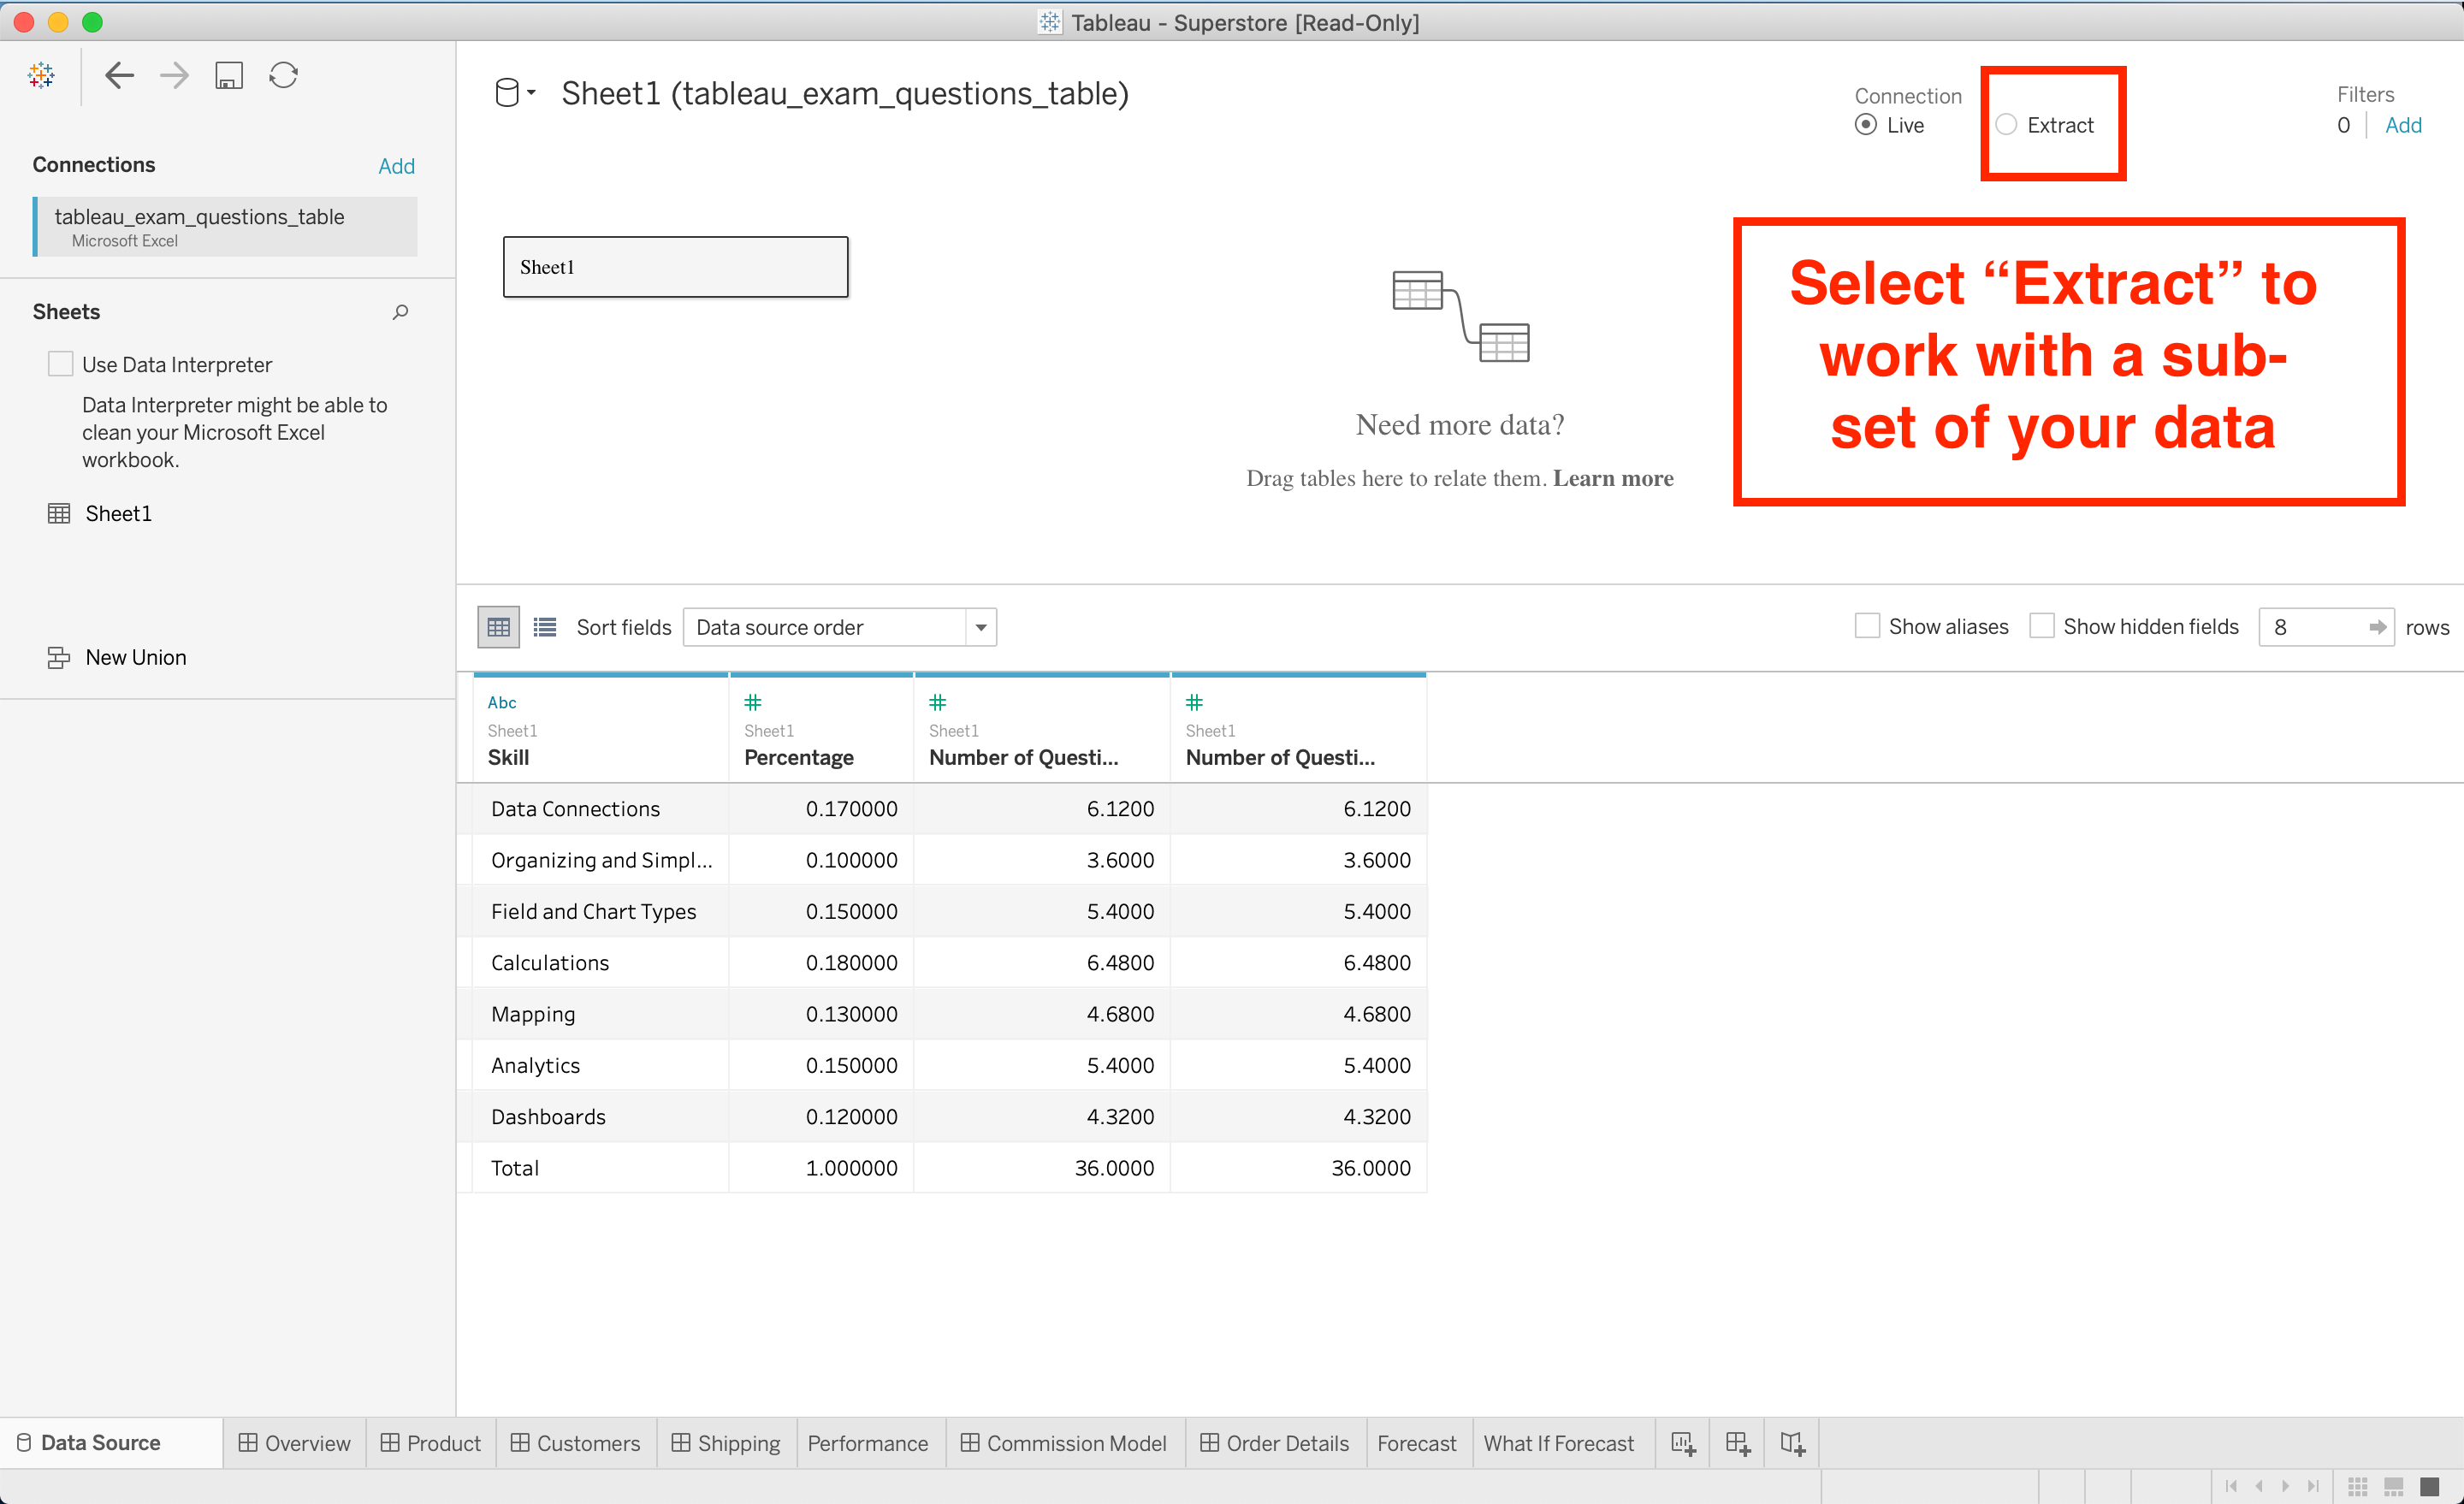
Tableau also allows you to create “extracts”, or saved subsets of data that decrease the size of data you analyze and can potentially improve how quickly your workbook responds. Extracts were updated in version 10.5, and you may get some theory questions regarding the difference between the old extract formats functionality and the new.
通过Tableau,您还可以创建“ 提取 ”或已保存的数据子集,以减少您分析的数据的大小,并有可能提高工作簿响应的速度。 摘录已在版本10.5中进行了更新,您可能会遇到一些有关旧的摘录格式功能与新的摘录格式功能之间差异的理论问题。
组织和简化数据(10%) (Organizing and Simplifying Data (10%))
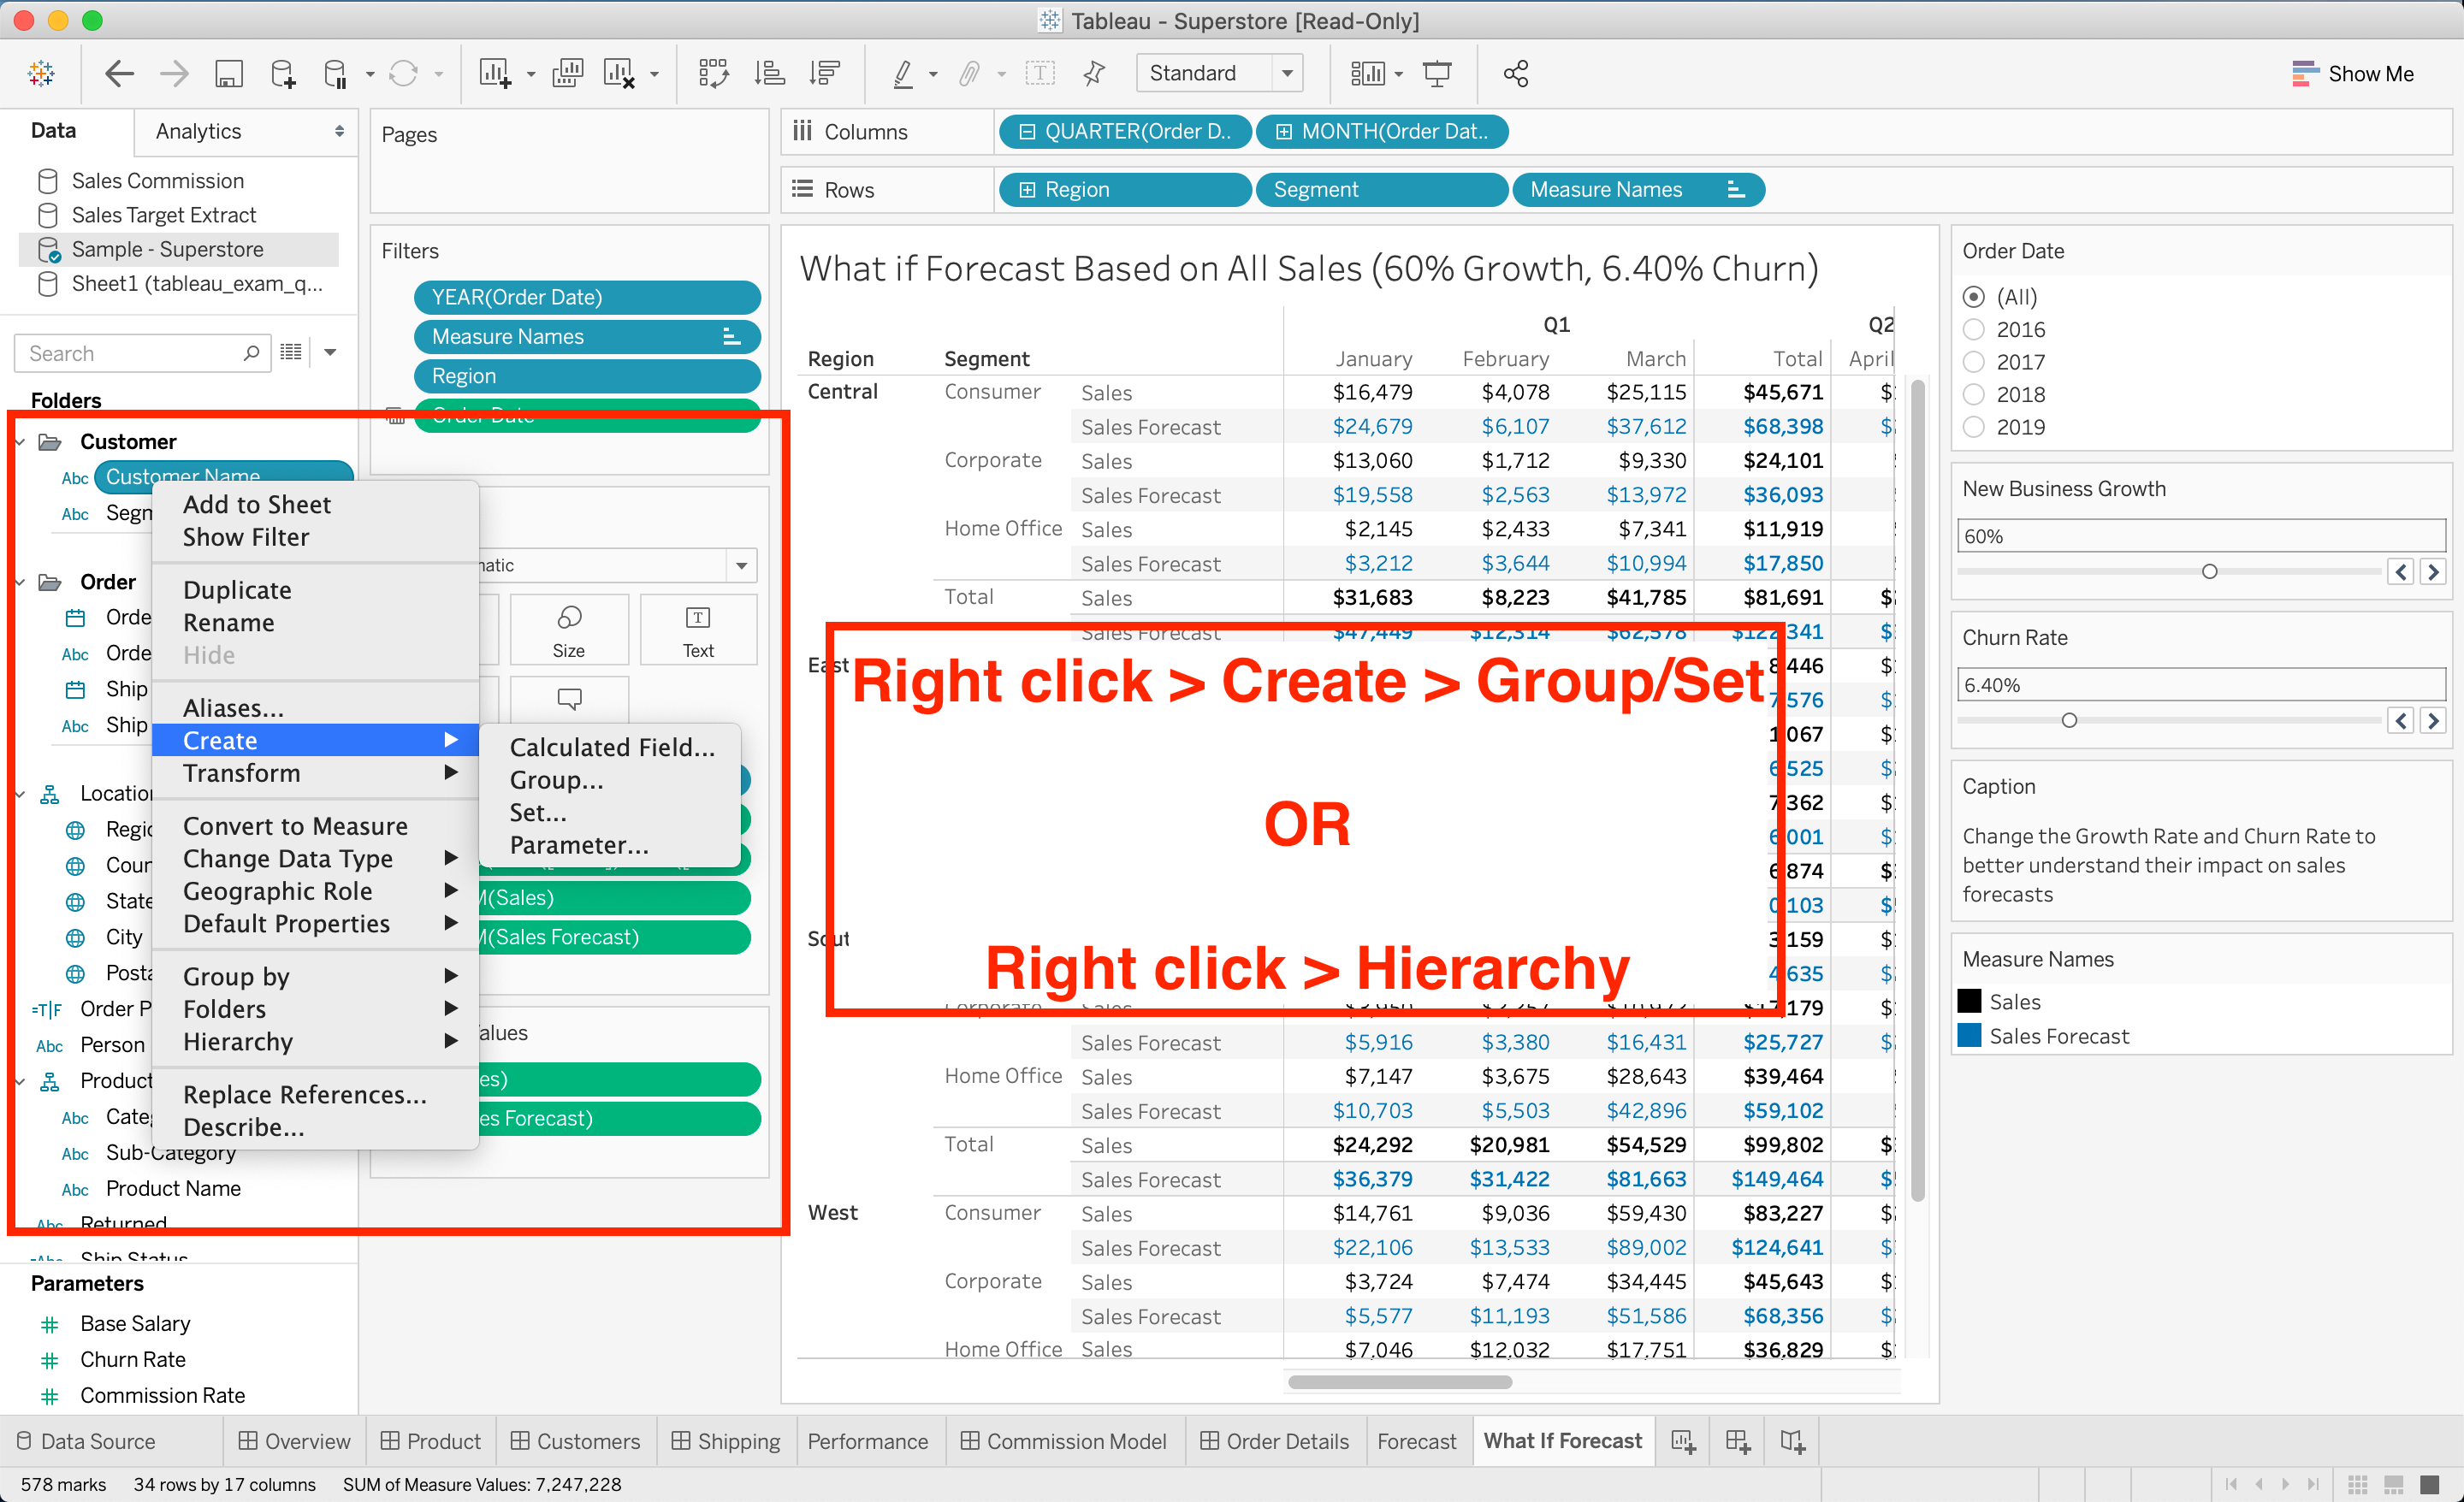
This section is relatively simple, which may be why Tableau weighted it less than the others. To filter data, you’ll typically drag a dimension over to the filter pane and customize it as necessary. To build groups, hierarchies, and sets, all you need to do is right-click on the relevant dimension and select what you want to create.
此部分相对简单,这可能就是为什么Tableau对其进行加权的原因。 要过滤数据,通常会将维度拖到过滤器窗格上,并根据需要对其进行自定义。 要构建group , hierarchies和set ,您需要做的就是右键单击相关维度并选择要创建的内容。
While performing these tasks are easy, you still need to understand why and when to perform each of them.
尽管执行这些任务很容易,但是您仍然需要了解为什么以及何时执行它们中的每一个。
For the hands-on questions, it doesn’t matter how you choose to get the right answer, as long as you get the right answer.
对于动手操作问题,只要选择正确的答案,选择如何获得正确的答案都没关系。
If you come across questions that make it seem like you need a calculated field, it may first be worth trying a technique from this section.
如果遇到使您似乎需要计算字段的问题,那么首先值得尝试本节中的一种技术。
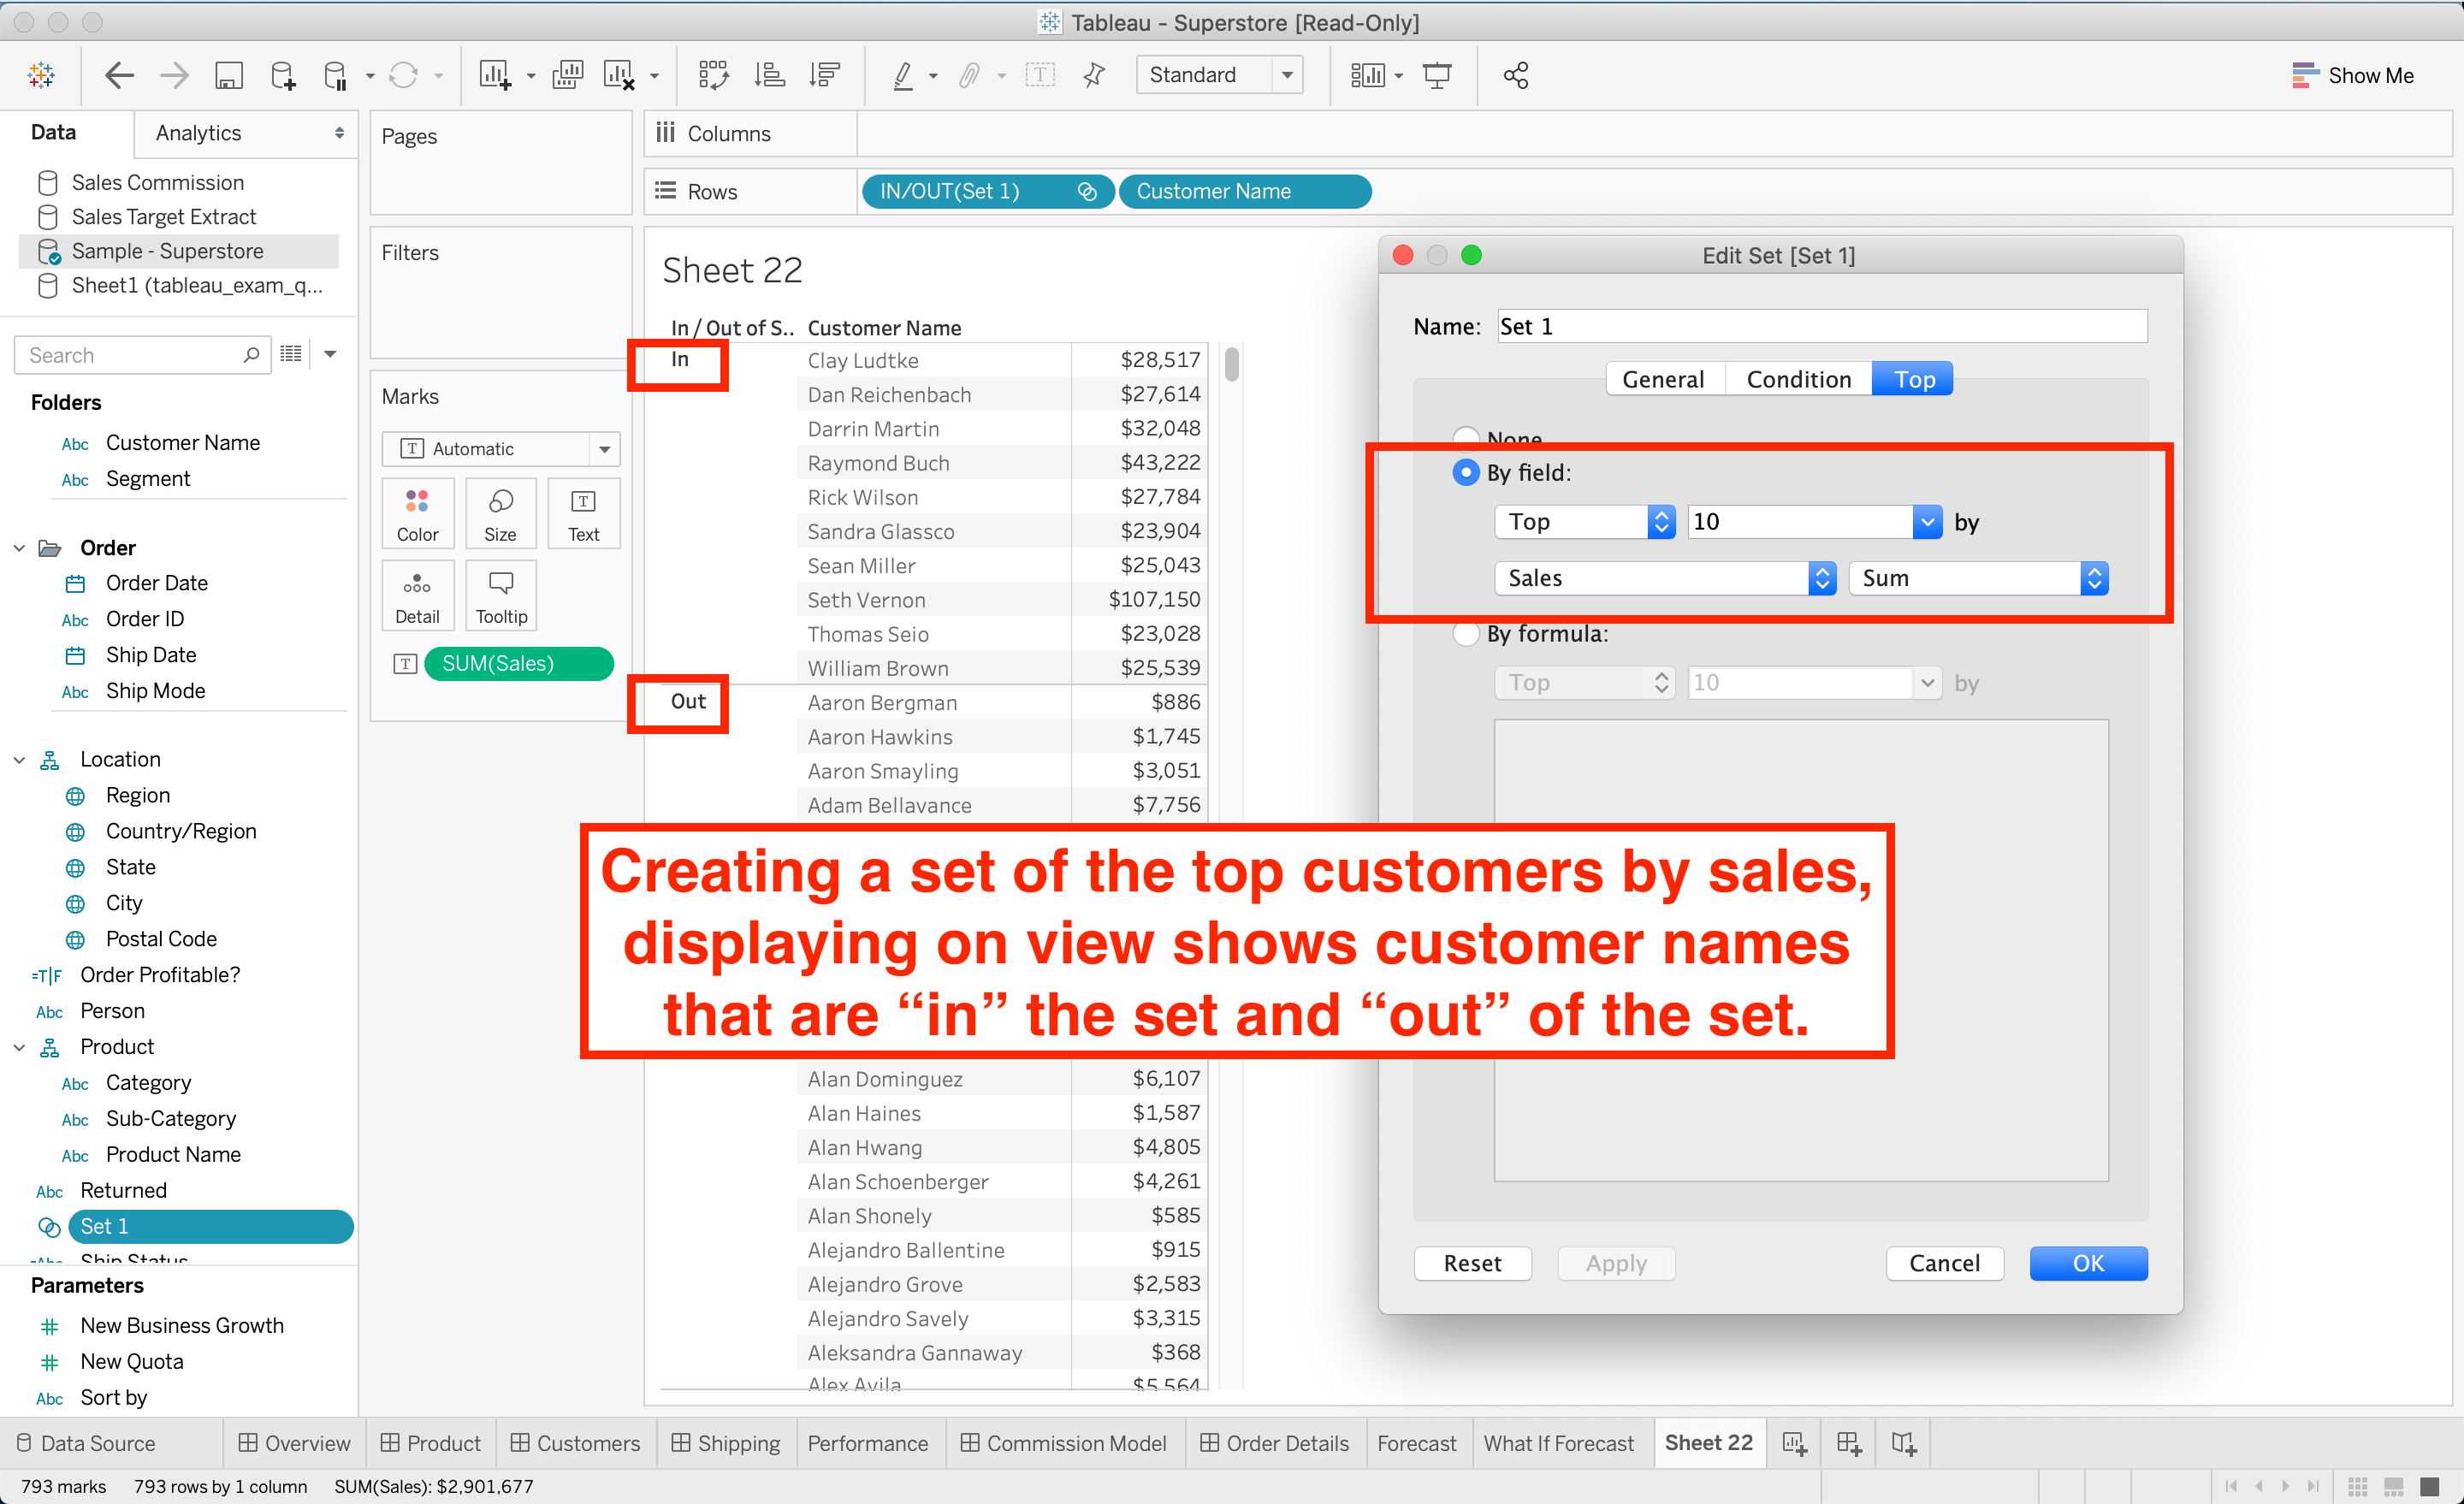
Creating a set in Tableau can answer many different types of questions. When you customize a set, you are allocating data that fit into a category as “in” the set, and the rest of the data that don’t fit as “out” of the set. For example, if you had to identify the top 10 customers by total sales, you could answer this question by creating a set and selecting the “Top” tab and customizing the “By field” option.
在Tableau中创建集合可以回答许多不同类型的问题。 定制集合时,您将分配适合类别的数据作为“集合中的”,而其余数据则不适用于集合的“外部”。 例如,如果您必须按总销售额确定前10名客户,则可以通过创建一个集合并选择“ Top”标签并自定义“ By field”选项来回答此问题。
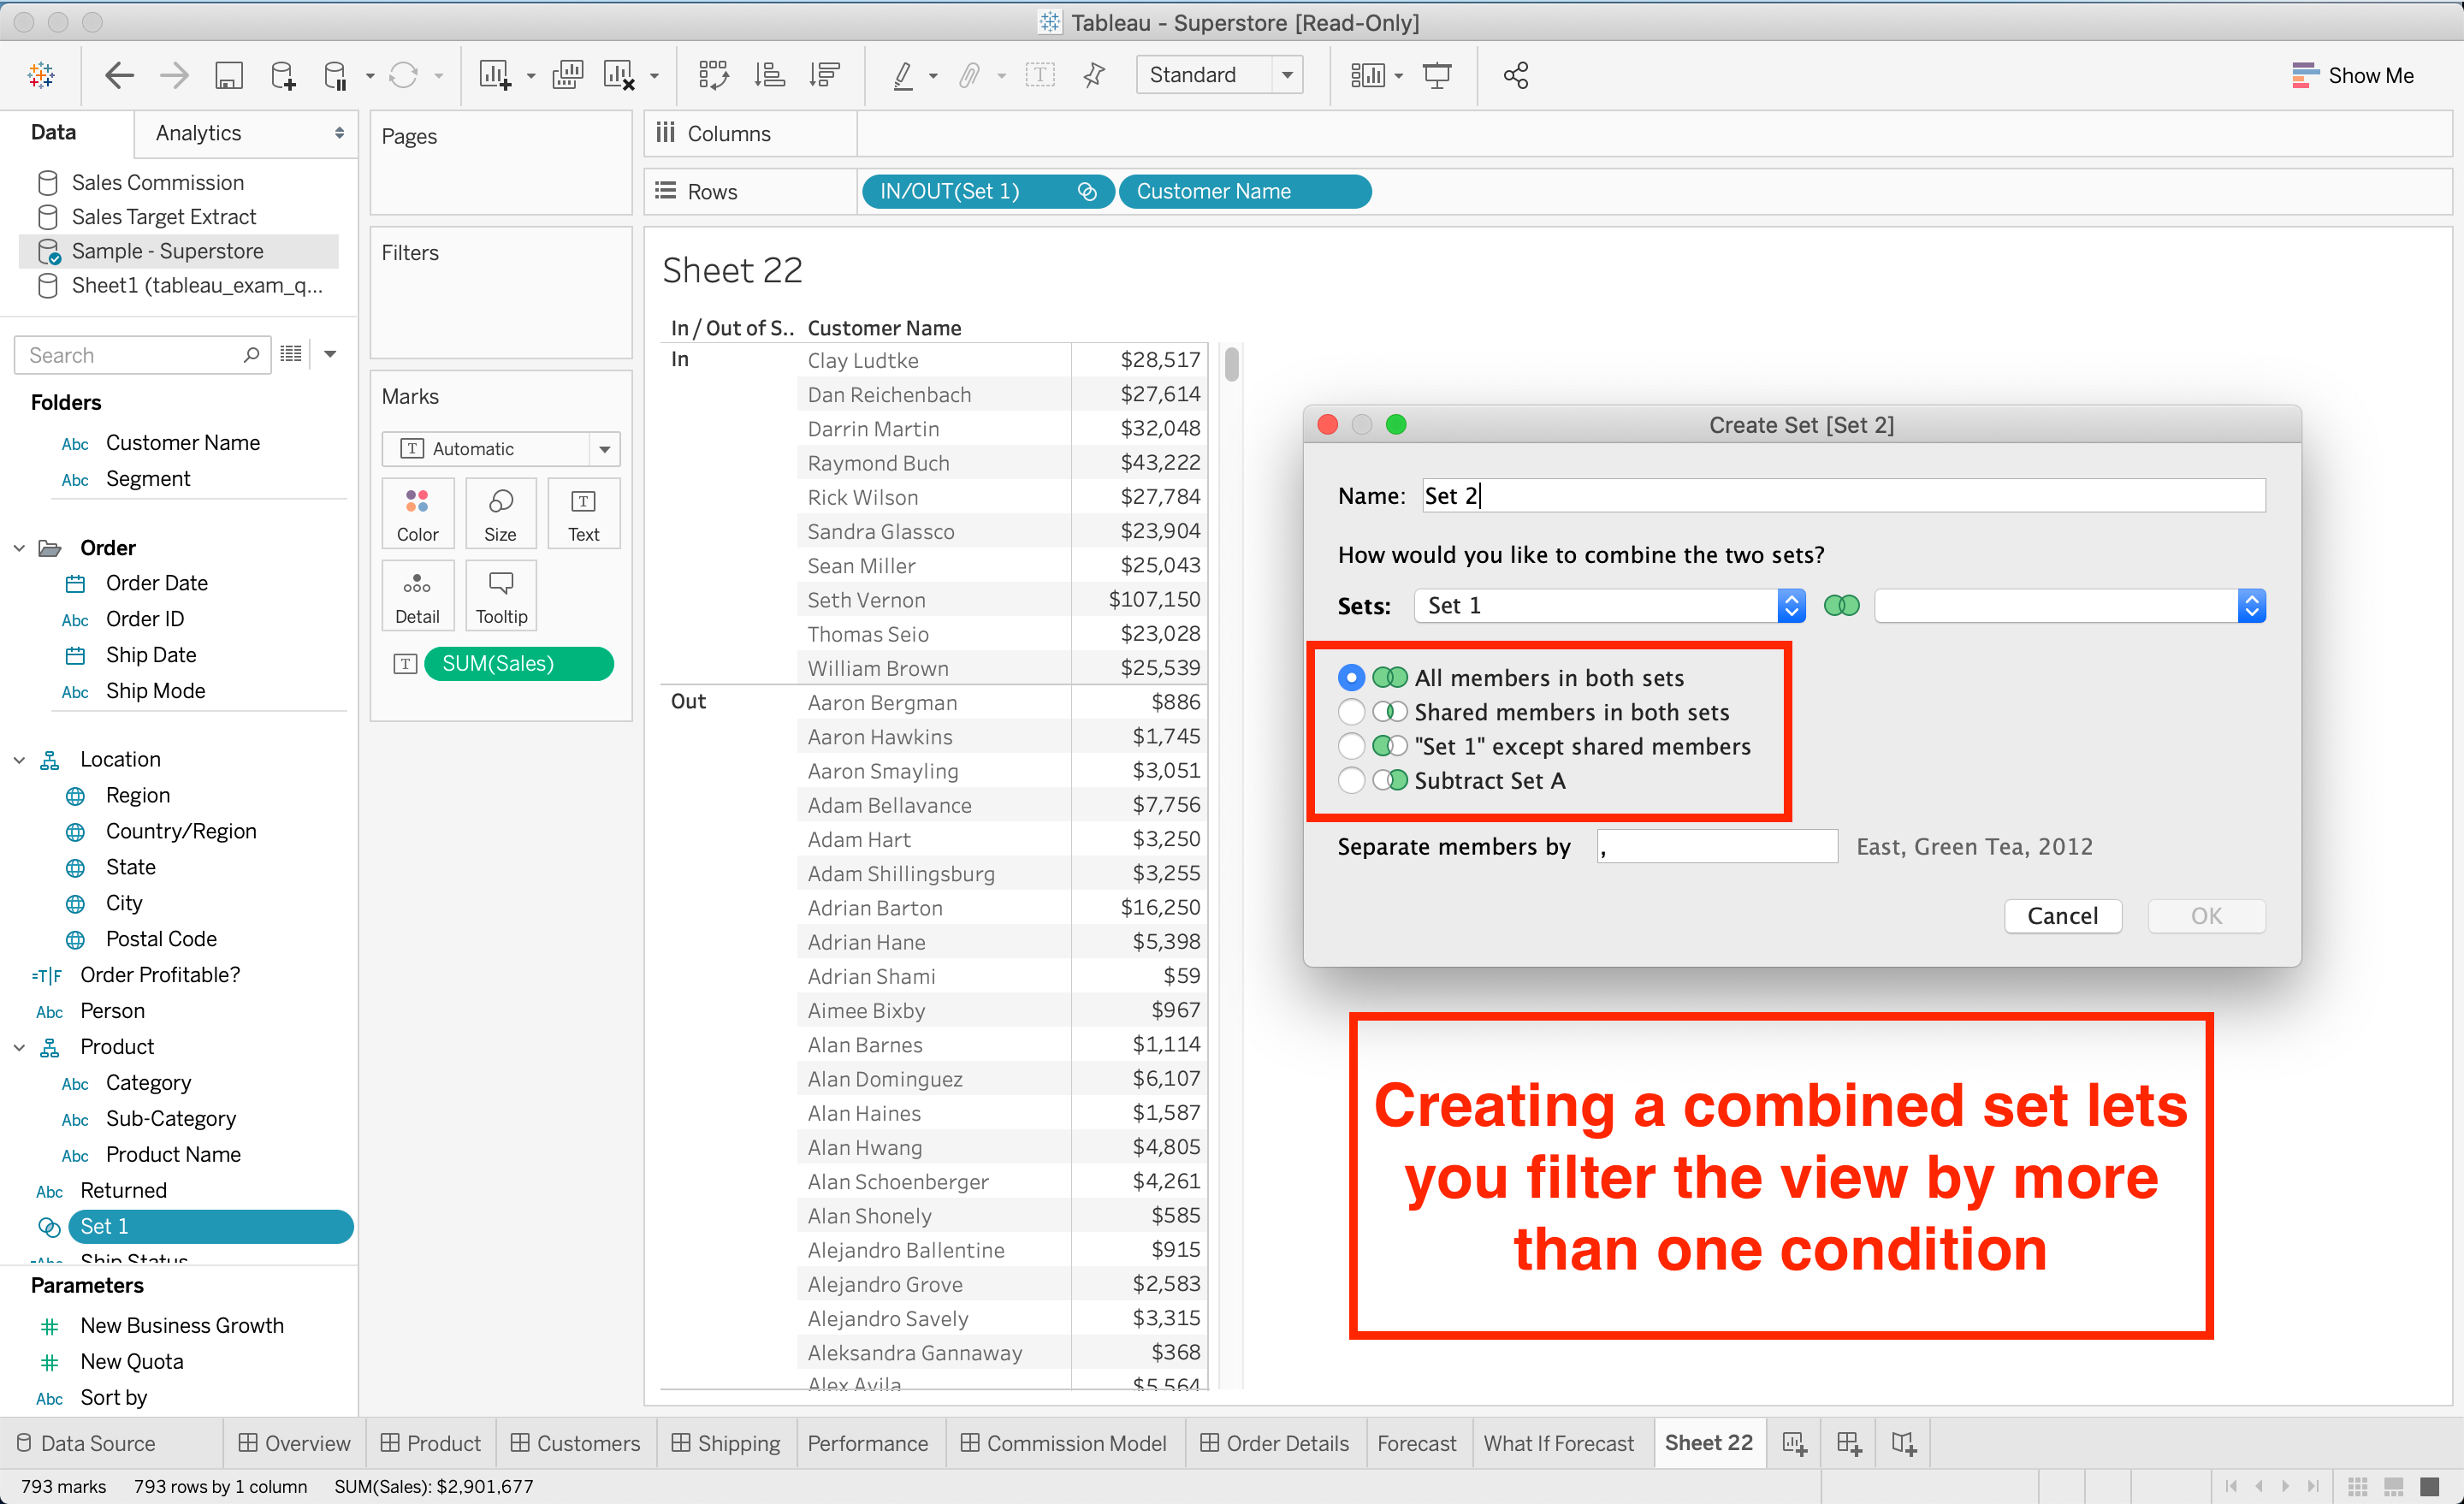
You could also take this a step further and create a combined set if you needed to compare two types of customers. For example, if you wanted to see only customers who were in the top 10 of total sales and the bottom 10 of the total profit, you can right-click on one of the sets and click “Create Combined Set”, after which you can choose to get only members that fit in both of the sets.
如果您需要比较两种类型的客户,也可以更进一步,创建一个组合集 。 例如,如果您只想查看总销售额前10名和利润总额前10名的客户,则可以右键单击其中一组,然后单击“创建组合集”,然后可以选择只获取同时适合这两个集合的成员。
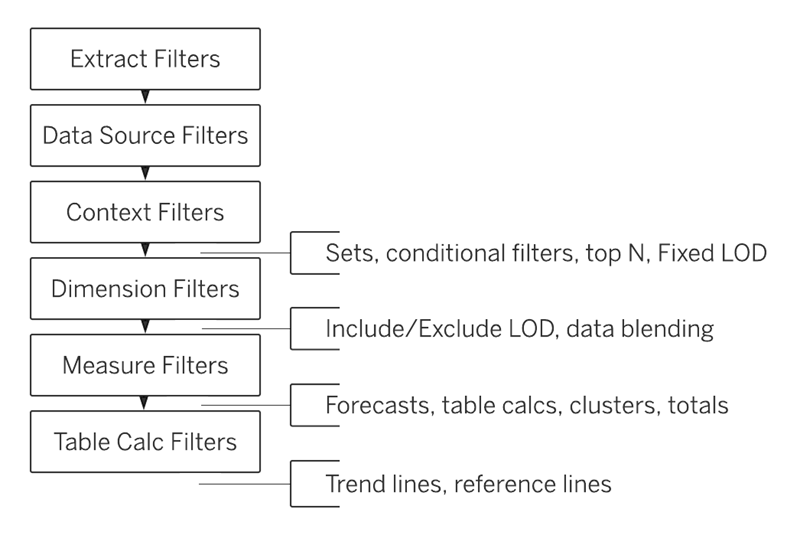
This is a good section to review Tableau’s “Order of Operations”, which layout in which order Tableau implements filters and calculations that you put in the view. For example, when you want one of your dimension filters to be implemented before the rest you would need to set it as a “Context Filter”, as these are implemented before regular dimension filters.
这是检查Tableau的“ 操作顺序 ”的好部分,该布局以Tableau实施您放入视图中的过滤器和计算的顺序。 例如,当您要在其余维度过滤器之前实施一个维度过滤器时,您需要将其设置为“ 上下文过滤器 ”,因为这些过滤器是在常规维度过滤器之前实施的。
字段和图表类型(15%) (Field and Chart Types (15%))
This section involves how Tableau creates visualizations by understanding the components used to create them.
本节涉及Tableau 如何通过了解用于创建可视化的组件来创建可视化。
The first step is understanding the difference between measures and dimensions. Measures in Tableau represent to be the numerical values in your data sources, whereas dimensions are the qualitative values that you use to categorize and aggregate your data. When you drag a dimension onto the view, Tableau will automatically aggregate the view based on that category.
第一步是了解度量和维度之间的差异。 Tableau中的度量表示数据源中的数值,而维是用于对数据进行分类和汇总的定性值。 将维度拖到视图上时,Tableau将根据该类别自动聚合视图。
Say you initially just had a graph with each sale plotted over time. If you then dragged “Region” into the view, you would still get sales over time, but there would likely be less individual points on the graph, as all the individual points in each same region would have been added together (i.e. Tableau would change [Sales] to SUM([Sales]).
假设您最初只是有一张图表,其中每笔交易都绘制了一段时间。 如果随后将“区域”拖动到视图中,则随着时间的推移您仍将获得销售,但是图形上的单个点可能会更少,因为每个相同区域中的所有单个点都将被加在一起(即Tableau会改变[销售]到SUM([销售])。
You also need to know the difference between discrete and continuous fields. At first glance, you may assume that all measures must be continuous and all dimensions must be discrete. However, this is not the case. Some measures may be discrete (rare), and some dimensions may be continuous (less rare).
您还需要了解离散字段和连续字段之间的区别。 乍一看,您可能会假设所有度量必须是连续的,并且所有维都必须是离散的。 然而,这种情况并非如此。 一些度量可能是离散的(稀有),而某些维度可能是连续的(较少见)。
In most cases, measures tend to be continuous, as continuous values form an unbroken whole and go to infinity. For example, the “Sales” measure is continuous, because there is technically no upper limit to a company’s sales, and the sales value could be any number. In contrast, discrete values are those that are distinct from one another. For example, different values in the “Product Category” dimension are discrete, as there are a set number of values that the dimension can take.
在大多数情况下,度量往往是连续的,因为连续的值形成一个完整的整体并达到无穷大。 例如,“销售”度量是连续的,因为从技术上讲,公司的销售没有上限,并且销售价值可以是任何数字。 相反, 离散值是彼此不同的值。 例如,“产品类别”维度中的不同值是离散的,因为维度可以采用一定数量的值。
Also, you might initially think that all measures are green and all dimensions are blue. This is not the case, which you can see if you right-click on a measure and select “Convert to dimension”. You’ll see that all discrete fields are blue and all continuous fields are green.
同样,您最初可能会认为所有度量均为绿色,而所有尺寸均为蓝色。 情况并非如此,如果右键单击度量并选择“转换为尺寸”,就会看到这种情况。 您会看到所有离散字段均为蓝色,所有连续字段均为绿色。
Tableau also automatically generates some fields that you can use. They are present at the bottom of the list of dimensions and measures, and are italicized so you can quickly identify them. It’s best to just drag these into the view so you understand what they do. You’ll also see that when you select certain chart types, some of these fields will automatically be added to the view. The number of records measure is also an auto-generated field from Tableau. You can think of it as an extra column in the table, with the values in each row being “1”, as it’s meant to serve as a count of all the rows in your data source.
Tableau还会自动生成一些您可以使用的字段 。 它们位于尺寸和度量列表的底部,并以斜体显示,因此您可以快速识别它们。 最好将它们拖到视图中,以便您了解它们的作用。 您还将看到选择某些图表类型时,其中某些字段会自动添加到视图中。 记录数度量也是Tableau的自动生成的字段。 您可以将其视为表中的额外列,每行中的值为“ 1”,因为它意在用作数据源中所有行的计数。
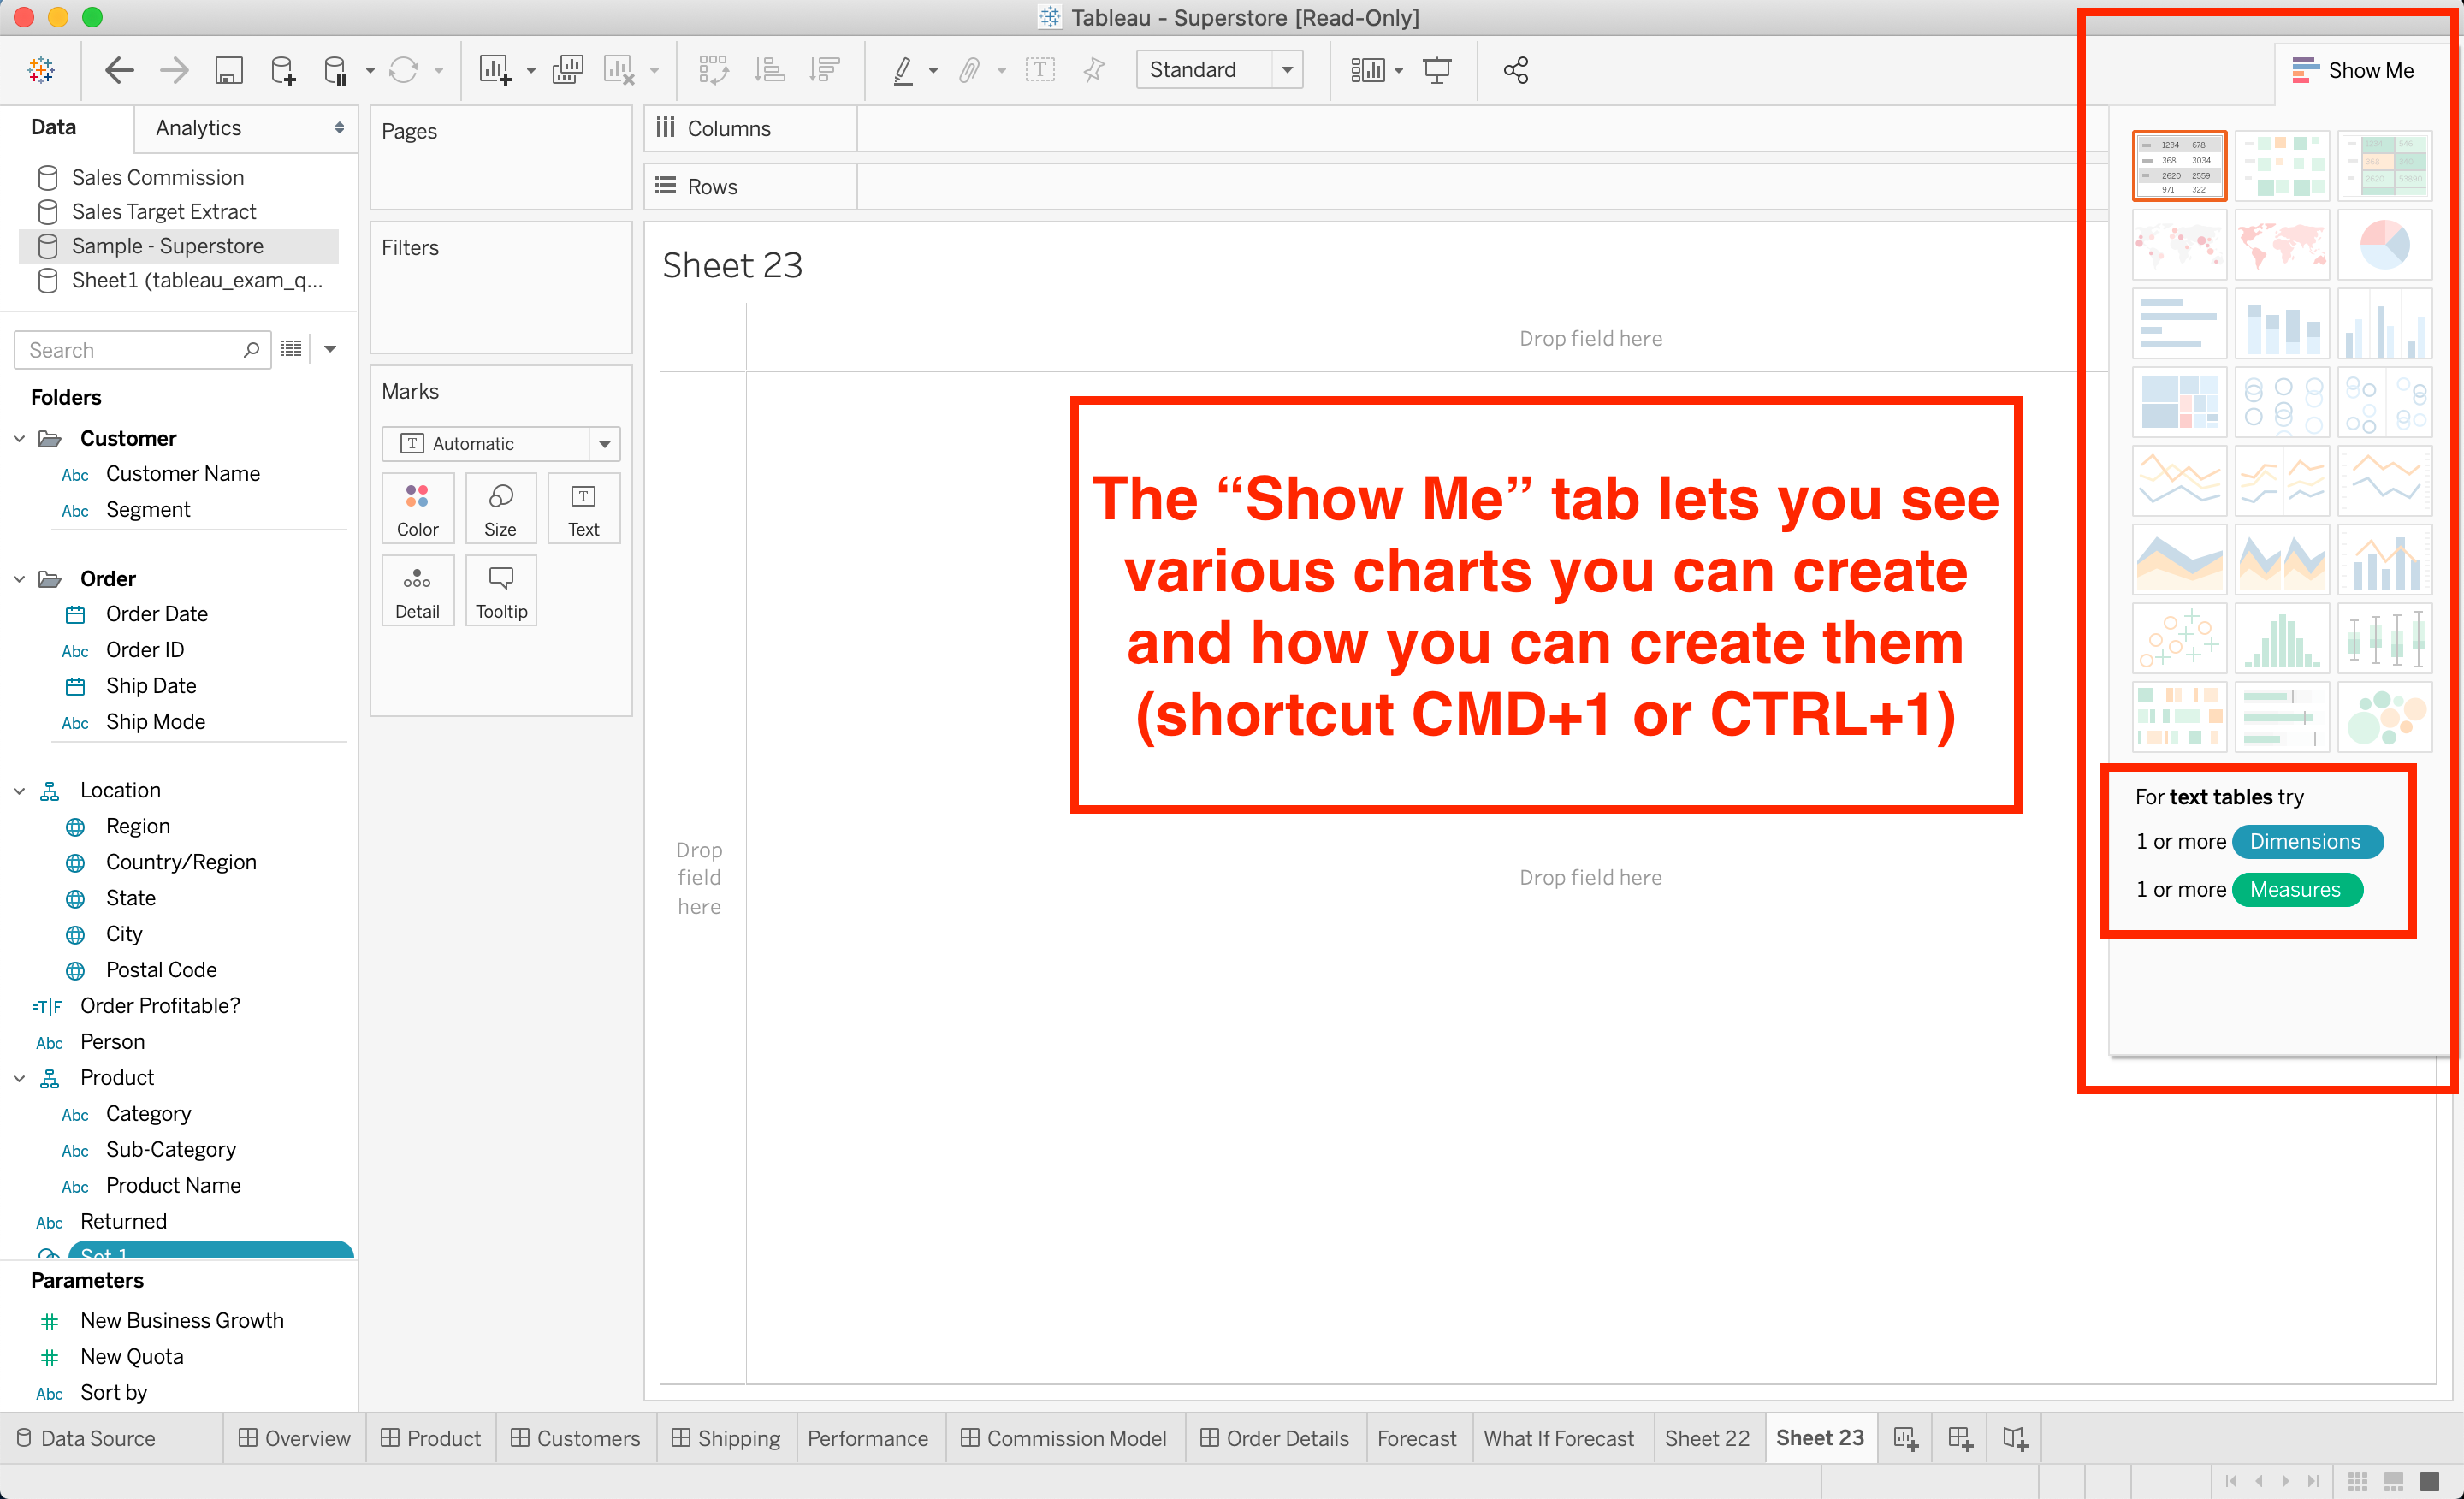
There is a wide range of charts you can build on Tableau, from histograms to heat maps. If you click the helpful “Show Me” tab on the upper right, Tableau will show you which combination of dimensions and/or measures you need to create each type of chart.
您可以在Tableau上构建各种图表,从直方图到热图。 如果单击右上角有用的“ Show Me ”选项卡,Tableau将为您显示创建每种类型的图表所需的尺寸和/或度量的组合。
It’s also important not only to know how to create each type of chart, but also when you might need to use them. Histograms, for example, look similar to bar charts but serve a completely different purpose.
同样重要的是,不仅要知道如何创建每种类型的图表,而且要知道何时需要使用它们。 例如,直方图看起来与条形图相似,但用途完全不同。
计算(18%) (Calculations (18%))
Oh boy, calculations.
天哪,算了。
This is the highest weighted section on the exam, and for good reason. It’s easy enough to drag and drop measures and dimensions into the view to create informative visualizations. But once you get comfortable using calculations, you’ll add a whole new layer of depth to your analyses and unlock Tableau’s full potential.
这是考试中权重最高的部分,这是有充分理由的。 将度量和尺寸拖放到视图中以创建信息化的可视化效果非常容易。 但是一旦您对计算感到满意,就可以在分析中添加全新的深度,并释放Tableau的全部潜力。
Here, it’s very important to distinguish between those calculations with aggregated values and those without. For example, if you’re looking to calculate a profit to sales ratio for a particular region, you may think that you can just create a calculated field with [Profit] / [Sales]. However, if you add this calculation to the view, you won’t get the correct result because Tableau will perform the calculation at for each row, and then add all the individual profit to sales ratios together. What you really want is SUM([Profit]) / SUM([Sales]), as this calculation will take into account the granularity on your view.
在这里,区分具有汇总值的计算与没有汇总值的计算非常重要。 例如,如果您要计算特定区域的利润与销售比率,您可能会认为您可以仅使用[利润] / [销售]创建一个计算字段。 但是,如果将此计算添加到视图中,将不会得到正确的结果,因为Tableau将针对每行执行一次计算,然后将所有单个利润与销售比率相加。 您真正想要的是SUM([Profit])/ SUM([Sales]),因为此计算将考虑您视图的粒度。
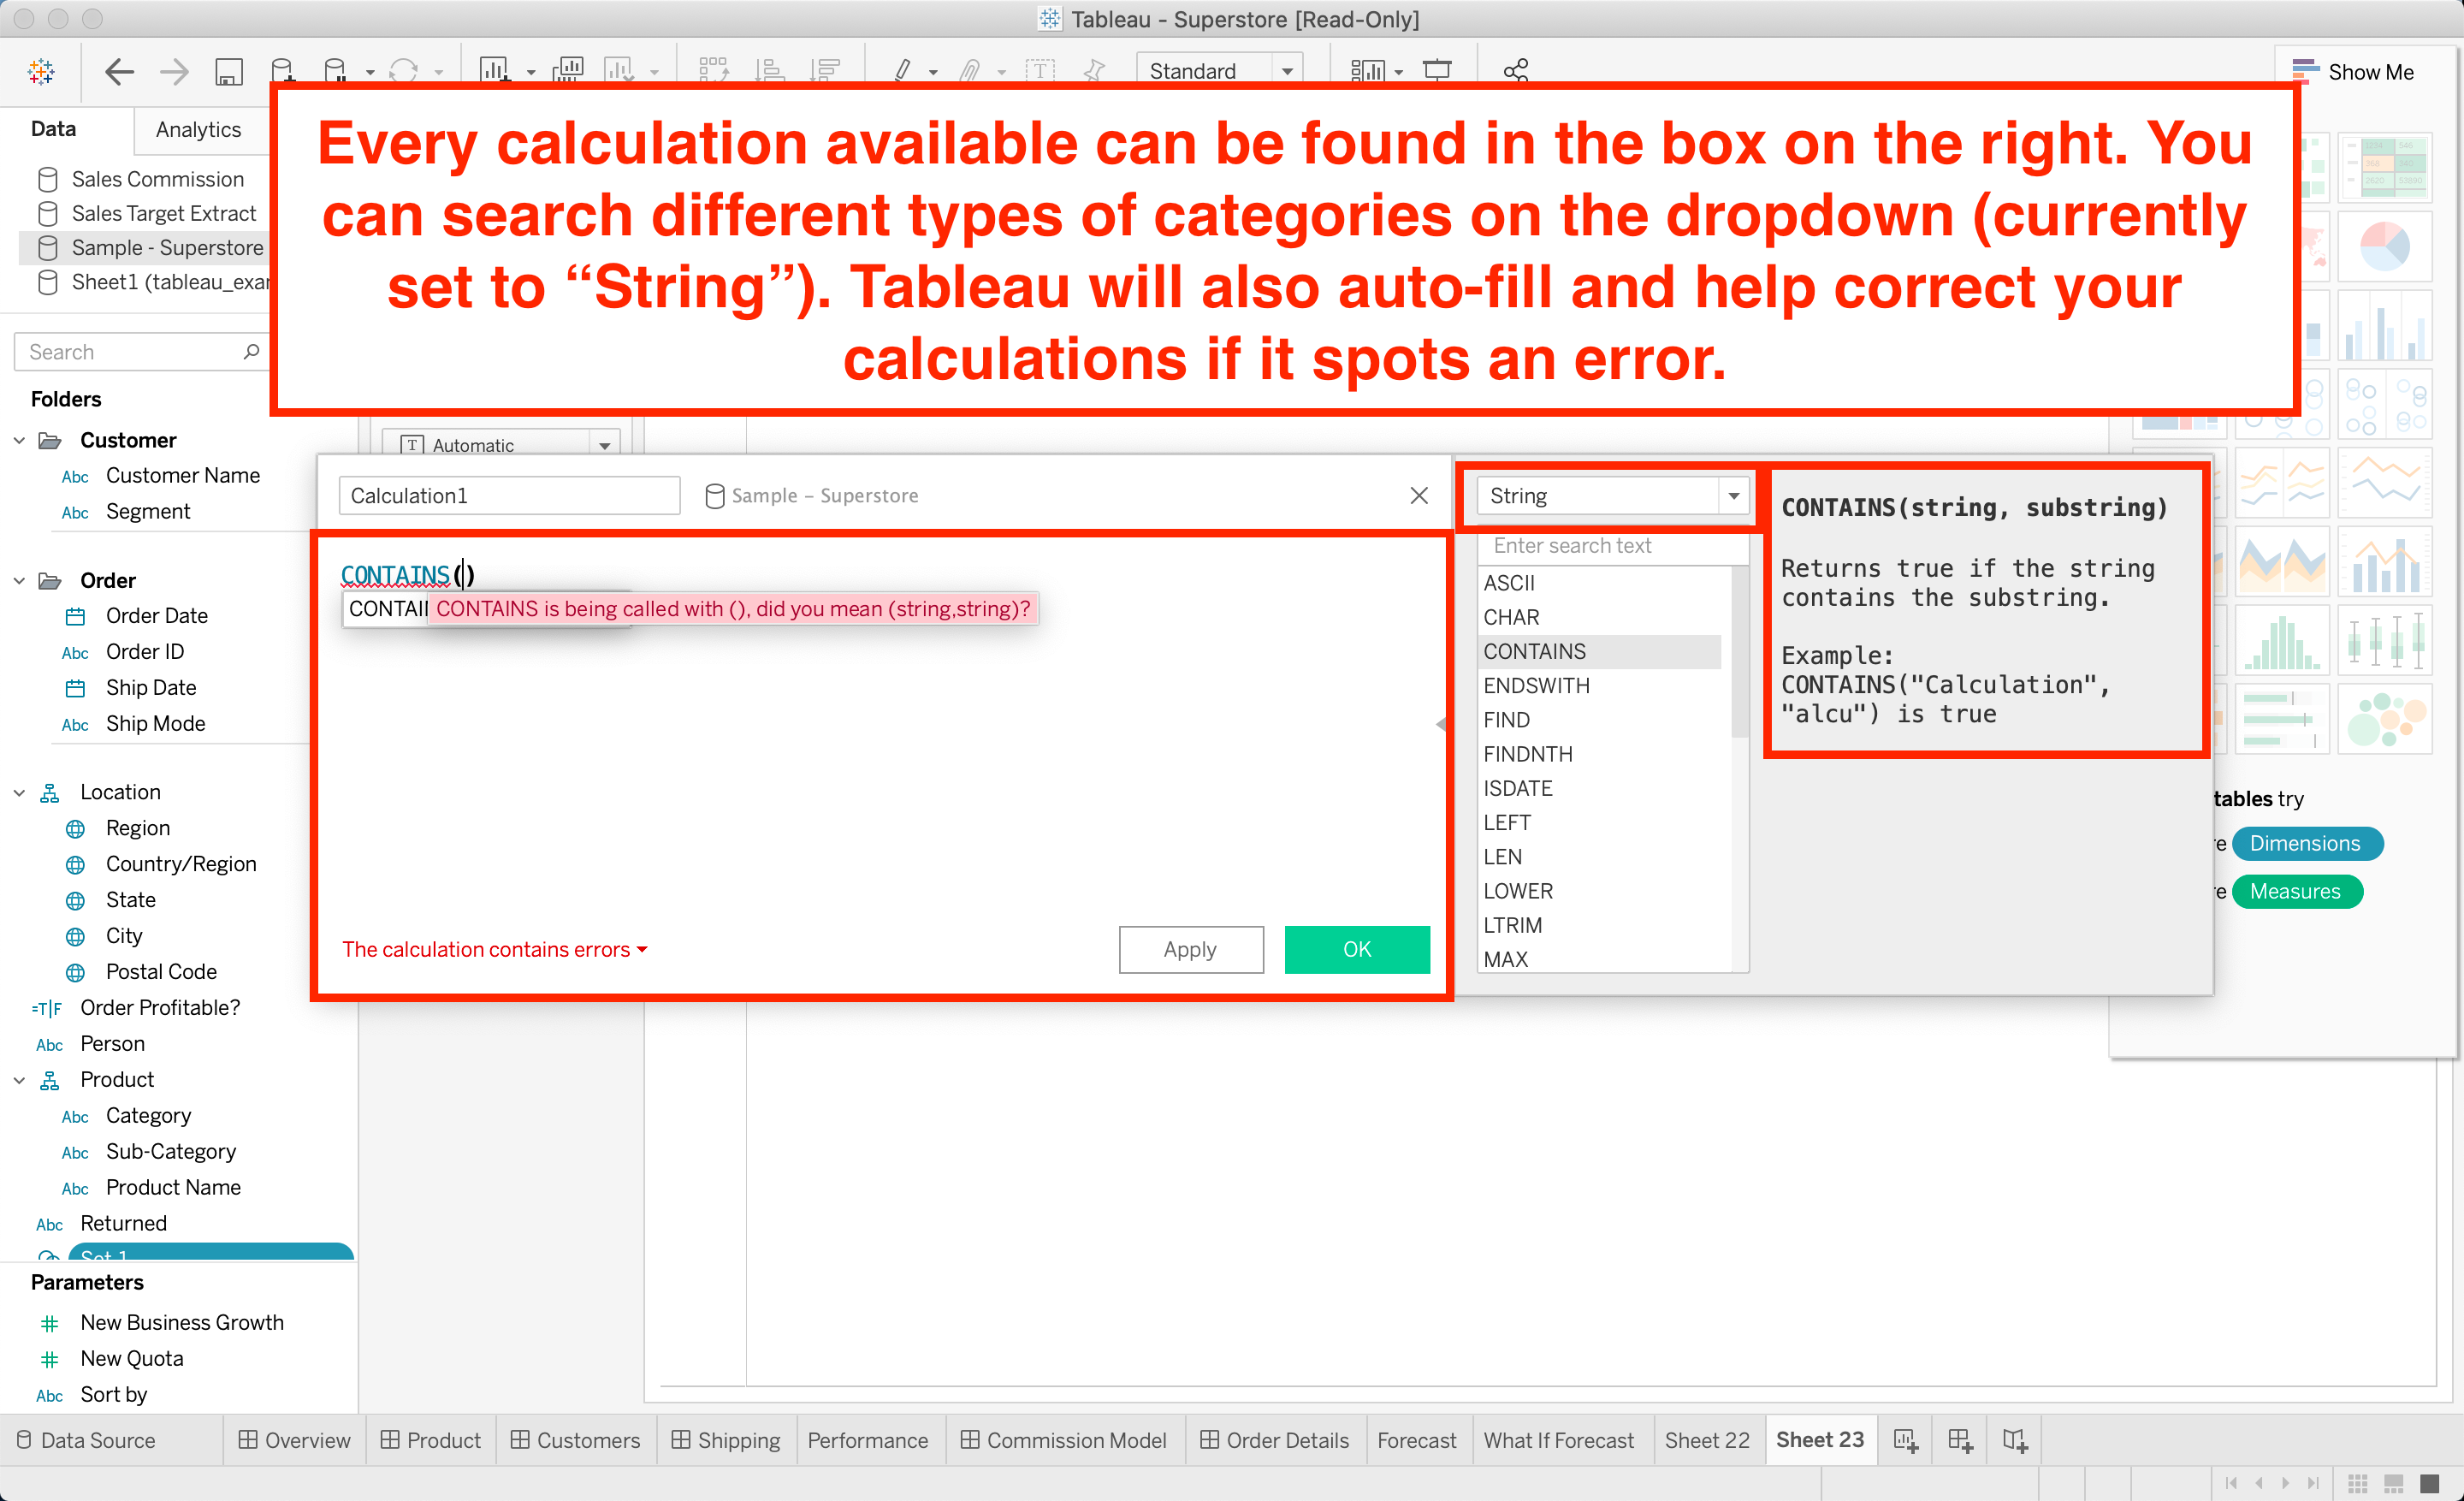
Tableau explains what values are needed for every calculation when you’re creating a calculated field, so there’s no need to memorize what goes where. However, it is worth the different string, date, arithmetic, and logic calculations that Tableau offers, so at least you’ll know the names of the calculations during the exam. To create a calculated field, click “Analysis” and then “Create Calculated Field”. You can also right-click a dimension or measure and then click “Create Calculated Field”.
Tableau解释了在创建计算字段时每次计算都需要哪些值,因此无需记住去往何处。 但是,值得Tableau提供不同的字符串,日期,算术和逻辑计算,因此至少您会在考试期间知道计算的名称。 要创建计算字段,请单击“分析”,然后单击“创建计算字段”。 您也可以右键单击尺寸或度量,然后单击“创建计算字段”。
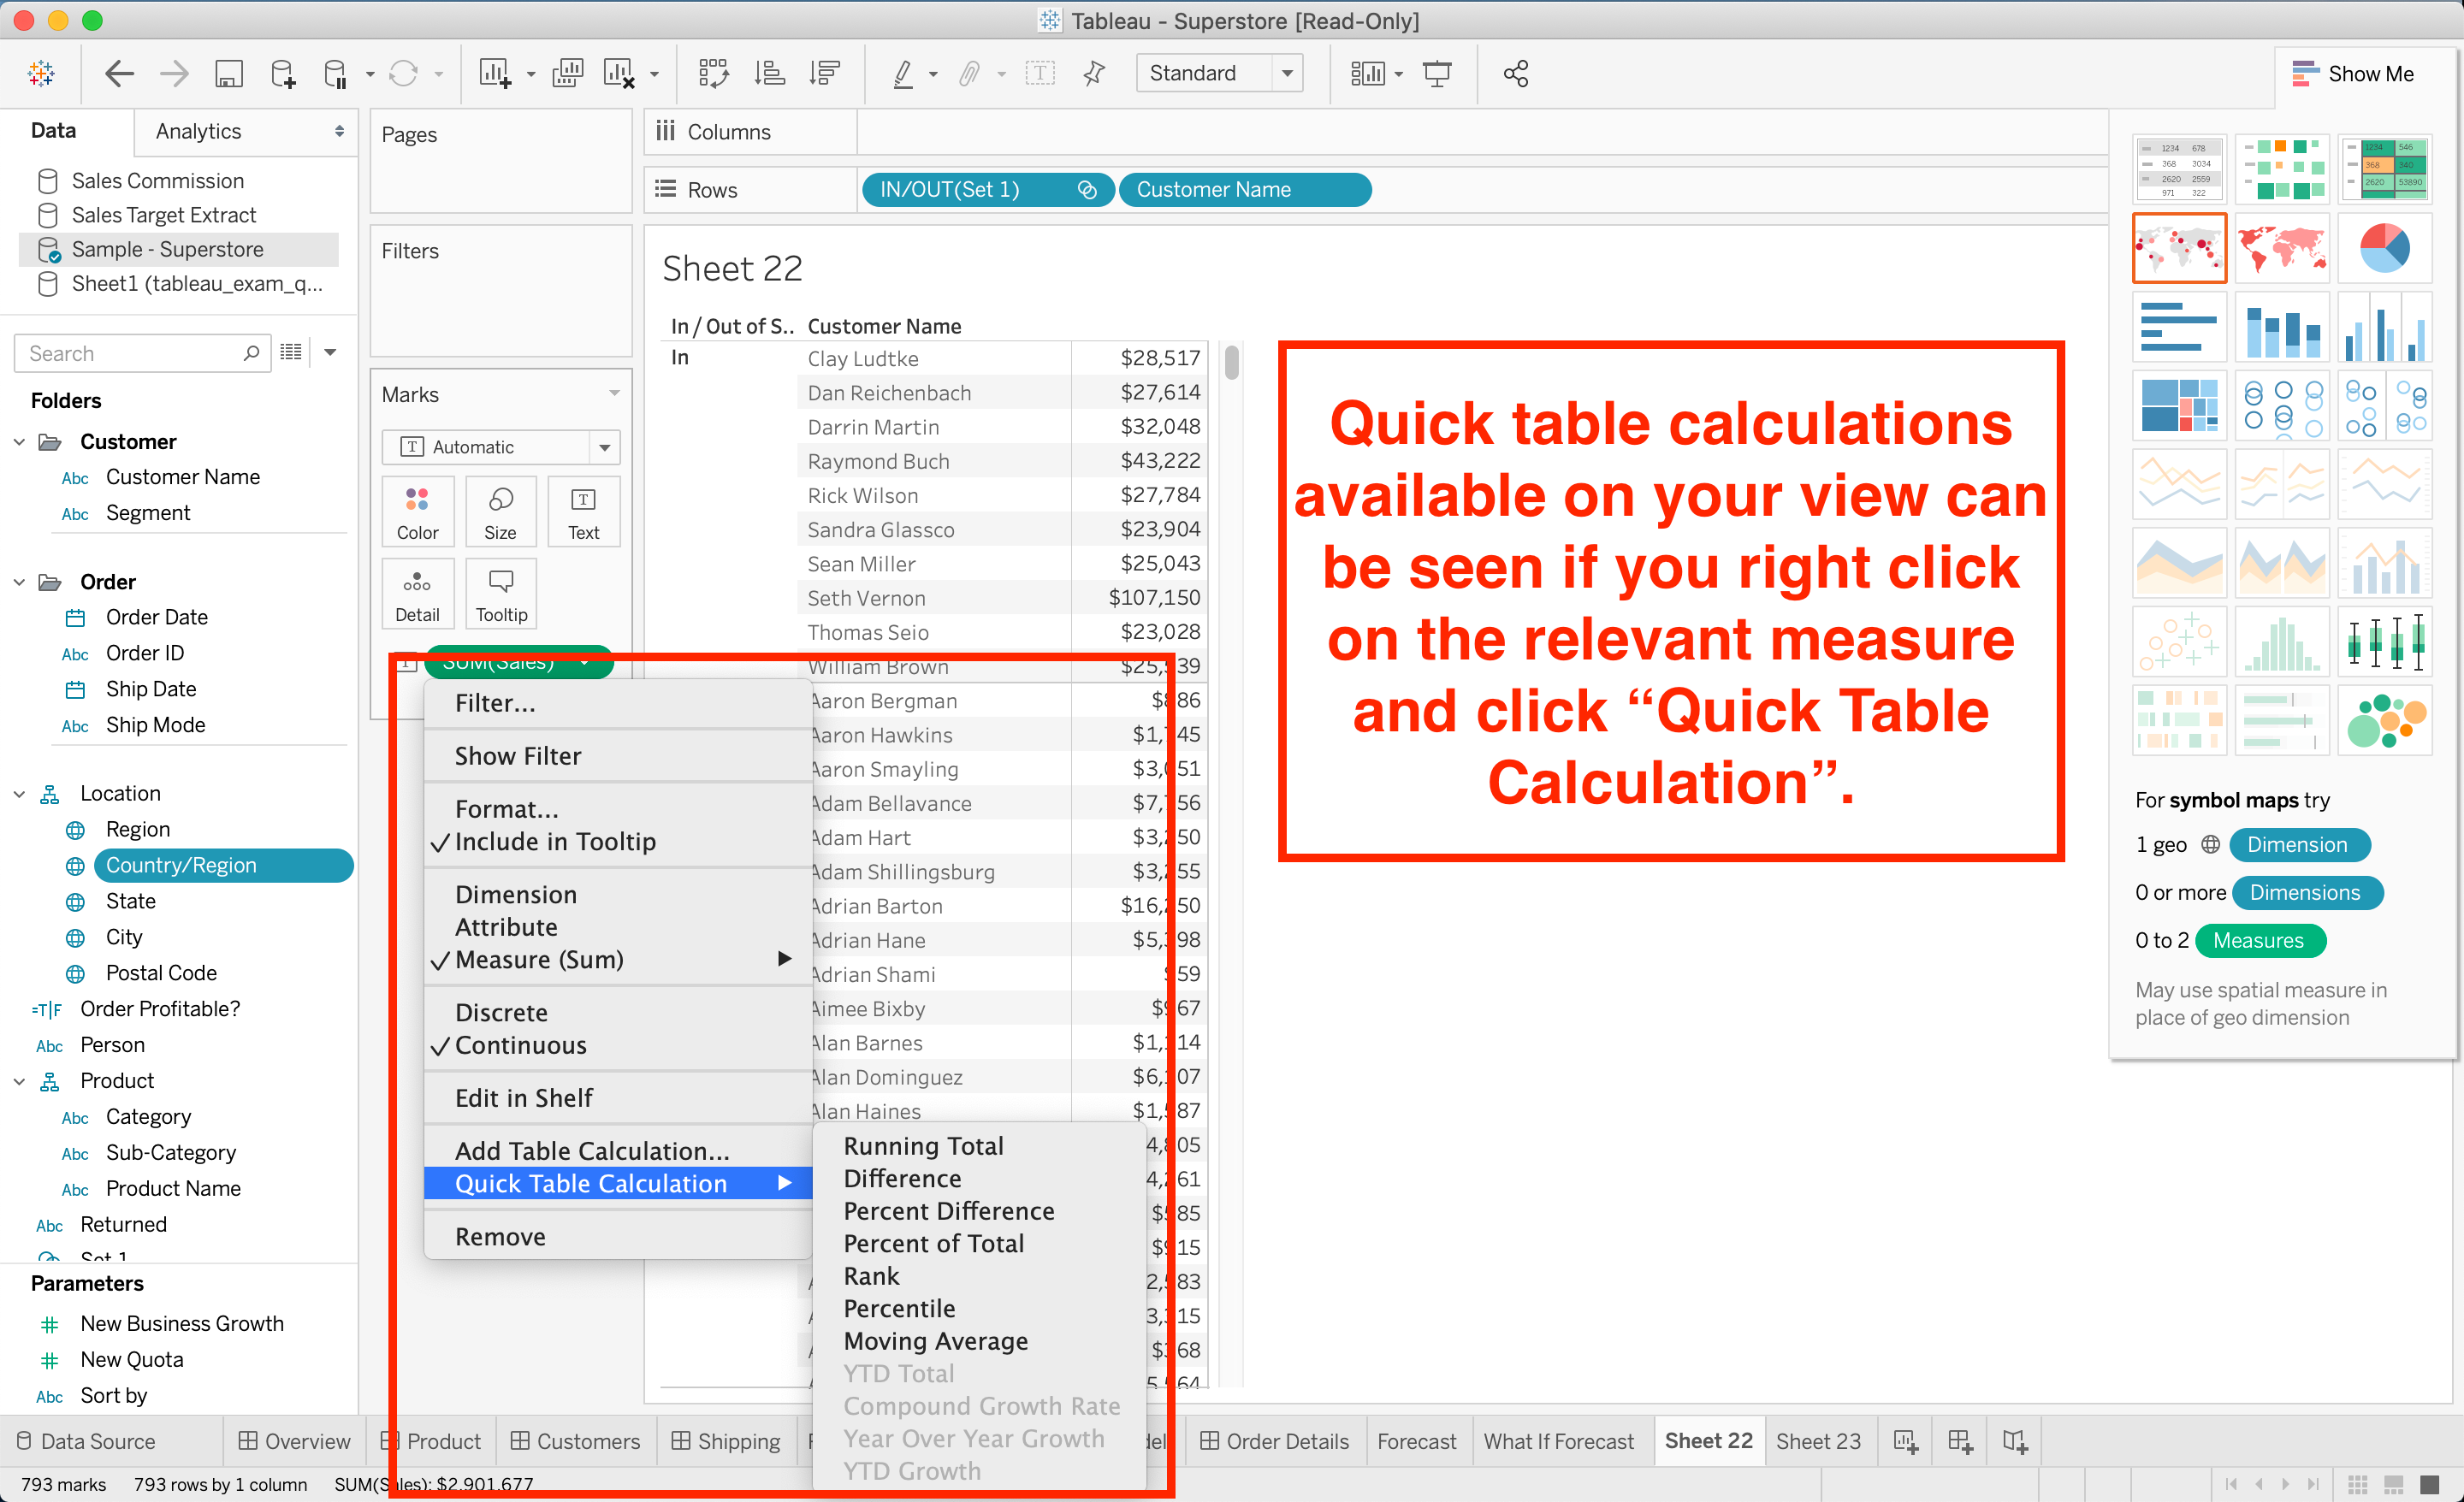
You should also understand how table calculations work, and try out the most common ones like “Percent of Total”, “Moving Average”, and “Difference”. You may get a question that specifically has the type of table calculation you need in it, so all you need to do is select the right one from “Quick Table Calculation”.
您还应该了解表计算的工作原理,并尝试最常见的计算方法 ,例如“ 合计百分比 ”,“ 移动平均值 ”和“ 差异 ”。 您可能会得到一个问题,其中特别包含您需要的表计算类型,因此您需要做的就是从“ 快速表计算 ”中选择正确的表计算类型 。
Understanding when and how to create “Level of Detail” (LOD) calculations is also important, as there may be questions that seem straight forward but actually require these kinds of calculations. LOD calculations allow you to control which level of granularity you want to perform a calculation on, and can use values in calculations that don’t appear on the view.
了解何时以及如何创建“ 详细程度 ”(LOD)计算也很重要,因为可能存在一些直截了当但实际上需要进行此类计算的问题。 通过LOD计算,您可以控制要在哪个粒度级别上执行计算,并且可以在视图中未显示的计算中使用值。
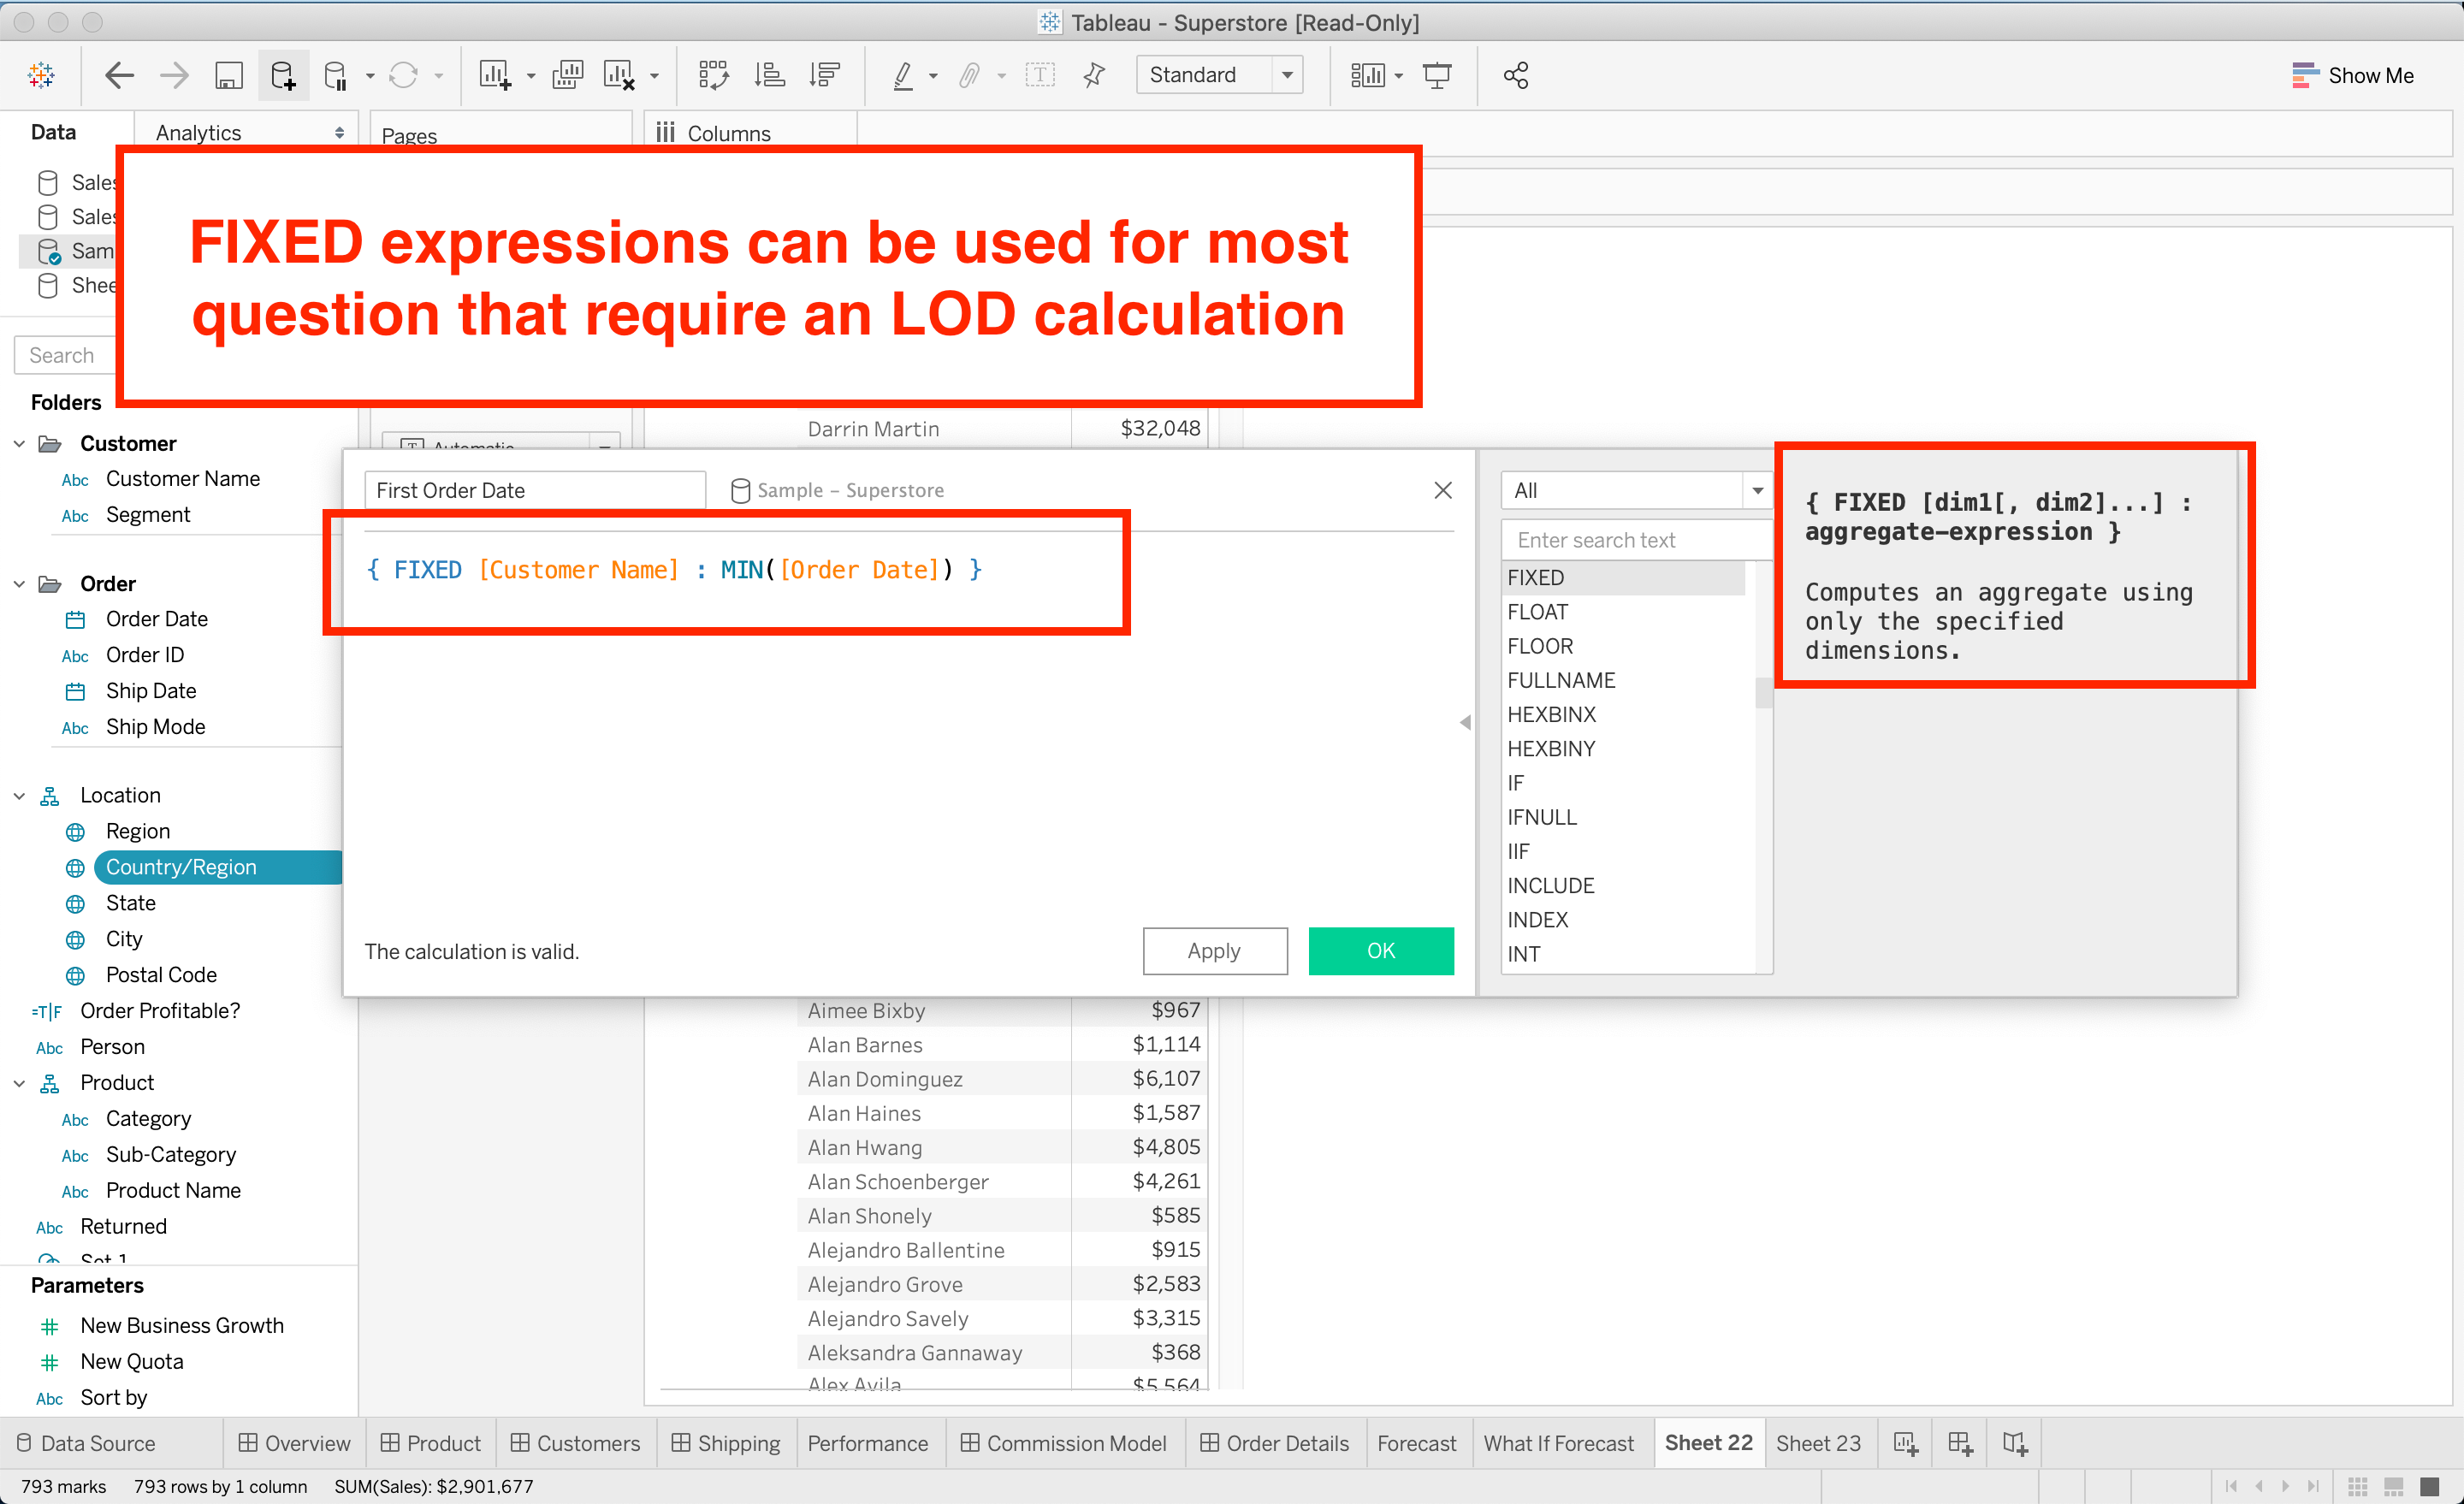
Level of Detail expressions (also known as LOD expressions) allow you to compute values at the data source level and the visualization level. There are INCLUDE, EXCLUDE, and FIXED LOD expressions, but in general, FIXED expression can be used in most cases. Exceptions to this can occur when you need the LOD expression to be calculated in a different order relative to the filters you have on your view (see “order of operations” in the first section).
详细级别表达式(也称为LOD表达式)使您可以在数据源级别和可视化级别计算值。 有INCLUDE,EXCLUDE和FIXED LOD表达式,但是通常,在大多数情况下都可以使用FIXED表达式。 当您需要以相对于视图上的过滤器不同的顺序来计算LOD表达式时,可能会发生这种情况(请参阅第一部分中的“ 操作顺序 ”)。
FIXED LOD expressions let you perform calculations with values that are independent of what’s shown on the view. One useful type of activity you can perform with these expressions are cohort analyses, which let you answer questions like: “How much profit comes from customers who first ordered in 2011, 2012, 2013, etc.?” Here, you’re creating groups of customers based on their first order date, and to do so you need to use a FIXED LOD expression.
FIXED LOD表达式使您可以使用与视图上显示的值无关的值执行计算。 可以使用这些表达式执行的一种有用的活动类型是队列分析,它可以让您回答以下问题:“在2011、2012、2013等年首次订购的客户有多少利润?” 在这里,您要根据客户的第一笔订单日期创建客户组,为此,您需要使用FIXED LOD表达式。
映射(13%) (Mapping (13%))
Ah, maps. They look may look simple, but you can do so much more with them than just color code different regions.
啊,地图。 它们看起来很简单,但您不仅可以对不同区域进行颜色编码,还可以做更多的事情。
One important tip to begin with: check to see if the data source provides you with “Latitude” and “Longitude” measures. If so, you’ll want to use these instead of Tableau’s auto-generated “Latitude” and “Longitude” measures, which are italicized and present at the bottom of the data pane. This is because sometimes Tableau cannot generate the coordinates for a custom location in your data set. This is why many data sets with special geographic locations come with their own “Latitude” and “Longitude” measures.
开始时的一个重要提示:检查数据源是否为您提供了“ 纬度 ”和“ 经度 ”度量。 如果是这样,您将希望使用这些替代Tableau的自动生成的“纬度”和“经度”度量,这些度量以斜体显示在数据窗格的底部。 这是因为有时Tableau无法生成数据集中自定义位置的坐标。 这就是为什么许多具有特殊地理位置的数据集都有自己的“纬度”和“经度”度量。
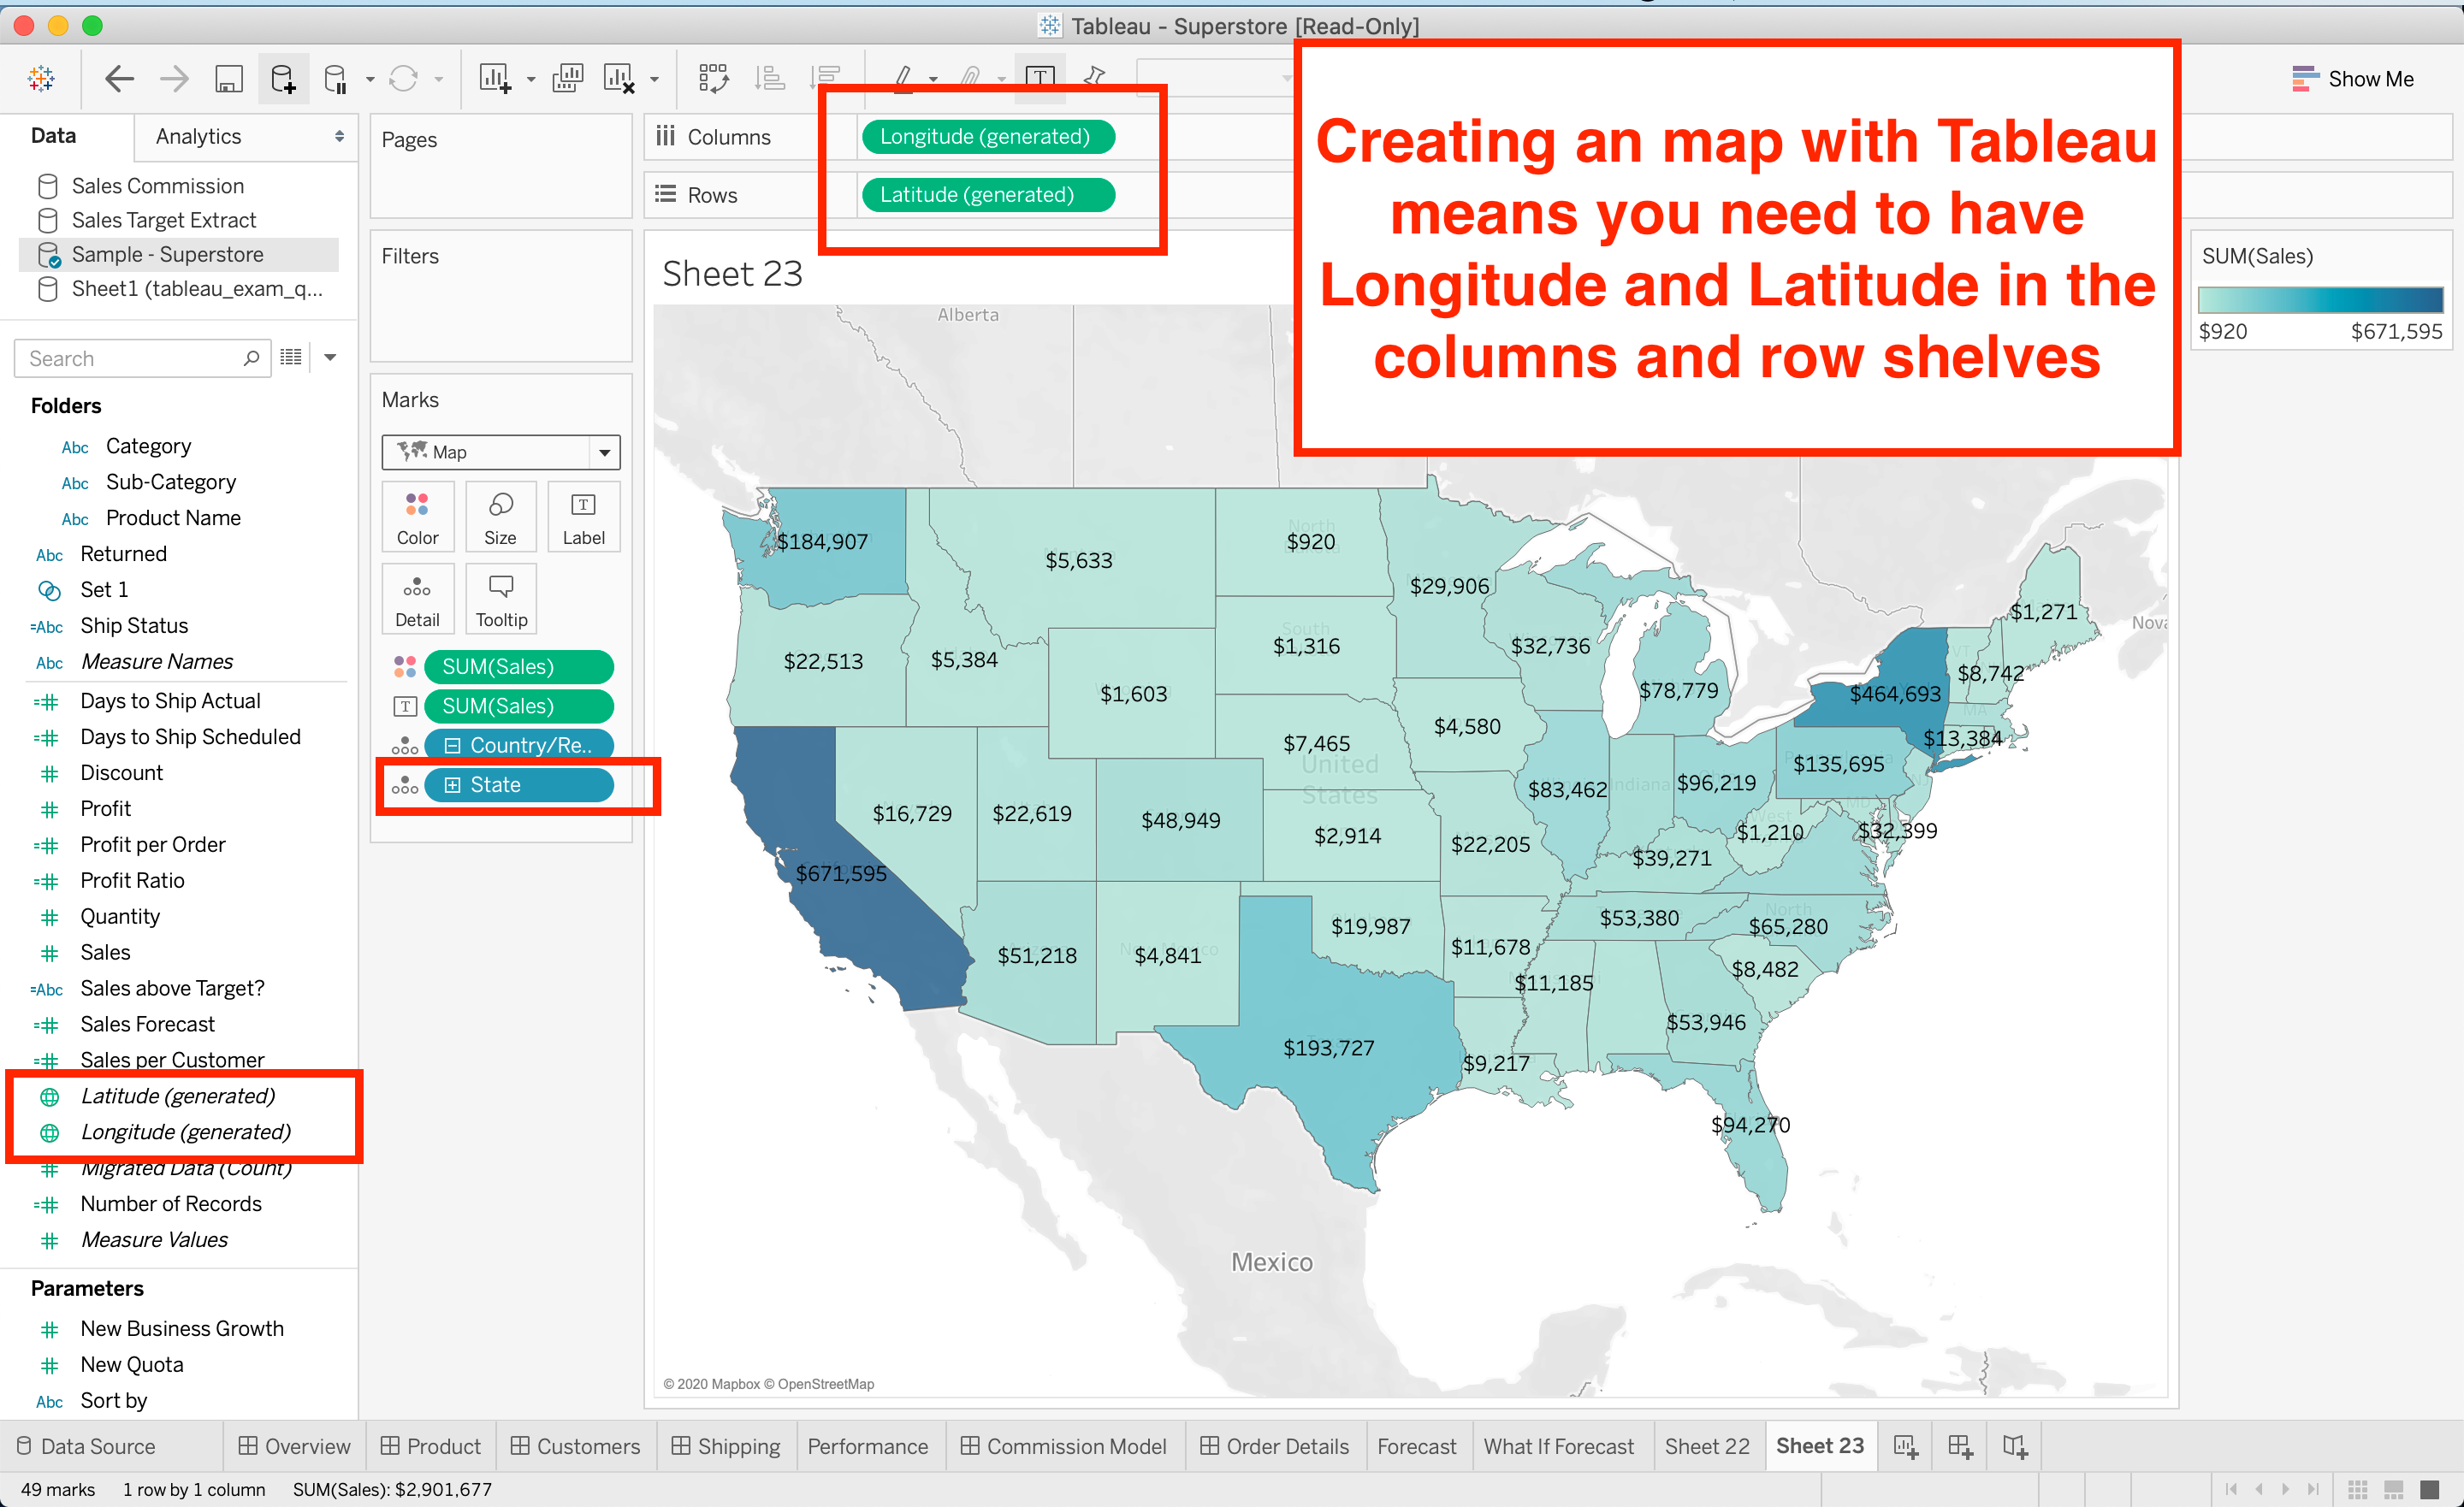
Tableau also lets you check the distance between different locations with its “Radial selection” tool. However, you’ll need to make sure you have zoomed in close enough so that the tool will show distance. This is because the Earth is not flat, so Tableau can allow show you the “straight line distance” between two locations up to a certain point.
Tableau还允许您使用其“ 径向选择 ”工具检查不同位置之间的距离。 但是,您需要确保放大得足够近,这样工具才能显示距离。 这是因为地球不是平坦的,所以Tableau可以向您显示两个位置之间直到特定点的“直线距离”。
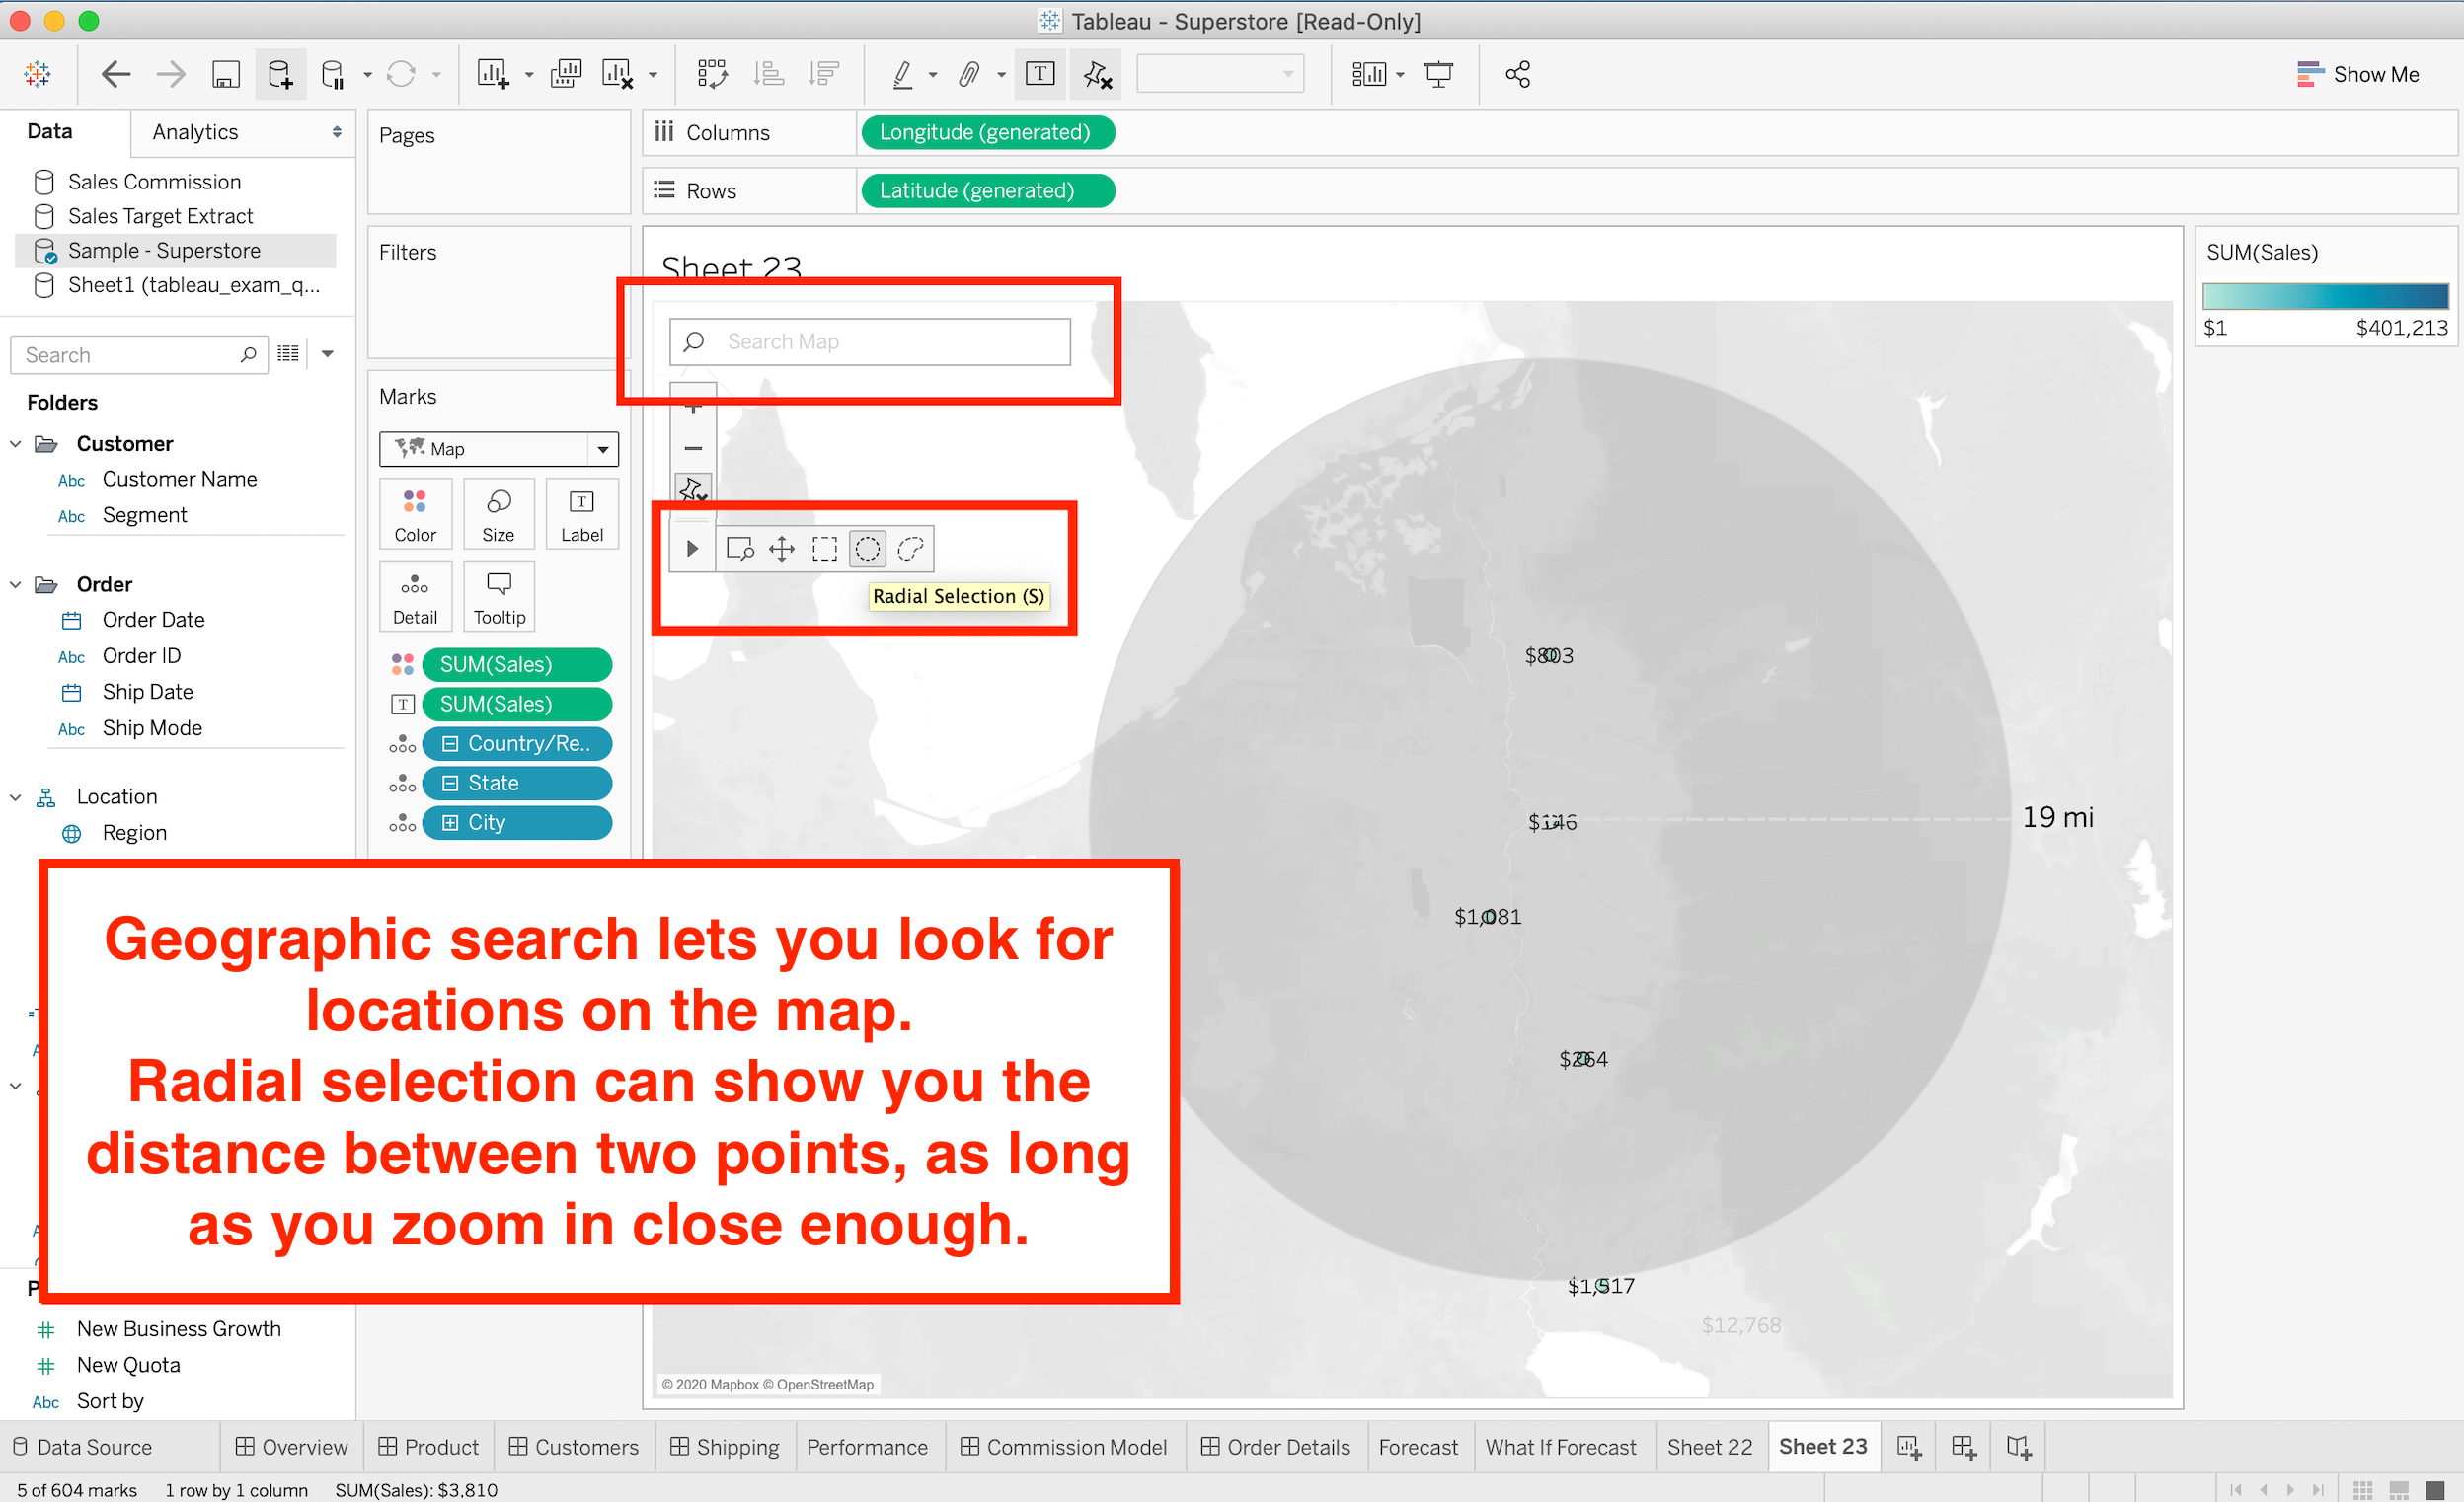
You can add more details to the map by selecting different “Map layering” options, which can add items like city labels, streets/highways/routes, state/province borders, and much more. If you need to search for a specific geographic item like a city or a state, you can use Tableau’s map search bar on the top left of the map view.
您可以通过选择不同的“ 地图分层 ”选项来向地图添加更多详细信息,这些选项可以添加诸如城市标签 , 街道/公路/路线 , 州/省边界等项目。 如果您需要搜索特定的地理项目(例如城市或州),则可以使用位于地图视图左上方的Tableau的地图搜索栏。

分析(15%) (Analytics (15%))
The analytics tab may seem intimidating, but as with the rest of its interface, Tableau makes statistics easy to understand and use in your visualizations.
“分析”选项卡似乎令人生畏,但与其他界面一样,Tableau使统计信息易于理解并在可视化中使用。
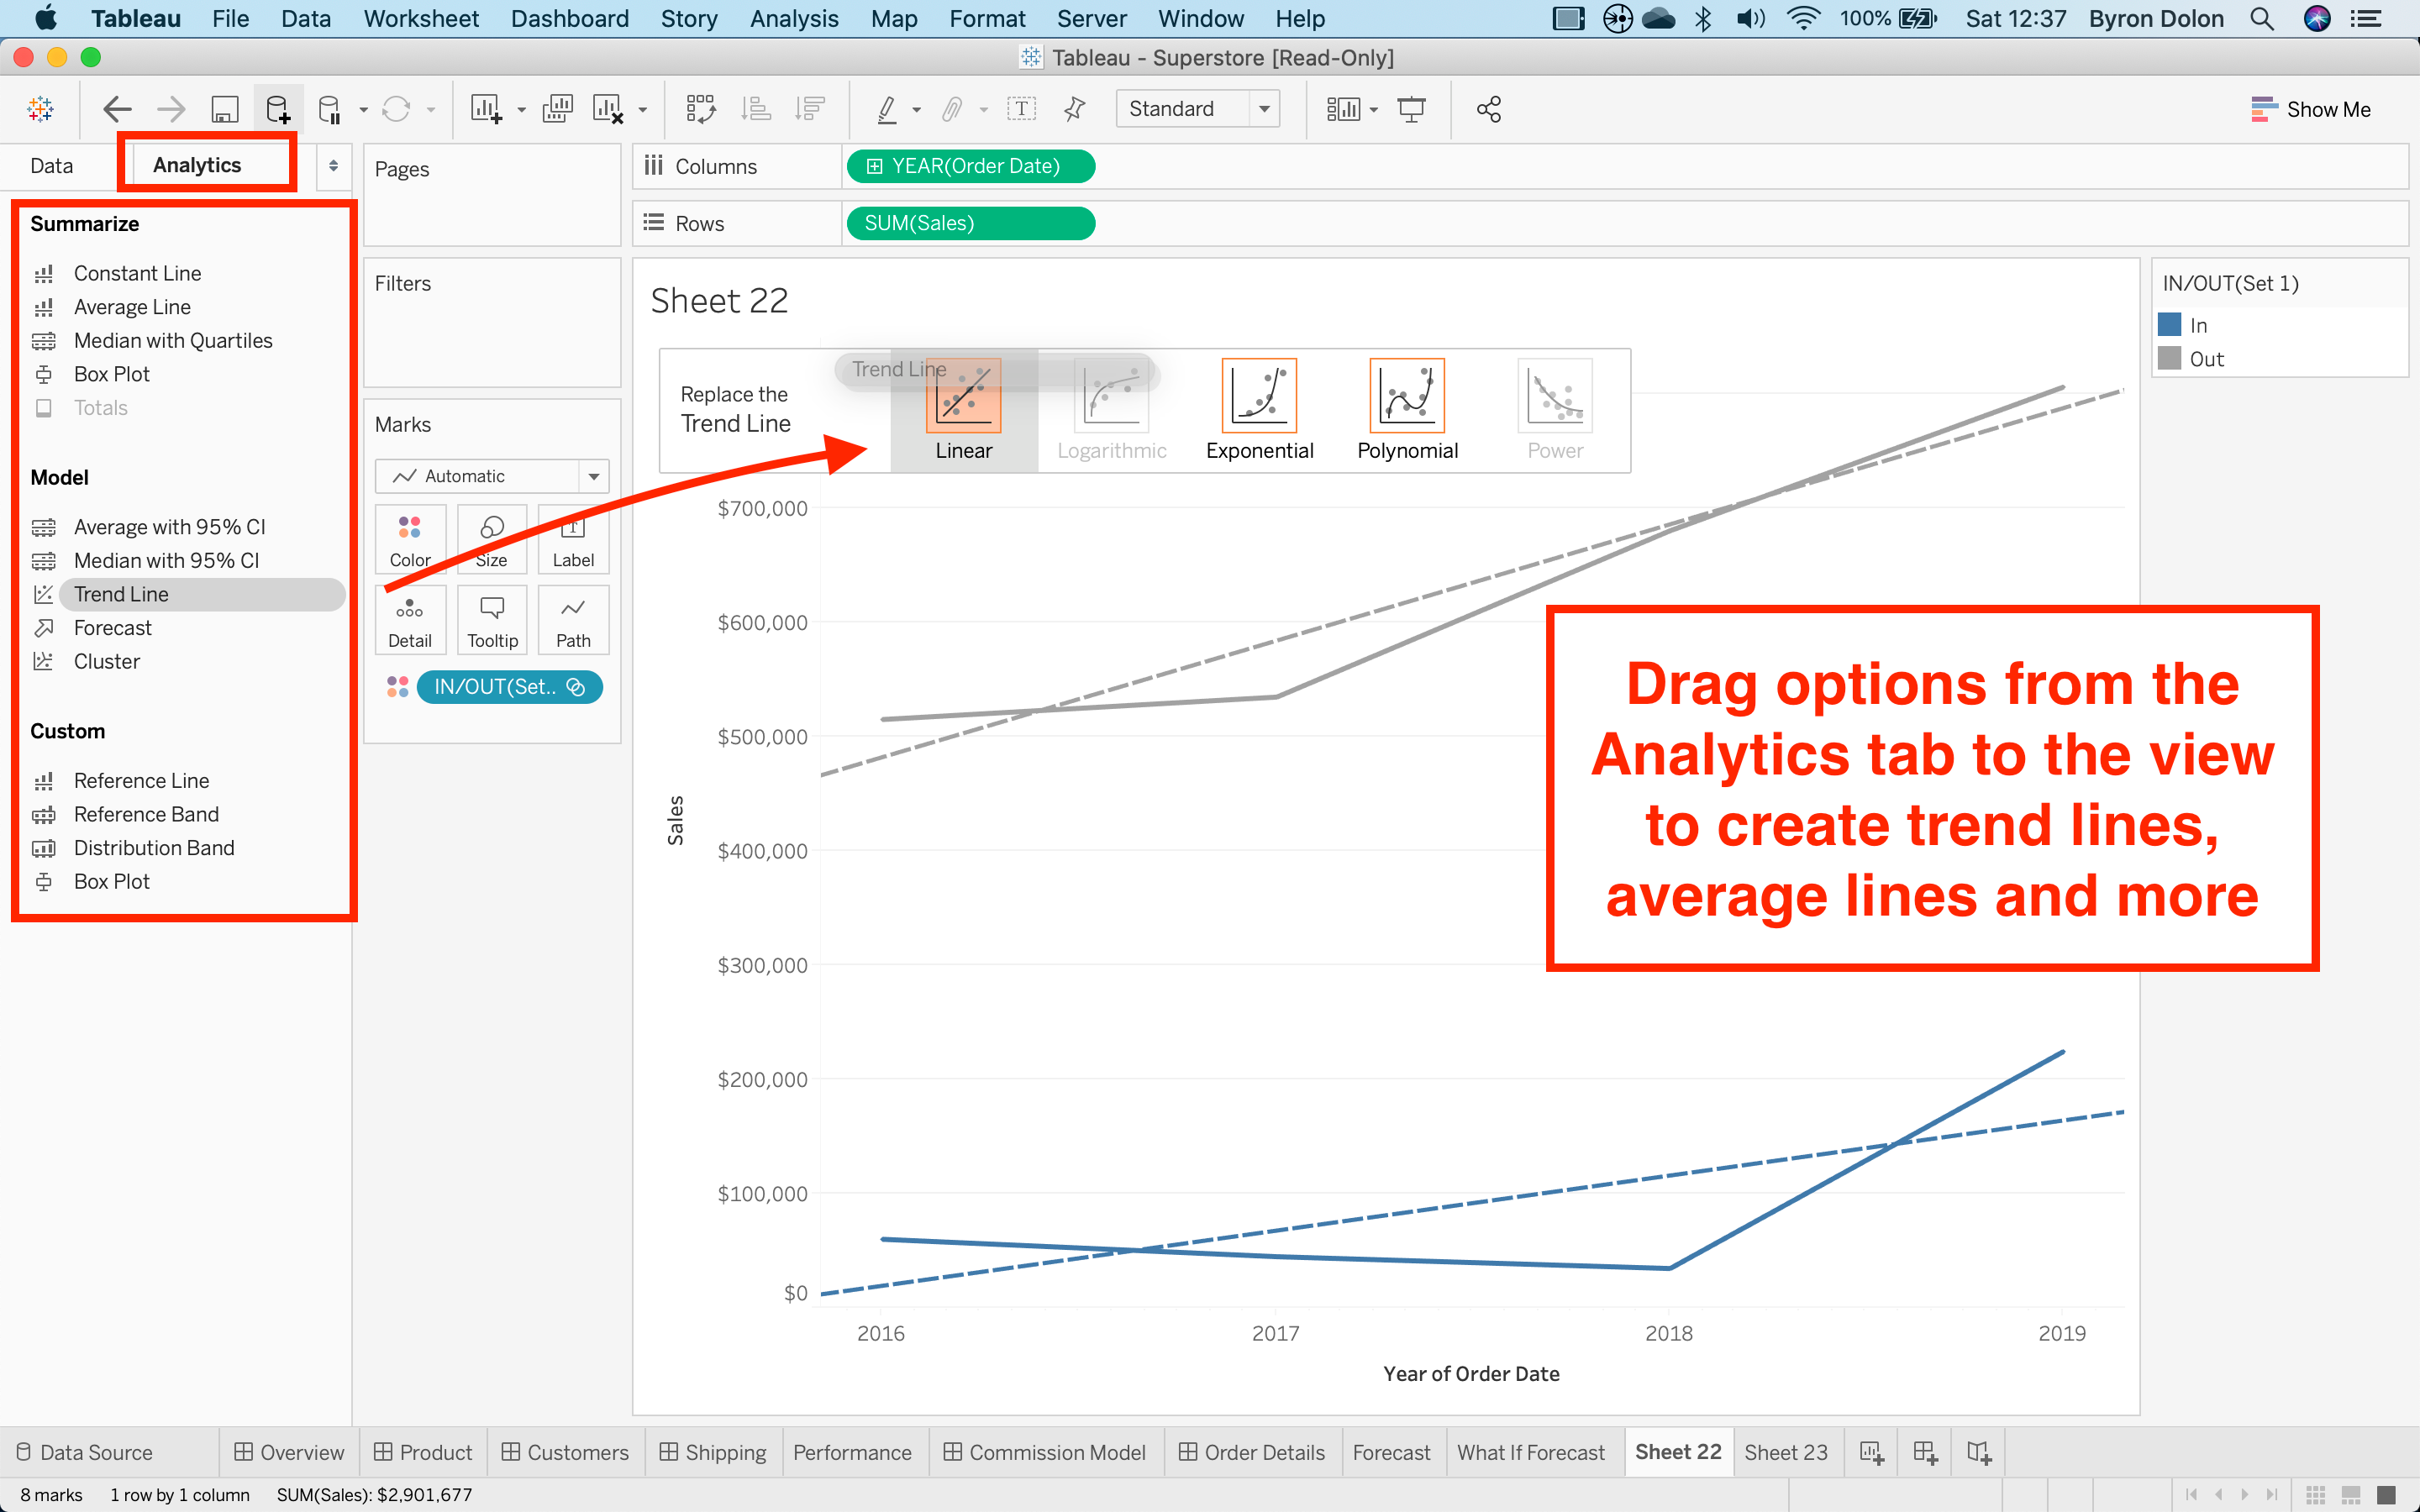
You can perform most of the analytics related skills by moving from the “Data” pane, which is the default, to the “Analytics” pane. Here, you’ll see options to “Summarize”, “Model”, or “Custom” analytics. For example, under “Model” you could drag “Trend Line” to the view, which would give you a choice of a linear, logarithmic, exponential, polynomial, or power trend line. It’s worth pointing out here that while it’s important to understand how these work, simply knowing what options are available (or checking which are available during the exam) can help you to quickly answer theory-based questions.
您可以通过从默认的“数据”窗格移至“ 分析 ”窗格来执行大多数与分析相关的技能。 在这里,您将看到“ 摘要 ”,“ 模型 ”或“ 自定义 ”分析的选项。 例如,在“ 模型 ”下,您可以将“ 趋势线 ”拖到视图中,这将为您提供线性 , 对数 , 指数 , 多项式或幂趋势线的选择。 这里值得指出的是,虽然了解这些工作原理很重要,但只要知道可用的选项(或检查考试中可用的选项)就可以帮助您快速回答基于理论的问题。
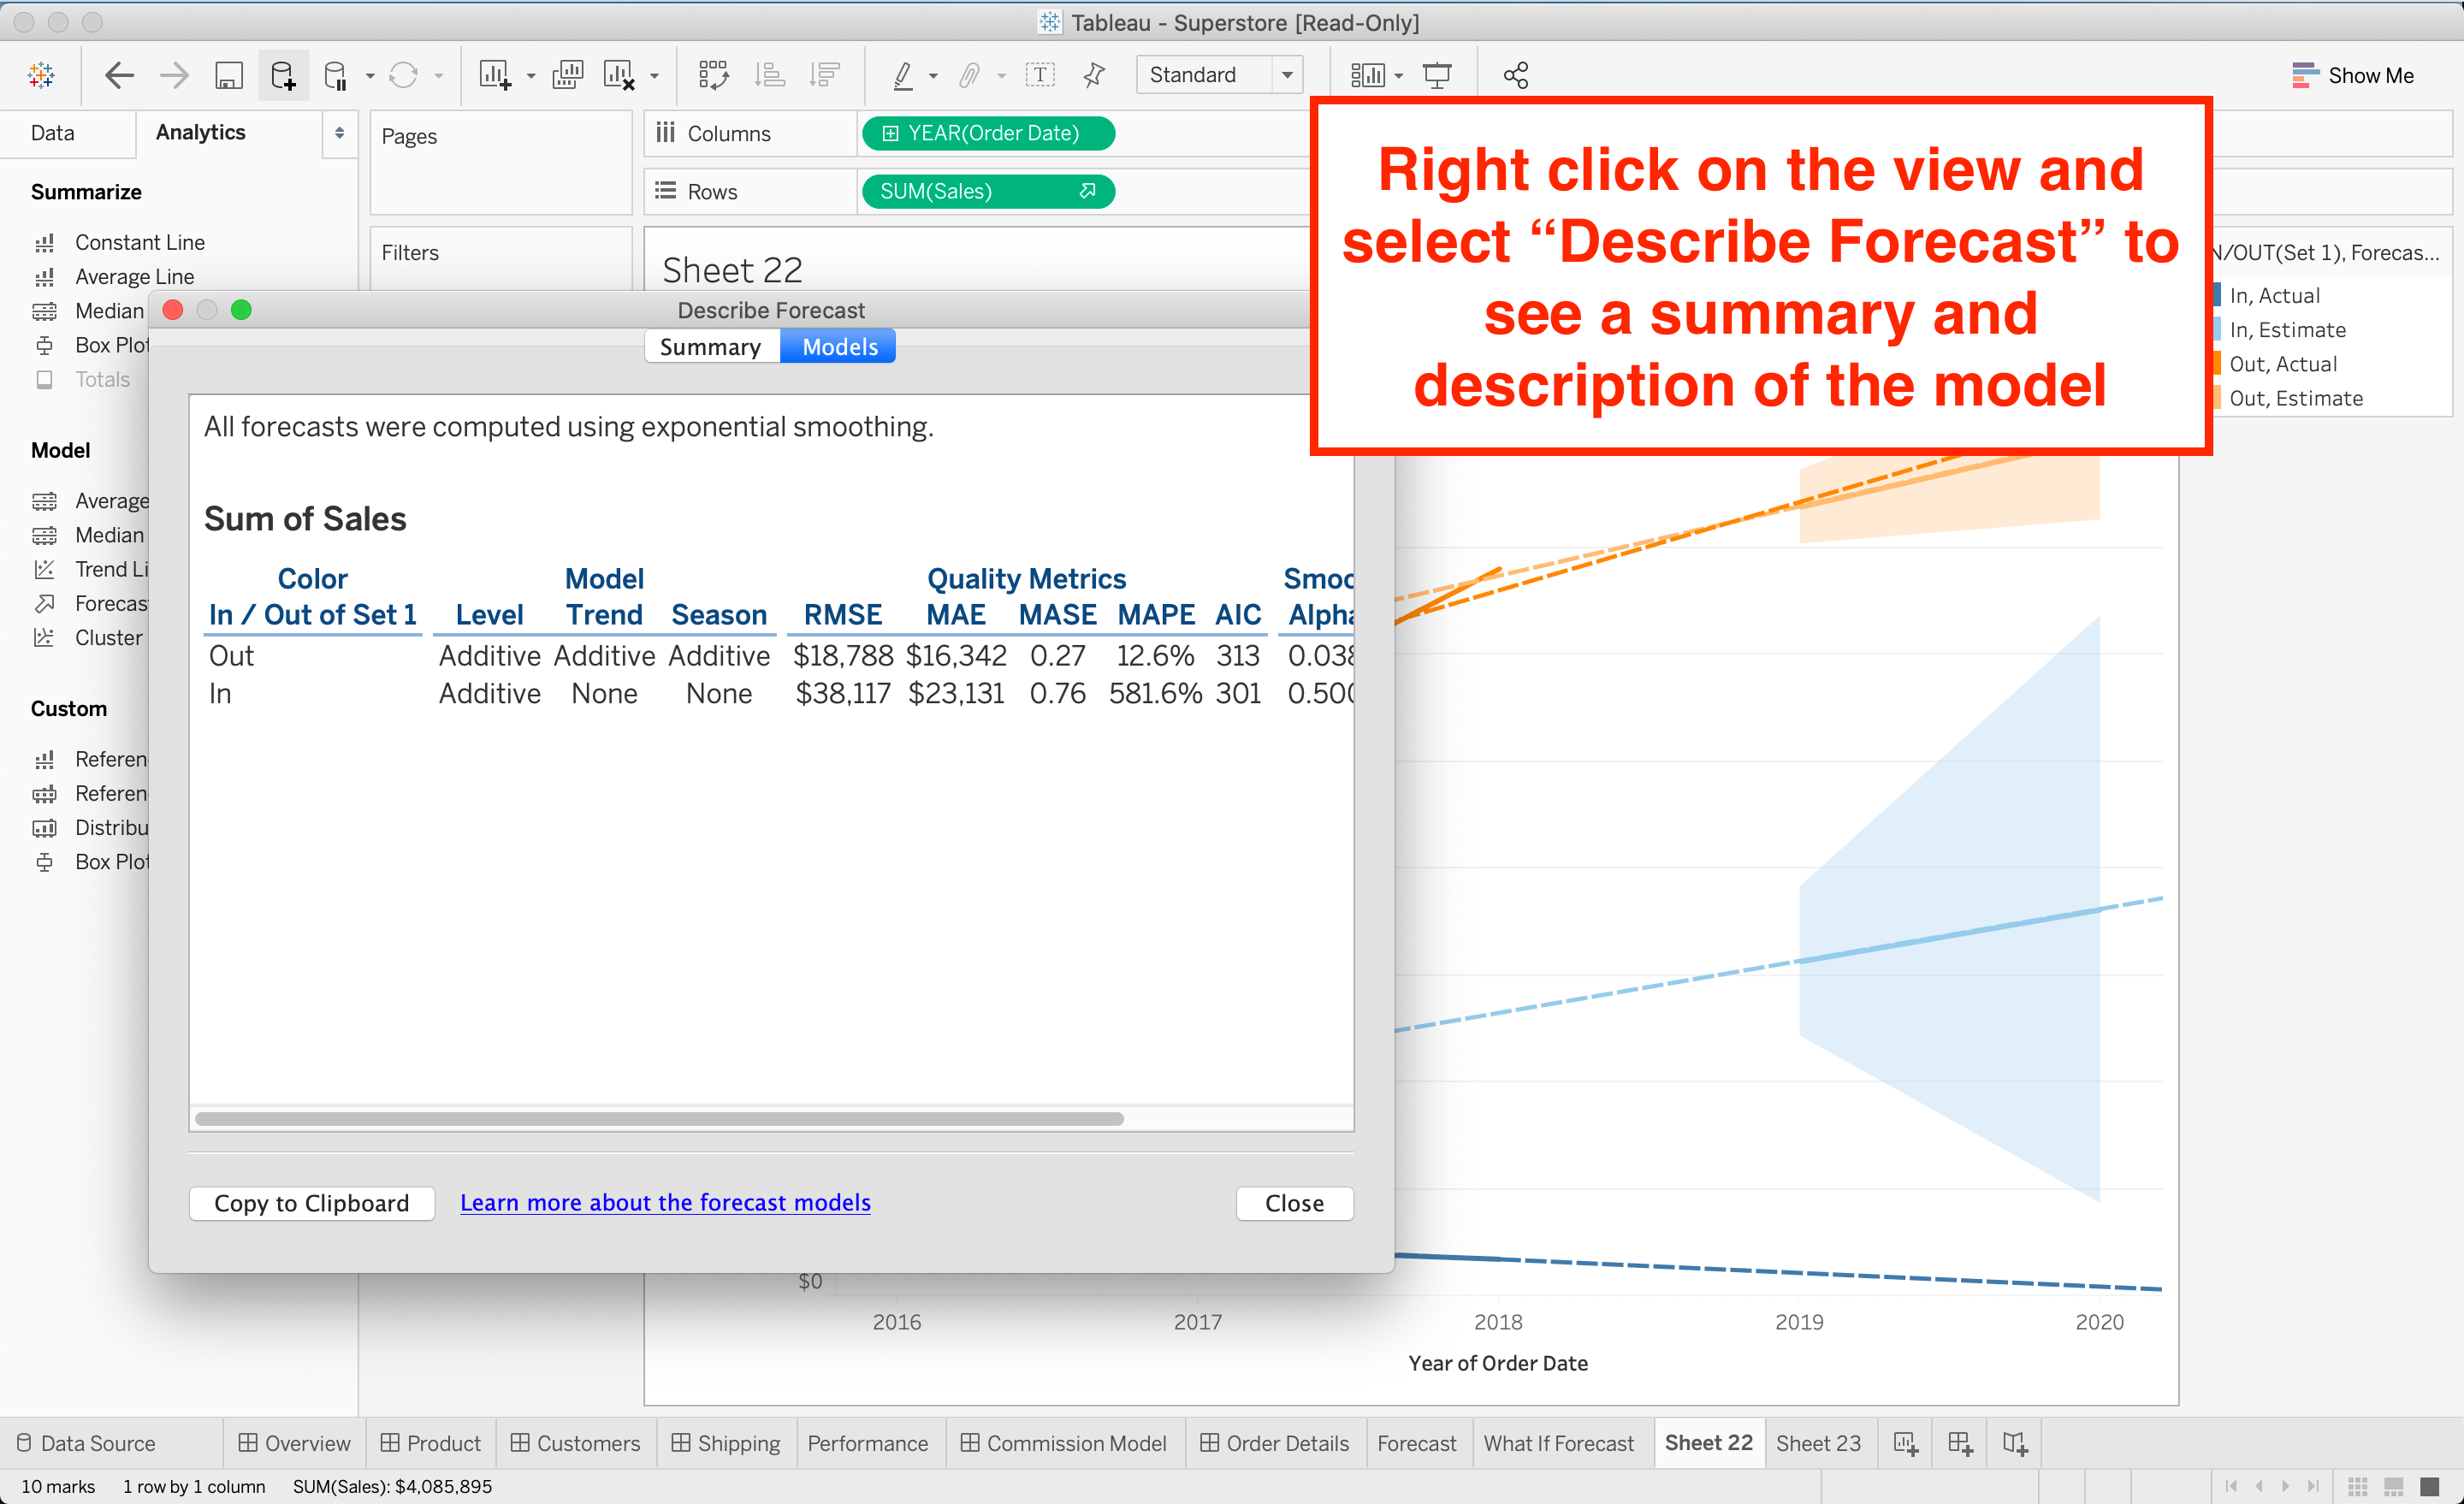
For this section, in addition to being able to create a view with visual analytics items, you should also take a look at each item’s components. For example, if you’re unfamiliar with box plots, take a look at what the difference is between the upper hinge and the upper whisker. Similarly, if you need to add a forecast to the view, remember that you can click “Describe Forecast” to take a closer look at the model.
对于此部分,除了能够使用可视化分析项目创建视图之外,您还应该查看每个项目的组件。 例如,如果您不熟悉箱形图,请查看上铰链和上晶须之间的区别。 同样,如果您需要向视图中添加预测,请记住,您可以单击“ 描述预测 ”来仔细查看模型。
资讯主页(12%) (Dashboards (12%))
Last but not least is manipulating dashboards!
最后但并非最不重要的是操纵仪表板!
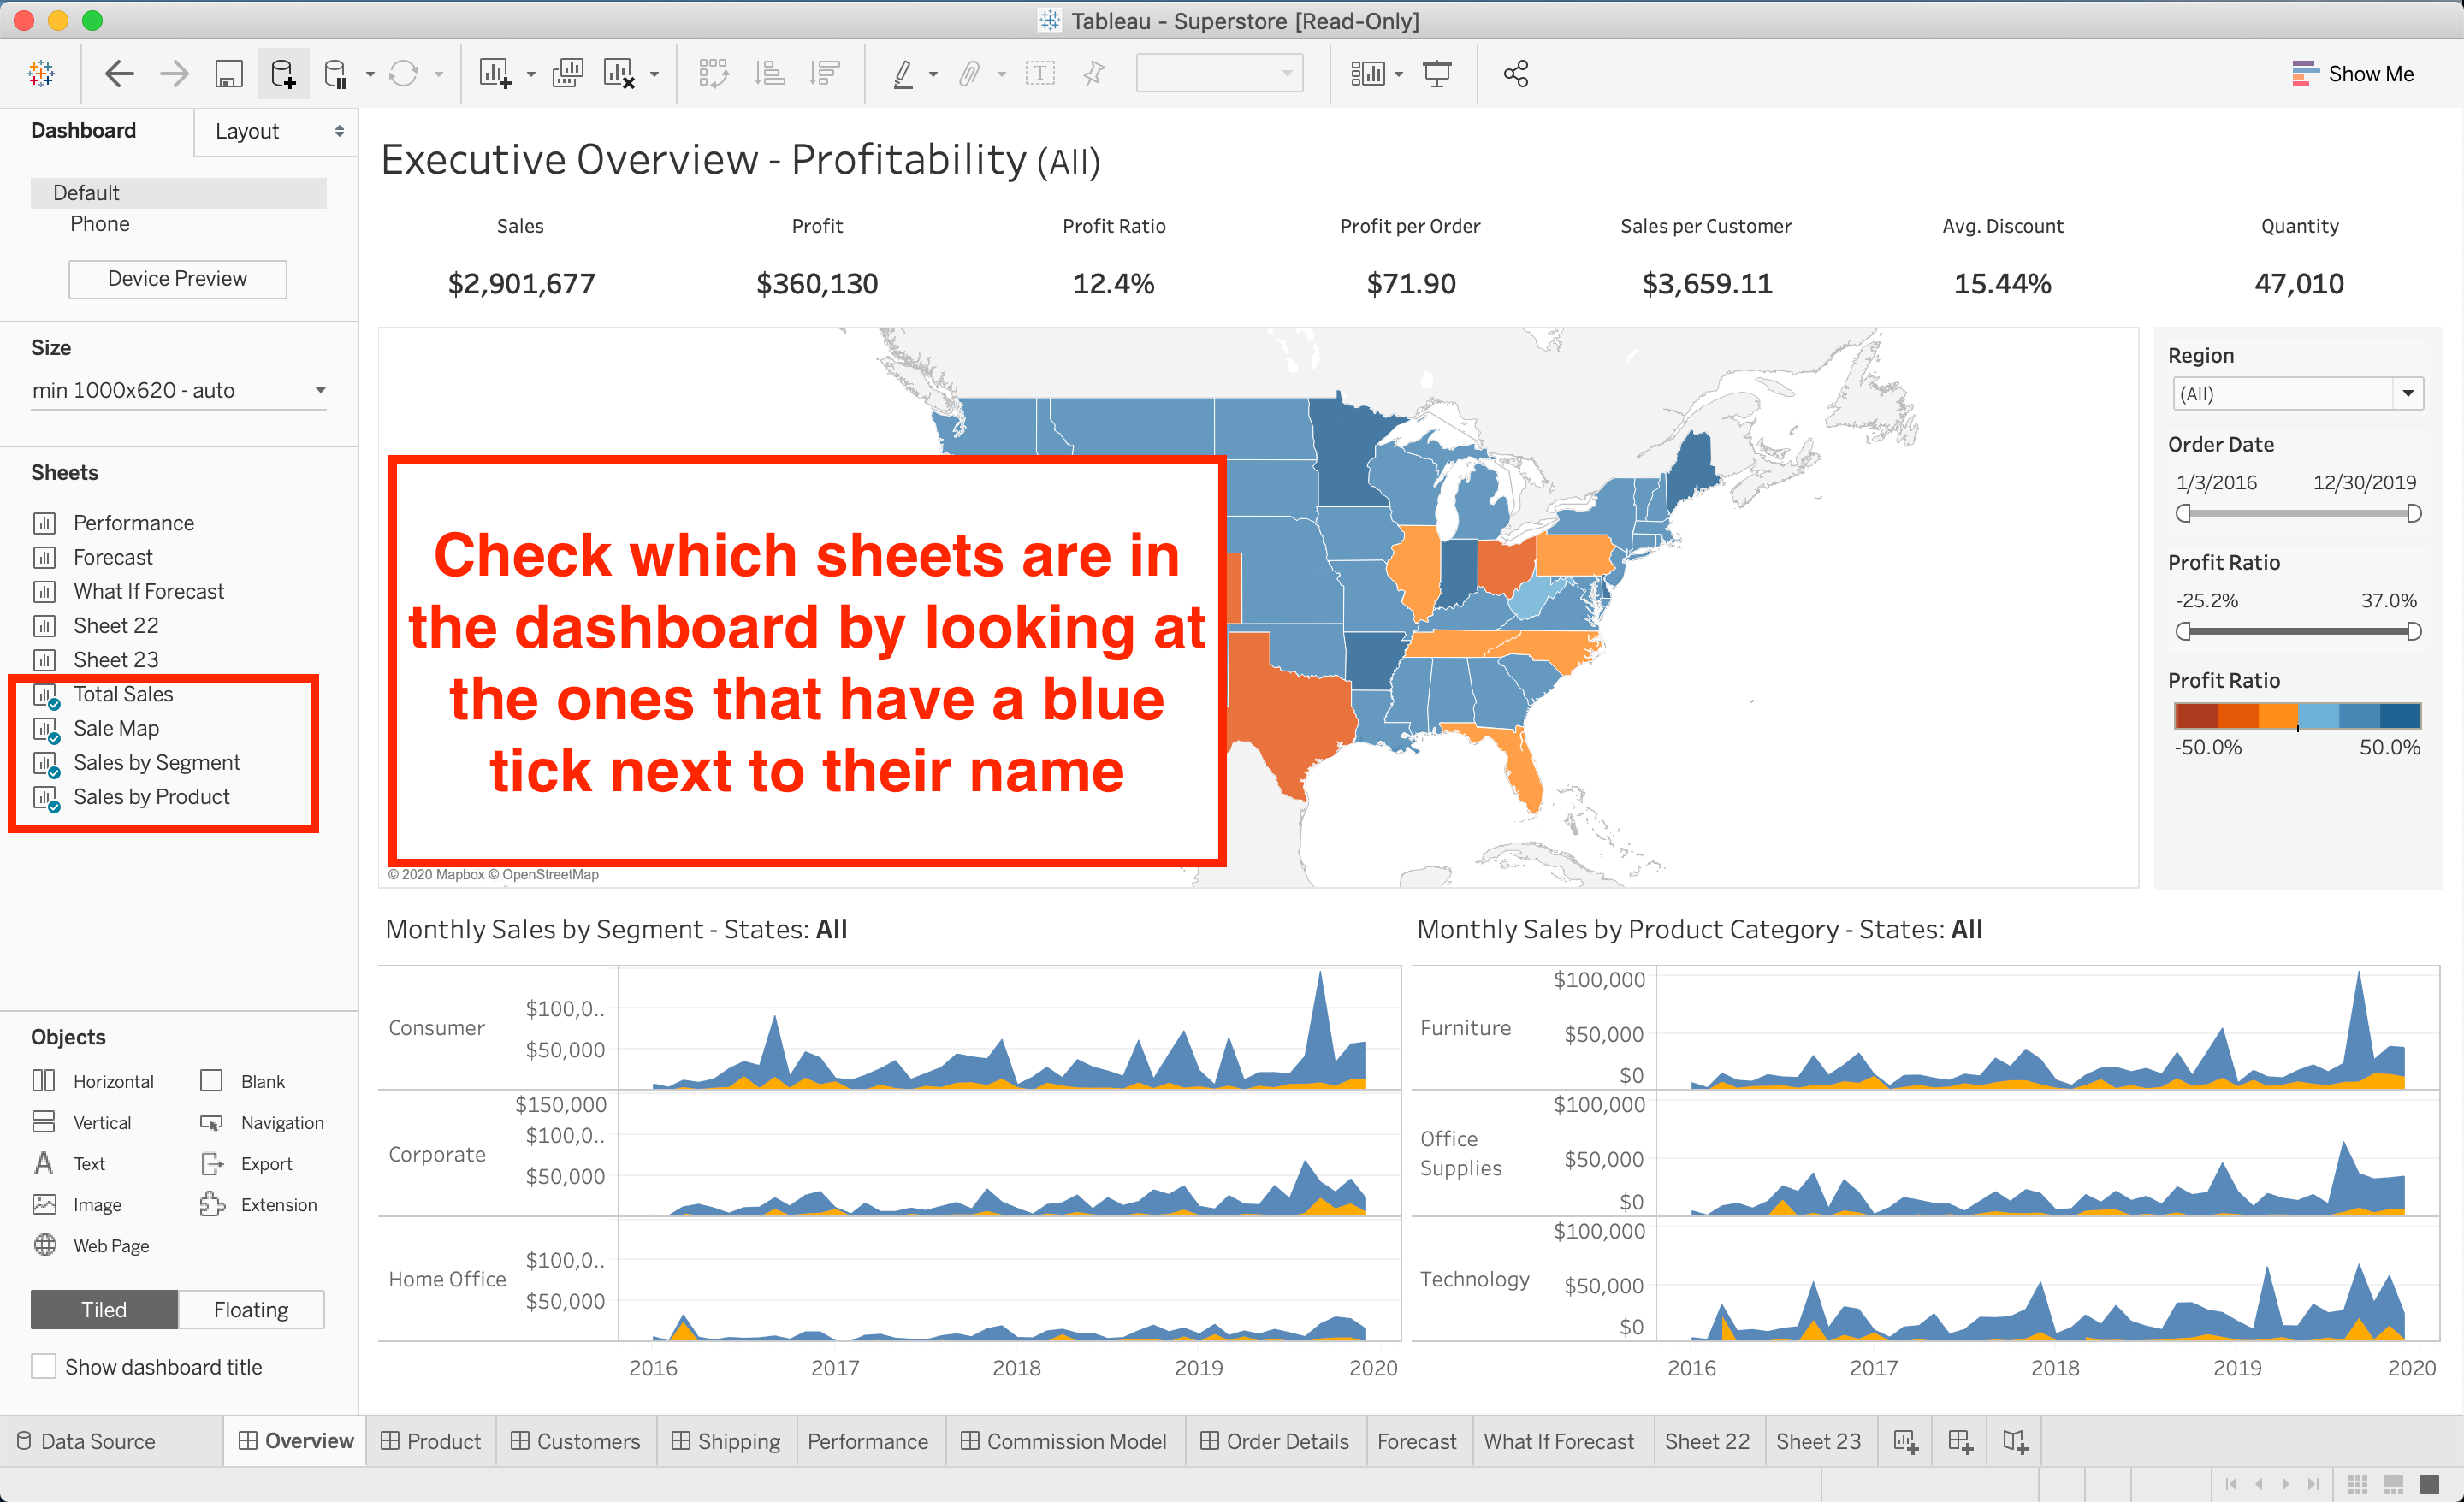
Dashboards are combinations of sheets that can be used to show a lot of information on just one page. As with every other section, the best way to understand how dashboards work is to create and interact with some yourself. Tableau’s sample Superstore workbook has a few well-designed dashboards you can take a look at to get started.
仪表板是工作表的组合,可用于在一页上显示很多信息。 与其他各节一样,了解仪表板如何工作的最佳方法是创建自己并与之交互。 Tableau的示例Superstore工作簿具有一些设计良好的仪表板,您可以查看这些仪表板以开始使用。
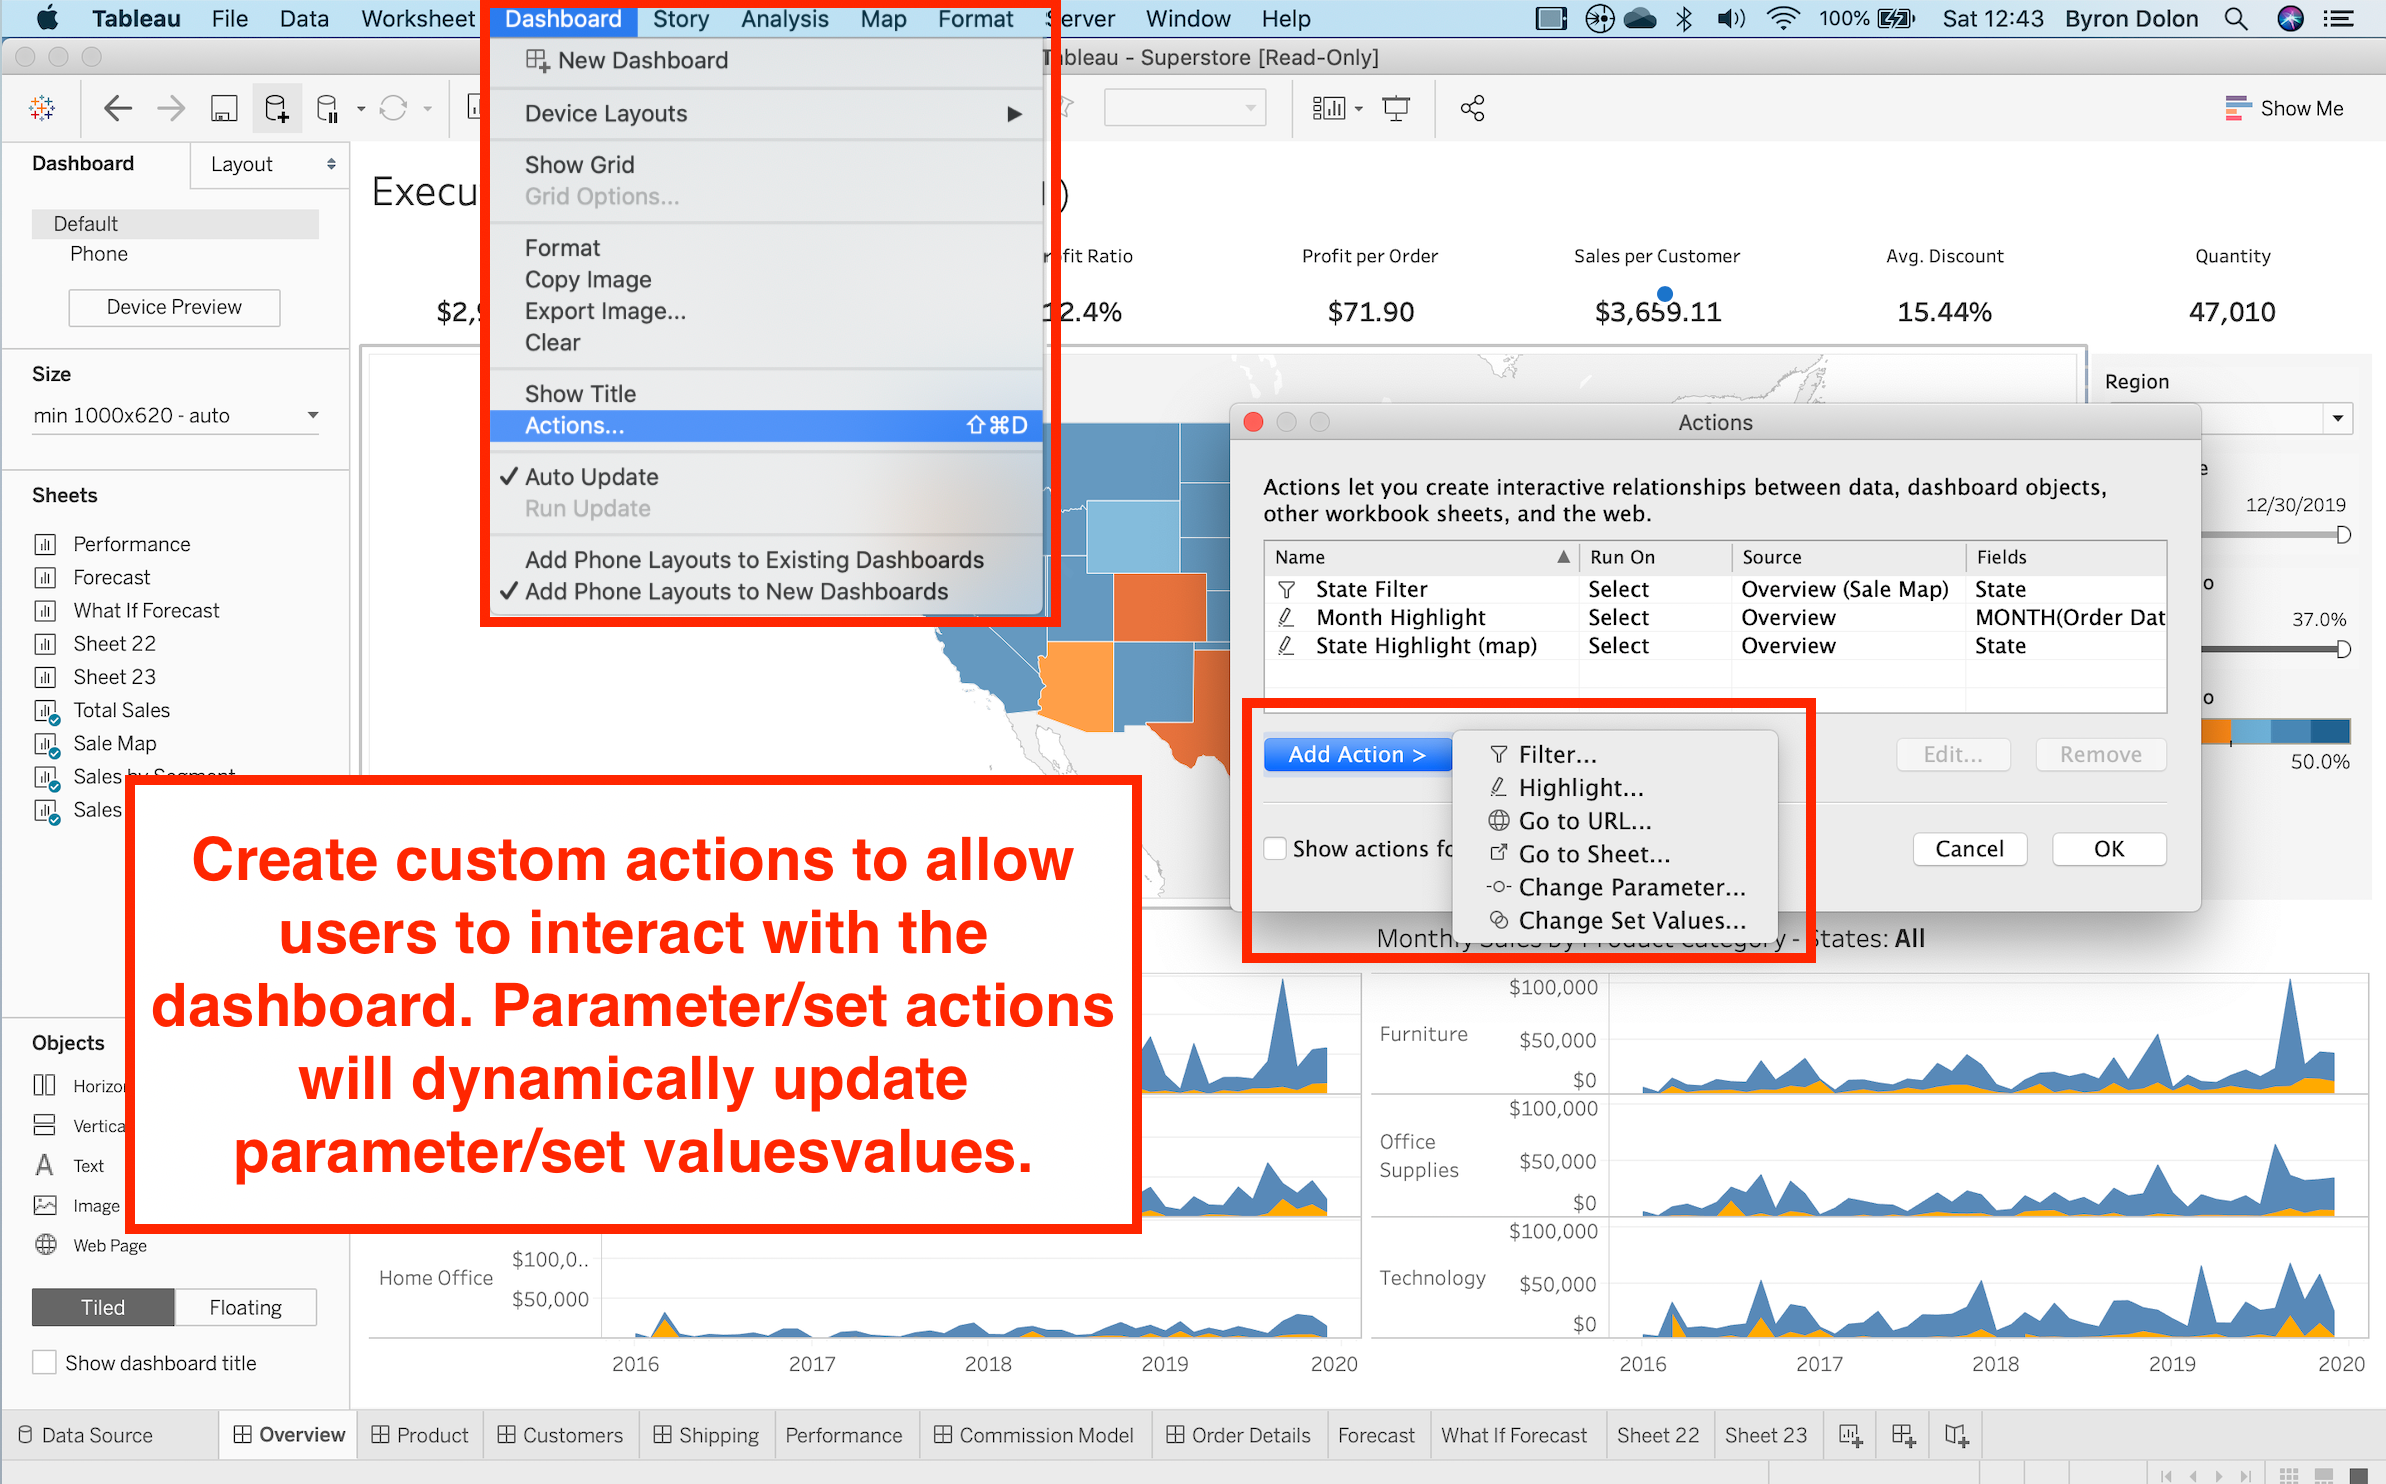
Knowing when and how to use the different types of “Dashboard actions” will serve you well. Filter and highlight actions are pretty quick to create and use. When you want to interact directly with a visualization and see dynamic updates based, you have the option to create parameter actions and set actions. These allow you to edit the parameter and set values respectively, which can be useful when you want to customize the data your visualization shows.
知道何时以及如何使用不同类型的“ 仪表盘操作 ”会很好地为您服务。 筛选和突出显示 操作非常容易创建和使用。 当您想直接与可视化交互并看到基于动态的更新时,可以选择创建参数动作和设置 动作 。 这些允许您分别编辑参数和设置值,这在您要自定义可视化显示的数据时很有用。
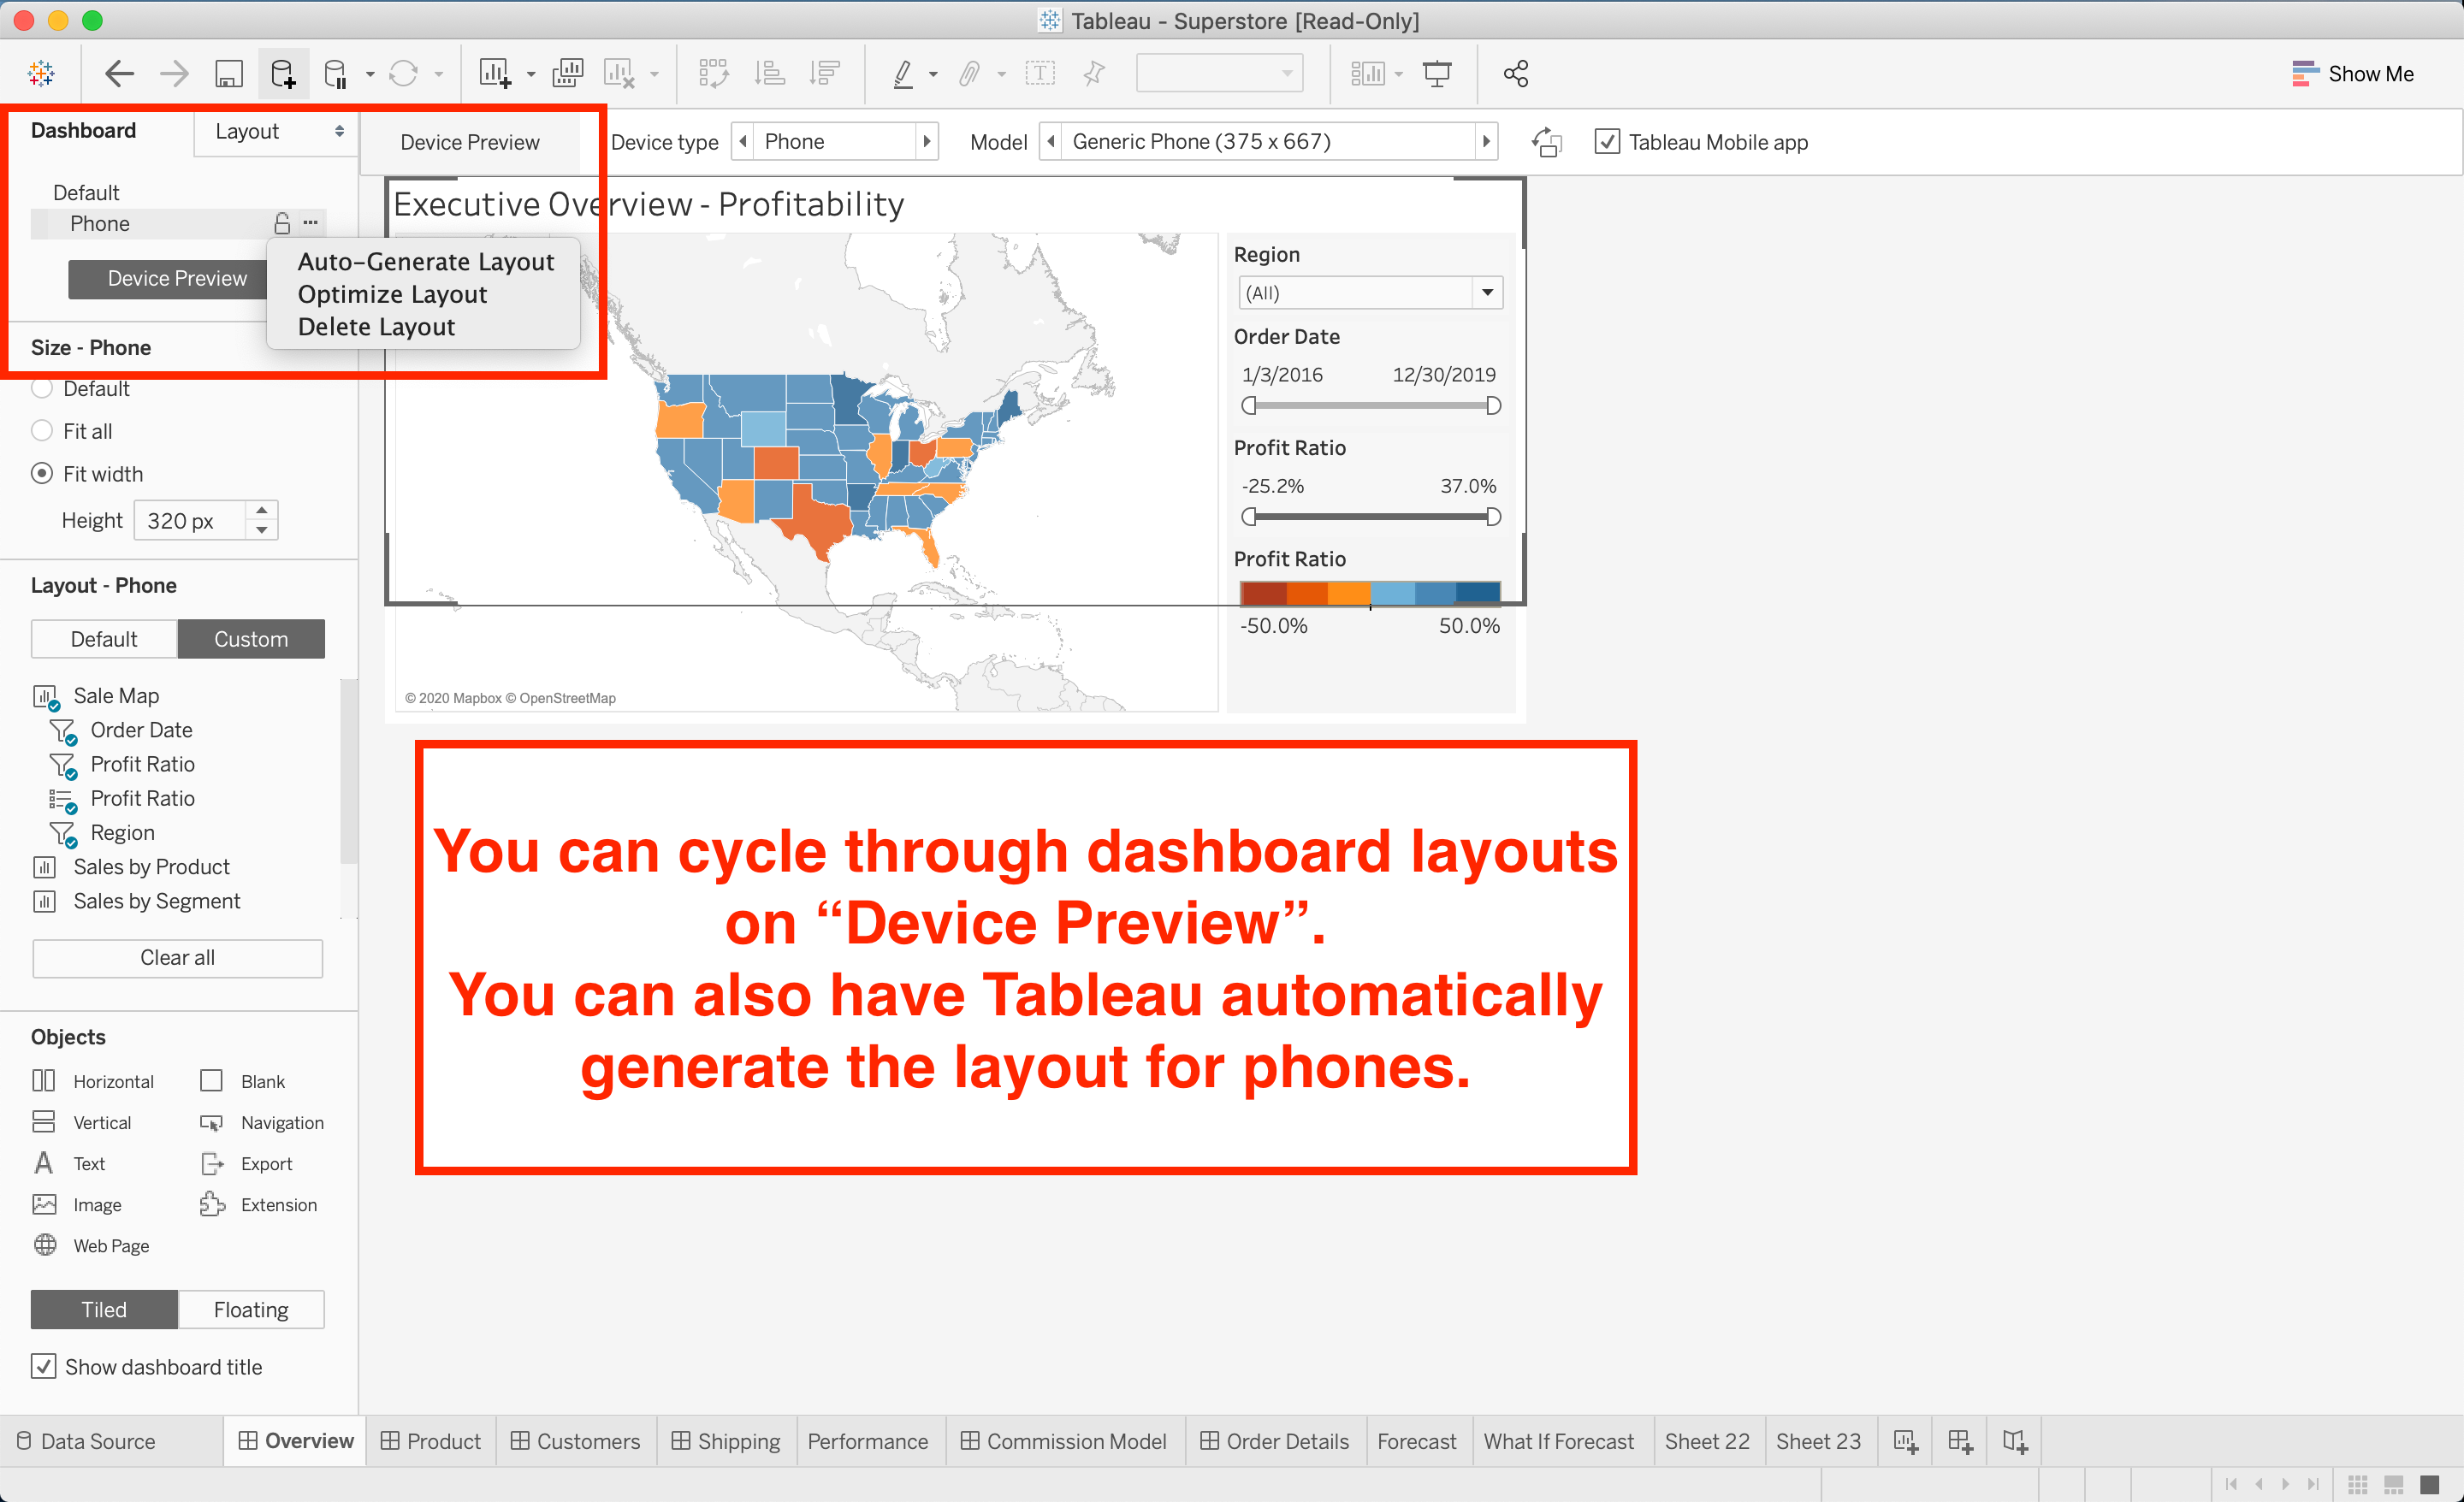
Another important segment is how you can create custom dashboard layouts for different devices. In addition to the default layout, Tableau lets you create layouts specifically for desktops, tablets, and mobile devices. You also have the option to auto-generate a layout for mobile devices.
另一个重要的部分是如何为不同的设备创建自定义的仪表板布局 。 除了默认布局外,Tableau还允许您创建专门用于台式机,平板电脑和移动设备的布局。 您还可以选择自动生成移动设备的布局 。
为考试当天做准备 (Preparing For the Day of the Exam)
Those were all the skill sections you’ll need for the exam. I tried to include as much as I could, but obviously I can’t go over every point in the exam guide in one piece. Make sure to review every skill in every section, because they could all potentially come up on the exam.
这些都是考试所需的所有技能部分。 我尝试了尽可能多地包括在内,但显然我不能一口气地涵盖考试指南中的每个要点。 确保复习每个部分中的每项技能,因为它们都可能会出现在考试中。
Now, let’s go through registering for the exam and what the exam day will look like.
现在,让我们完成考试的注册以及考试的日期。
Visit Tableau’s Desktop Certified Associate page and click “Register Now”. You’ll be redirected to their exam portal where you’ll be prompted to create an account, select which exam you want to take, and add your payment information. Once that’s done, you can set the date and time you want to take the exam, which must be within six months of your registration date.
访问Tableau的桌面认证助理页面,然后单击“立即注册”。 您将被重定向到他们的考试门户,系统将提示您创建一个帐户,选择您要参加的考试,并添加您的付款信息。 完成后,您可以设置要参加考试的日期和时间,该日期和时间必须在注册日期的六个月内。
There are a few things to remember on the day of the exam itself:
考试当天有几件事要记住:
Take and pass the internet connectivity test. They strongly suggest that you use a wired connection to avoid latency issues, but Wi-Fi should be as long as your connectivity results meet the minimum requirements. I used Wi-Fi and didn’t experience any issues (I also turned off all the Wi-Fi on my other devices before starting the exam).
参加并通过互联网连接测试。 他们强烈建议您使用有线连接来避免延迟问题,但是只要您的连接结果符合最低要求,Wi-Fi应该保持连接状态。 我使用了Wi-Fi,但没有遇到任何问题(在开始考试之前,我还关闭了其他设备上的所有Wi-Fi)。
Have a government-issued ID ready for verification. Your proctor will ask to see your ID before the exam begins.
准备由政府签发的ID以供验证。 监考人员会在考试开始之前要求您查看您的身份证。
Set up your testing environment. You must be a small, well-lit room free of papers, materials, and other gadgets. Your proctor will ask you to move your camera around so they can verify that your room is clear. I didn’t have a study room, so I took the test in my bedroom, but I’d highly recommend finding a nice room with an actual desk and chair (maybe go to a friend’s house). The test is two hours long, and it got incredibly hot and stuffy in my room as time went on, so make sure you get comfortable. You can have a water bottle with you, but also make sure that you don’t drink too much, as you can’t leave to use the bathroom once the exam starts.
设置您的测试环境。 您必须是一个光线充足的小房间,里面没有纸张,材料和其他小物件。 监理人会要求您移动摄像机,以便他们确认您的房间是否干净。 我没有自习室,所以我在卧室里参加了考试,但我强烈建议您找到一个带实际桌子和椅子的漂亮房间(也许去朋友家)。 测试时间为两个小时,随着时间的推移,它在我的房间里变得非常闷热,请确保您感到舒适。 您可以随身带一个水瓶,但也要确保不要喝太多,因为一旦考试开始就不能离开去洗手间。
Keep your cellphone handy for a call or email from the proctor if there are any connectivity issues before the exam. Once you’ve successfully connected, make sure you take your phone out of the room (your proctor will probably remind you to do this anyway).
如果考试前有任何连接问题,请将手机放在方便的地方,以方便督导员打个电话或发送电子邮件。 成功连接后,请确保将手机带出房间(您的监理员可能仍会提醒您执行此操作)。
Restart your computer and close all applications before the exam except for Google Chrome (which you use to log into the exam portal and start the exam).
重新启动计算机并关闭考试前的所有应用程序,但Google Chrome除外 (您可以使用Google Chrome登录到考试门户并开始考试)。
The test will take place on a virtual machine, which the proctor will help you connect to during the exam set-up. This is why your internet connection must be stable because if you disconnect from the virtual machine in the middle of the exam, you won’t get any extra time as you attempt to reconnect.
该测试将在虚拟机上进行 ,监理人将在考试过程中帮助您连接到该虚拟机 。 这就是您的Internet连接必须稳定的原因,因为如果在考试中途断开与虚拟机的连接,则尝试重新连接时将不会有任何额外的时间。
During the test, you can use the internet!
在测试期间,您可以使用互联网!
This can come in handy for theory questions, but you typically won’t be able to just type the question into Google. You’ll have access to most public sites, as long as they don’t require you to log in. In general, the “Tableau Help” and “Tableau Community Forum” pages were the ones I found the most useful. I’d suggest browsing through these pages to familiarize yourself with the keywords and layout.
这对于理论问题可能会派上用场,但是通常您不能仅将问题输入Google。 您可以访问大多数公共站点,只要它们不需要您登录即可。通常,“ Tableau帮助 ”和“ Tableau社区论坛 ”页面是我发现最有用的页面。 我建议浏览这些页面以熟悉关键字和布局。
If you at least know the headlines of each section or sub-topic, you’ll quickly know what to Google during the exam. For example, if you get a question on default dashboard layouts, you should know that Tableau Help has a “Create Dashboard Layouts for Different Device Types” section under “Create Dashboards”. You won’t necessarily have to memorize the contents of everything on the page (although it would be great if you had the time for that), but at least you’d know where the information was before the exam.
如果您至少知道每个部分或子主题的标题,那么您会很快知道考试期间对Google有什么帮助。 例如,如果您对默认仪表板布局有疑问,则应该知道Tableau帮助在“创建仪表板”下有一个“为不同设备类型创建仪表板布局”部分。 您不必一定要记住页面上所有内容的内容(尽管如果有时间的话,那会很棒),但是至少您会知道考试前的信息在哪里。
Something important to keep in mind is that the test is timed. You have two hours to complete it, so don’t spend too much time trying to search Google for an answer. If you’re really stuck, an alternative to searching online is connecting to any data source on Tableau and testing out whatever the question is asking. For example, if you’re asked whether a measure can be used as a filter and you don’t remember the answer, just open a new sheet, drag a measure to the filter pane, and see what happens.
要记住的重要一点是测试是定时的 。 您有两个小时的时间来完成它,所以不要花太多时间尝试在Google上寻找答案。 如果您确实遇到问题,可以使用在线搜索来替代Tableau上的任何数据源,然后测试出任何问题。 例如,如果系统询问您是否可以将某个度量用作过滤器,而您不记得答案,则只需打开一个新表,将一个度量拖到过滤器窗格中,然后看看会发生什么。
最终学习技巧 (A Few Final Study Tips)
To cap this piece off, I thought I’d end with some more general tips.
为了使本章内容不多,我想以一些更一般的技巧作为结尾。
As of August 2020, you will take the exam using Tableau version 2020.1. It’s important that you know which version of Tableau the exam is being conducted in, as features can change dramatically across new versions of Tableau. For example, Tableau has vastly simplified connecting to data in version 2020.2 with the introduction of “Relationships”, but this feature is not available in the version of Tableau for the exam. Keep an eye out on the official page for updates.
自2020年8月起,您将使用Tableau 2020.1版参加考试。 重要的是,您要知道要在哪个版本的Tableau中进行考试,因为新版本的Tableau中的功能可能会发生巨大变化。 例如,Tableau通过引入“关系”大大简化了2020.2版中的数据连接,但是此功能在Tableau版本中不适用于考试。 请留意官方页面上的更新。
Tableau looks (and is) very intuitive, so when you watch tutorial videos, it may seem like you’ll be able to replicate exactly what’s being shown. However, I found often that when I skipped through videos without following along, especially for more complicated topics like blended calculations and level of detail expressions, I couldn’t solve problems after the video ended. It helps to copy exactly what’s going on in a tutorial video, just so you can see the same results on your own screen. After that, you’ll have a model to follow for future questions.
Tableau看起来(并且非常直观),因此,当您观看教程视频时,似乎可以完全复制显示的内容。 但是,我经常发现,当我跳过视频而不关注时,尤其是对于更复杂的主题(例如混合计算和细节表达水平),视频结束后我无法解决问题。 它可以准确地复制教程视频中发生的事情,从而使您可以在自己的屏幕上看到相同的结果。 之后,您将有一个模型可以用来跟踪将来的问题。
My final general tip is to spend some time reviewing what you learned in the previous day at the start of the next day. It may seem time-consuming, especially as you learn more skills, but it’s worth it. Odds are you’ll spend anywhere from two weeks to a full month or more studying before the exam, so if you don’t spend time reviewing, you may not remember concepts from the first 10 days right before you take the exam.
我最后的一般提示是花一些时间在第二天的开始时回顾您在前一天中学到的知识。 这似乎很耗时,尤其是在您学习更多技能时,但这是值得的。 奇怪的是,您在考试前会花两个星期到一个月甚至一个月以上的时间,因此,如果您不花时间进行复习,您可能会不记得刚参加考试的前十天的概念。
For further studying, take a look at the Tableau Help pages. I know it’s dense, but all the information you need to pass the exam is in plain sight on those pages. Don’t forget to download the full exam guide on the Desktop Certified Associate page.
为了进一步研究,请查看Tableau帮助页面 。 我知道它很密集,但是通过这些考试的所有信息都清晰可见。 不要忘记在Desktop Certified Associate页面上下载完整的考试指南。
Good luck with studying for the exam! I can’t wait to see your names on the Certifiably Tableau Talent page!
祝考试学习好运! 我迫不及待想在Tableau Certifiable天才页面上看到您的名字!


 1649
1649

 被折叠的 条评论
为什么被折叠?
被折叠的 条评论
为什么被折叠?
 到【灌水乐园】发言


