


消费者行为分析
什么是消费者行为? (What is Consumer Behavior?)
消费者行为是对个人,团体或组织以及与购买,使用和处置商品和服务相关的所有活动的研究,以及消费者的情感,态度和偏好如何影响购买行为。
什么影响消费者行为? (What affects consumer behavior?)
Making decisions are very dynamic processing and a lot of things could affect consumer behavior. Analyzing consumer behavior data are allowed us to present products or services in a way that generates a maximum impact on consumers. Consumer behavior is often influenced by different factors such as:
决策是非常动态的处理,很多事情都会影响消费者的行为。 分析消费者行为数据使我们能够以对消费者产生最大影响的方式展示产品或服务。 消费者行为通常受不同因素的影响,例如:
- Personal factors: a specific characteristic such as age, race, gender, culture, income, personal habit/interest, etc 个人因素:特定特征,例如年龄,种族,性别,文化,收入,个人习惯/兴趣等
- Psychological factors: an individual’s response to a marketing message will depend on their perceptions and attitudes. 心理因素:个人对营销信息的React将取决于他们的看法和态度。
- Company Website: web design, products’ reviews from other users, recommendation System 公司网站:网页设计,其他用户的产品评论,推荐系统
- Company’s physical store service 公司的实体店服务
- Social: Policy, Government, Economy, Competitors, World of mouth, Friends, and Family, etc 社会:政策,政府,经济,竞争对手,口碑,朋友和家人等
- Advertising: Email, Mail, Magazine, Cookie, Social Media, Affiliate(Cashback Website), Partnership (Events like NBA, World Cup, TV Shows) 广告:电子邮件,邮件,杂志,Cookie,社交媒体,会员(现金返还网站),合作伙伴关系(NBA,世界杯,电视节目之类的活动)
为什么消费者行为数据很重要? (Why Consumer Behavior data is important?)
Understanding consumer behavior is a vital aspect of marketing. Based on consumer behavior data, we are able to know how consumers make decisions and how potential customers will respond to new products or new services. It is important to explore actionable insights from the data to support companies to put forward corresponding strategies.
了解消费者行为是营销的重要方面。 根据消费者行为数据,我们能够知道消费者如何做出决策以及潜在客户将如何响应新产品或新服务。 重要的是,从数据中探索可行的见解,以支持公司提出相应的策略。
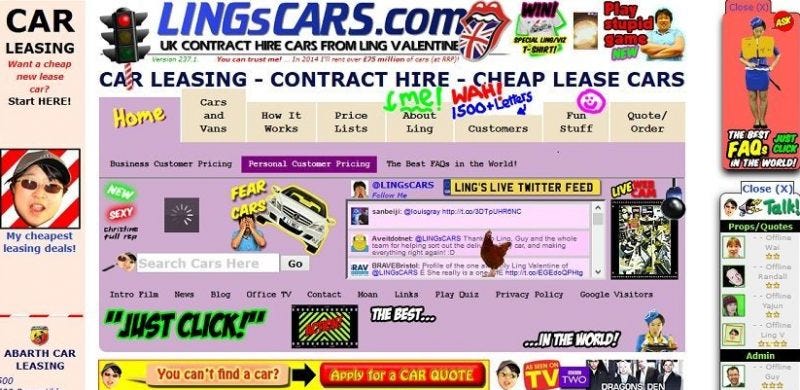
For example, if you visit this kind of website, you do not know where should you start with and you will lose your patient then you will want to leave this website immediately. That is why we do the tests (such as AB test, usability test, etc) to gain insights into customer behavior in order to optimize the customer journey and improve key KPIs — Conversion Rate, Revenue, Customer Life Time Value, and AOV (Average Order Value).
例如,如果您访问这种网站,则不知道从哪里开始,您会失去耐心,那么您将希望立即离开该网站。 这就是为什么我们进行测试(例如AB测试,可用性测试等)以深入了解客户行为,从而优化客户旅程并改善关键KPI(转化率,收入,客户生命周期价值和AOV(平均))的原因订单价值)。
A good and nice e-commerce website can greatly affect consumer behavior.
一个好的电子商务网站可以极大地影响消费者的行为。
行为经济学的视角 (The Perspective of Behavioral Economics)
Behavioral Economics is the study of psychology as it relates to the economic decision-making processes of individuals and institutions. It could be combined with consumer behavior to study how people make decisions and how to affect people to make decisions with ‘invisible hands’.
行为经济学是对心理学的研究,因为它涉及个人和机构的经济决策过程。 它可以与消费者行为相结合,研究人们如何做出决策以及如何影响人们用“看不见的手”做出决策。
Dan Ariely is an Israeli-American professor of psychology and behavioral economics at Duke University. He mainly studies the role of human psychological phenomena in economics and how to use human psychological phenomena to influence people’s economic behavior. There are some classical examples to show how to influence consumers’ behavior.
丹·阿里利(Dan Ariely)是杜克大学(Duke University)的一名美籍美国裔心理学和行为经济学教授。 他主要研究人类心理现象在经济学中的作用以及如何利用人类心理现象影响人们的经济行为。 有一些经典的例子来说明如何影响消费者的行为。
1st example: When you apply for driver’s license at DMV you can see there is a part in your application to show if you wish to donate your organs and tissues after declared death. Dan Ariely did research about the ratio of the people who are willing to donate their organs in European countries and here is the bar chart for the result.
1日例如:当你在DMV申请驾驶证,你可以看到有在应用程序中显示的一部分,如果你想宣布死后捐出你的器官和组织。 丹·阿里利(Dan Ariely)研究了愿意在欧洲国家捐献器官的人口比例,这是得出结果的条形图。

The first four countries' situations are very different from the remaining countries. You might think those differences due to cultural and religious reasons, however, the cultures and religions of some countries are very similar. After research, he finally found that the biggest difference between those countries is the DMV application designs.
前四个国家的情况与其余国家大不相同。 您可能会认为这些差异是由于文化和宗教原因造成的,但是某些国家的文化和宗教非常相似。 经过研究,他最终发现这两个国家之间最大的不同是DMV应用程序设计。
- design1 - Countries with low ratio: “If you wish to donate your organs and tissue, please sign here…” design1-比率较低的国家:“如果您想捐献器官和组织,请在此处签名……”
- design2 -Countries with high ratio: “If you do not wish to donate your organs and tissue, please sign here…” design2-高比率国家:“如果您不希望捐赠器官和组织,请在此处签名……”
As long as people notice that there is something relative to “organ donation”, by the “default” most people will not sign for design 1 or design 2. So the people’s decision was affected by the different designs of organ donation consent. This is a kind of dependence on the default options because it does not give people psychological pressure.
只要人们注意到与“器官捐赠”有关的事情, 默认情况下,大多数人就不会签署外观设计1或外观设计2的签名。因此,人们的决定会受到不同形式的器官捐赠同意设计的影响。 这是对默认选项的一种依赖,因为它不会给人们带来心理压力。
2nd example: If one brand always offers a “big sale” promotion, most consumers will think that the real price is cheaper than the after-sale price and might also think “low price = low quality”. On the other hand, another expensive brand rarely offers discounts. If there is a big sale of this brand, most consumers are more likely to purchase and maybe buy some products that they might not really need.
第二例子:如果一个品牌总是提供了一个“大甩卖”的促销活动,大多数消费者会认为真正的价格比售后价格更便宜,也可能会想“低价格=低品质”。 另一方面,另一个昂贵的品牌很少提供折扣。 如果该品牌的销售量很大,那么大多数消费者更有可能购买甚至购买一些他们可能真正不需要的产品。

3rd example: There is a traveling advertisement which is for a 7-DAY tour for Rome or Paris. People have two equal options — $1800 includes the fees of hotels and meals for both different cities. The number of people who chose Roma is similar to that of people who chose Paris.
第三例子:有一个移动广告是一个7日游罗马或巴黎。 人们有两个平等的选择-1800美元包括两个城市的酒店和伙食费。 选择罗姆人的人数与选择巴黎人的人数相似。

After a new option was added — ‘Rome: Hotel+No Meal — $1800’, most people chose to go to Rome with the “Hotel+Meal”. Actually adding the “Hotel+No Meal” option is meaningless and obviously not a lot of people will choose it. However, the purpose of the new option is to influence people’s decisions.
在增加了一个新选项“罗马:酒店+无餐-1800美元”之后,大多数人选择了带“酒店+餐”的罗马。 实际上,添加“酒店+无餐”选项是没有意义的,并且显然不会有很多人会选择它。 但是,新选项的目的是影响人们的决策。

There is an interesting hidden theory behind those examples- Game Theory! Game Theory is a study of strategic interaction among rational decision-makers using mathematical models. If we are able to understand and analyze Consumer Behavior with Behavioral Economics/Game Theory, we can predict people’s behavior and their expectation, and then we can put forward targeted strategies that can affect consumer’s decisions and maximize their’s utility. If you are interested in Game Theory, you can visit my previous blog.
这些示例背后有一个有趣的隐藏理论,即博弈论! 博弈论是使用数学模型研究理性决策者之间的战略互动。 如果我们能够使用行为经济学/博弈论来理解和分析消费者行为,那么我们就可以预测人们的行为及其期望,然后我们可以提出有针对性的策略来影响消费者的决策并最大化他们的效用。 如果您对博弈论感兴趣,可以访问我以前的博客 。
项目介绍 (Project Introduction)
The goal of this project is to predict what kind of consumers are more likely to click the ad.
该项目的目的是预测哪种类型的消费者更有可能点击广告。
The dataset created by Jose Portilla and Pierian Data for his Udemy Course (Python for Data Science and Machine Learning Bootcamp). You can get the data from Kaggle. The data contains ten different columns:
Jose Portilla和Pierian Data为他的Udemy课程(Python for Data Science and Machine Learning Bootcamp)创建的数据集。 您可以从Kaggle获取数据。 数据包含十个不同的列:
- Daily Time Spent on a Site — Time spent by the user on a site in minutes. 网站上花费的每日时间-用户在网站上花费的时间,以分钟为单位。
- Age — Customer’s age in terms of years. 年龄-客户的年龄(以年为单位)。
- Area Income — Average income of geographical area of consumer. 地区收入-消费者地理区域的平均收入。
- Daily Internet Usage — Avgerage minutes in a day consumer is on the internet. 每天的互联网使用情况-一天的平均消费分钟数是在互联网上。
- Ad Topic Line — Headline of the advertisement. 广告主题行-广告标题。
- City — City of the consumer. 城市-消费者的城市。
- Male — Whether or not a consumer was male. 男性-消费者是否为男性。
- Country — Country of the consumer. 国家-消费者所在的国家。
- Timestamp — Time at which the user clicked on an Ad or the closed window. 时间戳记-用户单击广告或关闭的窗口的时间。
- Clicked on Ad — 0 or 1 is indicated clicking on an Ad or not — Class 0 — not clicked, and Class 1 — clicked. 单击广告-0或1表示是否单击广告-0级-未单击,1级-已单击。
EDA (EDA)
数值数据与目标 (Numerical Data VS Target)
Based on the image below, we can see that people who spend more time — around 80 minutes on the site are not likely to click the ad, and people who spend around 50 minutes are more likely to click the ad. The average age of the people who clicked the ad is around 40 and the average area income of consumers in class 1 is around 50000. Last, consumers in Class 1 have less daily internet usage. Those subplots are very informative and bring us some basic ideas. Besides numerical data, text data can also bring some useful information. For example, what kind of headline or topic of the ad is more attractive and consumers are more likely to click it.
根据下图,我们可以看到花费更多时间的用户-在网站上花费大约80分钟的时间不太可能点击广告,而花费大约50分钟的用户则更有可能点击广告。 点击广告的人的平均年龄为40岁左右,类别1的消费者的平均地区收入约为50000。最后,类别1的消费者的每日互联网使用量较少。 这些子图非常有用,为我们带来了一些基本思想。 除了数字数据,文本数据还可以带来一些有用的信息。 例如,哪种类型的广告标题或主题更具吸引力,而消费者更有可能点击它。

文字数据 (Text Data)
People prefer topics like team-oriented, fully configurable, and context-sensitive, etc. We also can see that some topics that consumers do not really interest in.
人们更喜欢面向团队的主题,完全可配置的和上下文相关的主题等。我们还可以看到,一些消费者并不真正感兴趣的主题。

相关性 (Correlations)
People aged around 40 who spend less than 80 minutes are more likely to click the ad. In Class 1, the mean age is around 40, and the daily internet usage range is between 100–200.
40岁左右,花费时间不到80分钟的用户更有可能点击该广告。 在第1类中,平均年龄约为40岁,每天的互联网使用范围为100-200。

造型 (Modeling)
Random Forest was applied in this project. After tuned hyperparameters with Grid Search and fitted the model, the accuracy and F1 score are up to 97%.
随机森林应用于该项目。 在使用Grid Search调整超参数并拟合模型后,准确性和F1得分高达97%。

The feature importance chart shows that daily internet usage, daily time spent on the site, age, and area income play important roles for consumers' decision — “ Click it or not”!
功能重要性图表显示,每天的互联网使用量,每天在网站上花费的时间,年龄和地区收入对消费者的决定起着重要的作用-“单击或不单击”!

翻译自: https://medium.com/swlh/consumer-behavior-analysis-click-or-not-6092491a89a2
消费者行为分析


 218
218

 被折叠的 条评论
为什么被折叠?
被折叠的 条评论
为什么被折叠?
 到【灌水乐园】发言


